| Param | Original file | Final file |
|---|---|---|
| Filename | modeM0/AS1C09_011T08_9000006482_52878cztM0_level2.fits | modeM0/AS1C09_011T08_9000006482_52878cztM0_level2_quad_clean.evt |
| Size (bytes) | 926,072,640 | 83,750,400 |
| Size | 883.2 MB | 79.9 MB |
| Events in quadrant A | 11,670,200 | 342,217 |
| Events in quadrant B | 6,998,293 | 627,750 |
| Events in quadrant C | 6,730,123 | 569,556 |
| Events in quadrant D | 8,361,379 | 525,756 |
| Mode M0 | |||
|---|---|---|---|
| Quadrant | BADHDUFLAG | Total packets | Discarded packets |
| A | 0 | 39218 | 1 |
| B | 0 | 25433 | 1 |
| C | 0 | 24819 | 1 |
| D | 0 | 29506 | 7 |
| Mode M9 | |||
|---|---|---|---|
| Quadrant | BADHDUFLAG | Total packets | Discarded packets |
| A | 0 | 5 | 0 |
| B | 0 | 5 | 0 |
| C | 0 | 5 | 0 |
| D | 0 | 5 | 0 |
| Mode SS | |||
|---|---|---|---|
| Quadrant | BADHDUFLAG | Total packets | Discarded packets |
| A | 0 | 138 | 0 |
| B | 0 | 138 | 0 |
| C | 0 | 138 | 0 |
| D | 0 | 138 | 0 |
| Quadrant | Total seconds | Saturated seconds | Saturation percentage |
|---|---|---|---|
| A | 6740 | 3495 | 51.854599% |
| B | 6741 | 1063 | 15.769174% |
| C | 6741 | 1058 | 15.695001% |
| D | 6740 | 1466 | 21.750742% |
Noise dominated data is calculated using 1-second bins in cleaned event files. If a bin has >2000 counts, and if more than 50% of those come from <1% of pixels, then it is considered to be noise-dominated and hence unusable.
| Quadrant | # 1 sec bins | Bins with >0 counts | Bins with >2000 counts | High rate bins dominated by noise | Noise dominated (total time) | Noise dominated (detector-on time) | Marked lightcurve |
|---|---|---|---|---|---|---|---|
| A | 7279 | 6739 | 3164 | 3164 | 43.47% | 46.95% | 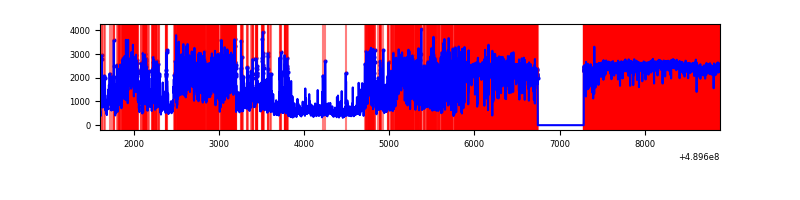 |
| B | 7281 | 6742 | 879 | 879 | 12.07% | 13.04% | 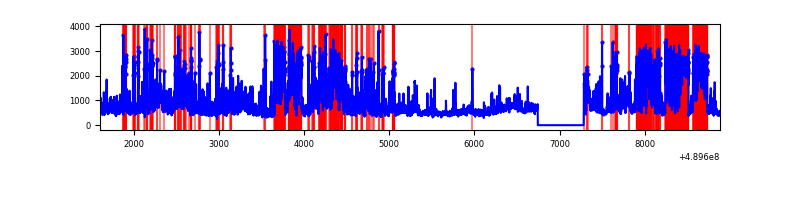 |
| C | 7281 | 6742 | 921 | 921 | 12.65% | 13.66% | 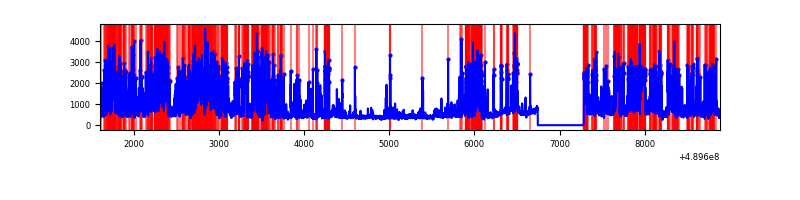 |
| D | 7280 | 6741 | 1385 | 1385 | 19.02% | 20.55% | 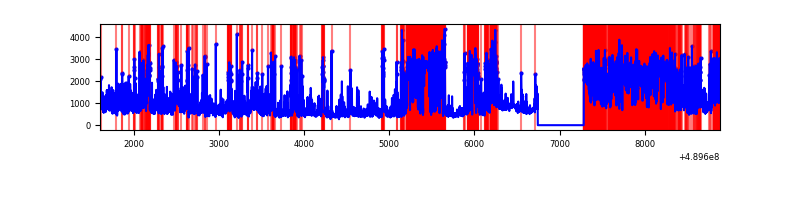 |
Top three noisy pixels from each quadrant. If the there are fewer than three noisy pixels in the level2.evt file, extra rows are filled as -1
| Pixel properties | Quadrant properties | ||||||
|---|---|---|---|---|---|---|---|
| Quadrant | DetID | PixID | Counts | Sigma | Mean | Median | Sigma |
| A | 9 | 191 | 9245492 | 70495.95 | 508 | 494 | 131.1 |
| A | 0 | 8 | 116106 | 881.58 | 508 | 494 | 131.1 |
| A | 15 | 174 | 52078 | 393.34 | 508 | 494 | 131.1 |
| B | 8 | 3 | 3617868 | 25617.8 | 671 | 650 | 141.2 |
| B | 4 | 81 | 206161 | 1455.47 | 671 | 650 | 141.2 |
| B | 5 | 200 | 109861 | 773.45 | 671 | 650 | 141.2 |
| C | 2 | 12 | 1658631 | 9078.2 | 655 | 647 | 182.6 |
| C | 15 | 224 | 1128628 | 6176.2 | 655 | 647 | 182.6 |
| C | 4 | 5 | 292911 | 1600.28 | 655 | 647 | 182.6 |
| D | 8 | 176 | 3244257 | 17075.53 | 647 | 617 | 190.0 |
| D | 12 | 17 | 1313024 | 6908.92 | 647 | 617 | 190.0 |
| D | 15 | 125 | 385252 | 2024.84 | 647 | 617 | 190.0 |
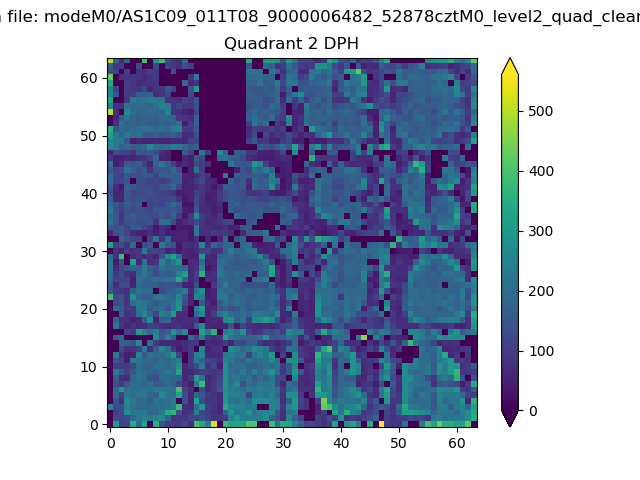
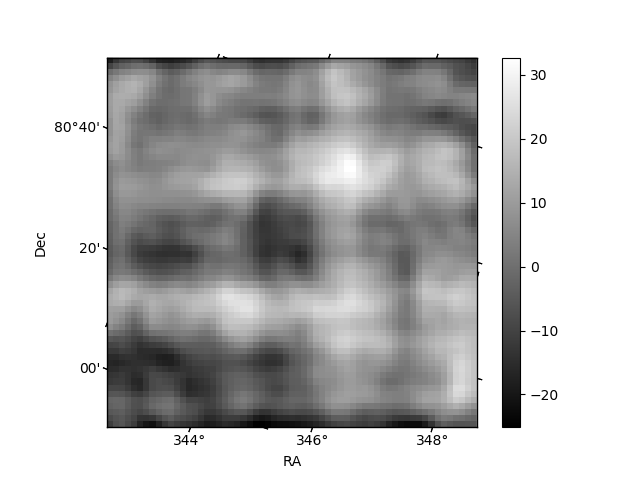
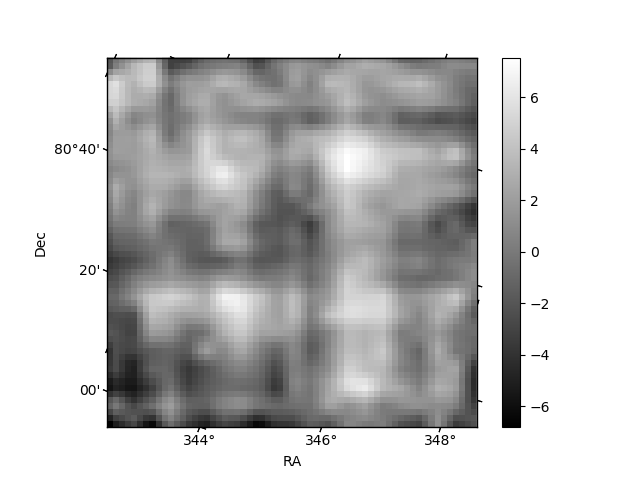
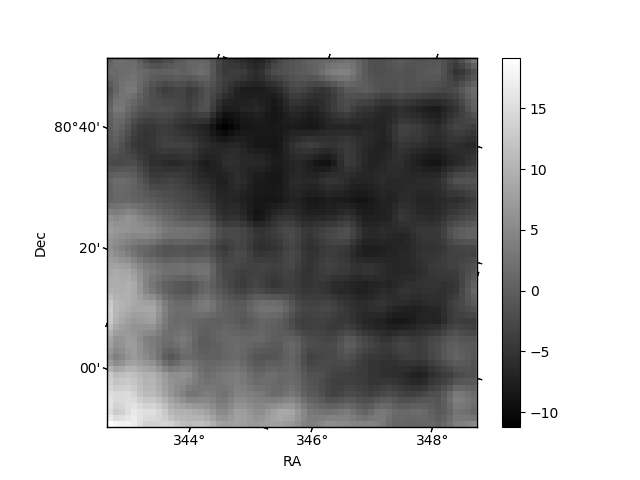
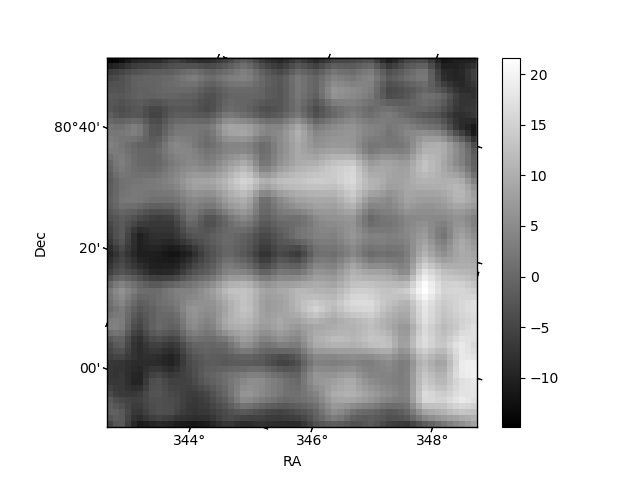
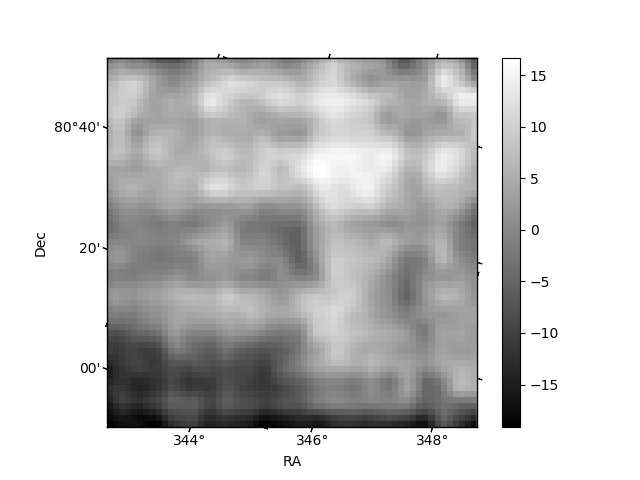
Histogram calculated using DETX and DETY for each event in the final _common_clean file
| Quadrant A | 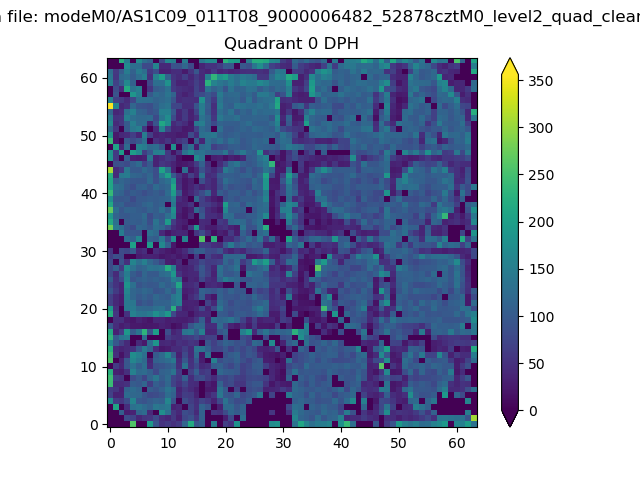 |
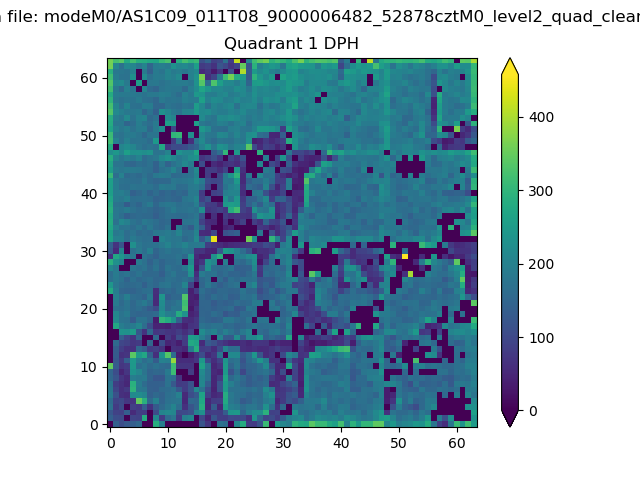 |
Quadrant B |
|---|---|---|---|
| Quadrant D | 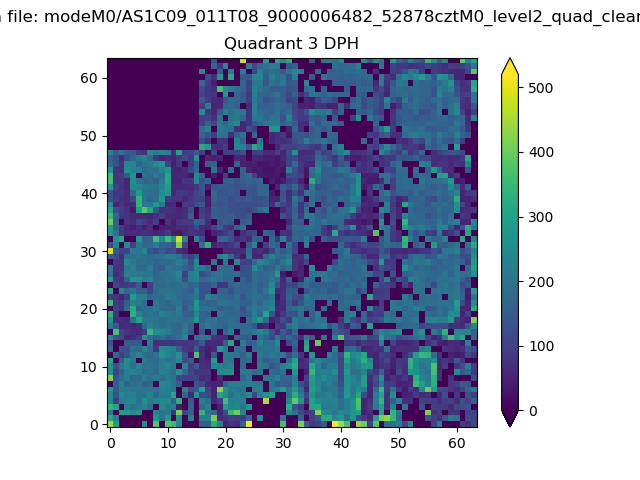 |
 |
Quadrant C |
| Plot type | Count rate plots | Images |
|---|---|---|
| Comparison with Poisson distribution Blue bars denote a histogram of data divided into 1 sec bins. Red curve is a Poisson curve with rate = median count rate of data. |
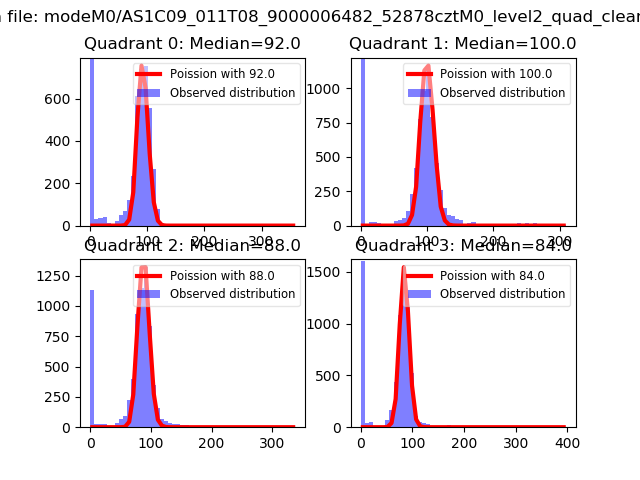 |
 |
| Quadrant-wise count rates Data is divided into 100 sec bins |
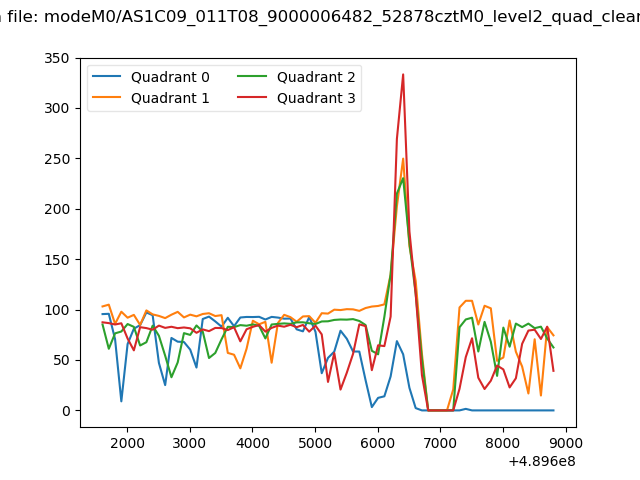 |
|
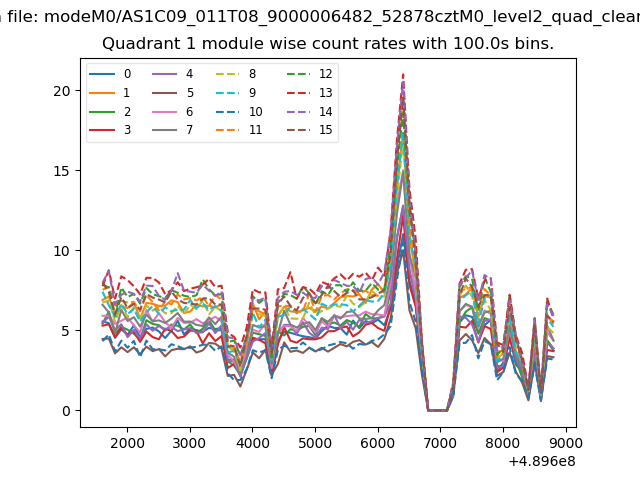
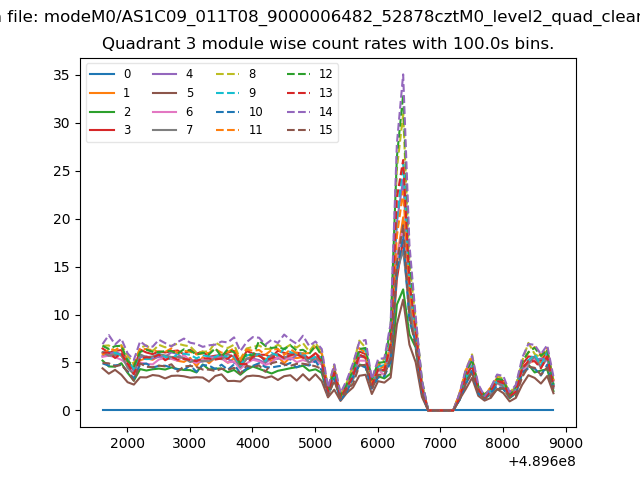
| Module-wise count rates for Quadrant A Data is divided into 100 sec bins |
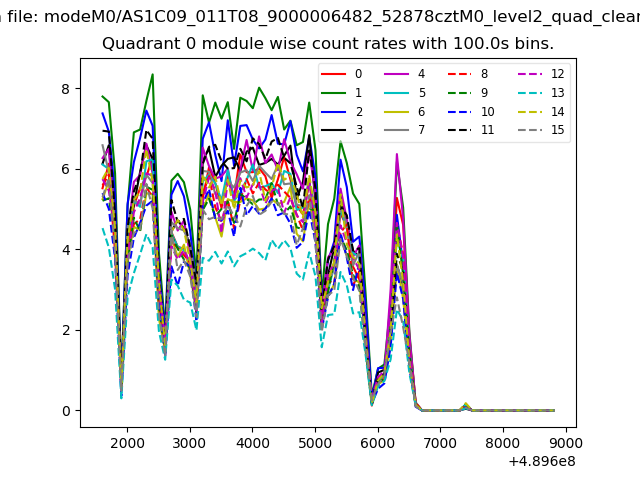 |
 |
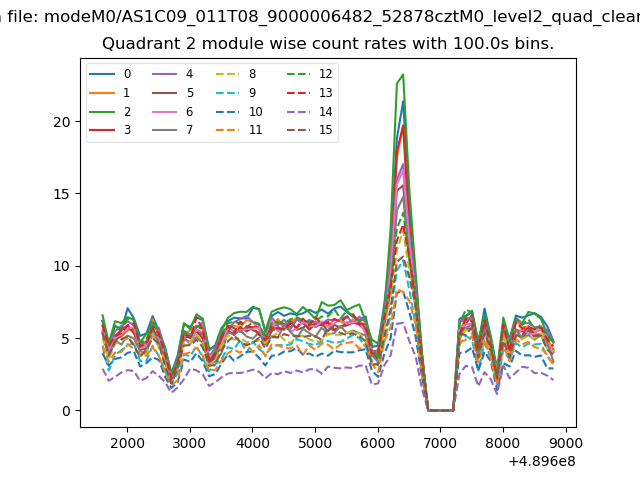
| Module-wise count rates for Quadrant B Data is divided into 100 sec bins |
 |
 |
| Module-wise count rates for Quadrant C Data is divided into 100 sec bins |
 |
 |
| Module-wise count rates for Quadrant D Data is divided into 100 sec bins |
 |
 |
| Parameter | Plot |
|---|---|
| CZT HV Monitor | 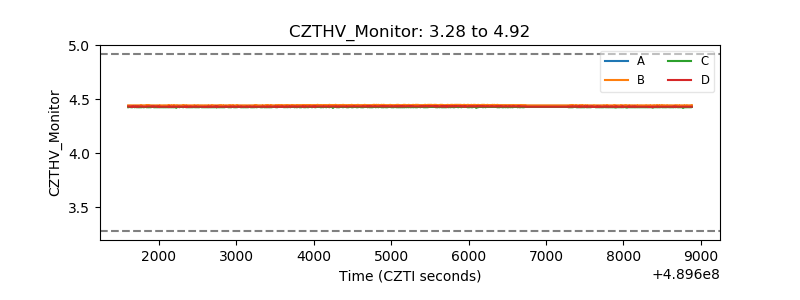 |
| D_VDD | 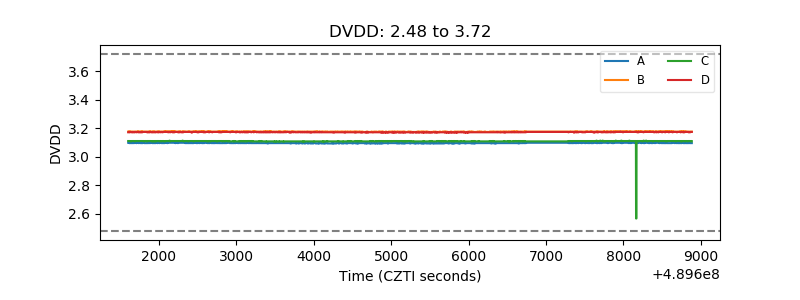 |
| Temperature 1 | 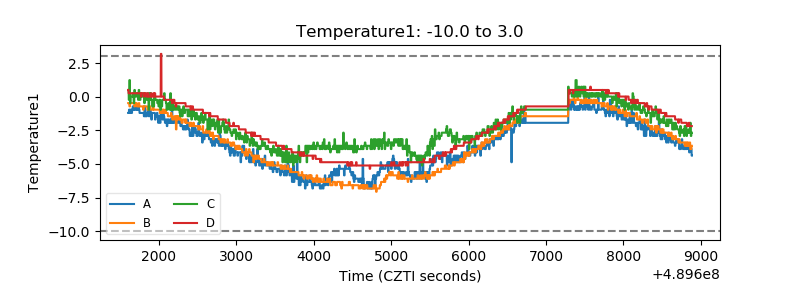 |
| Veto HV Monitor | 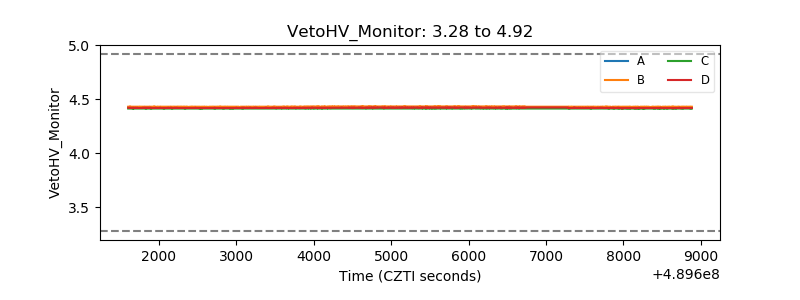 |
| Veto LLD | 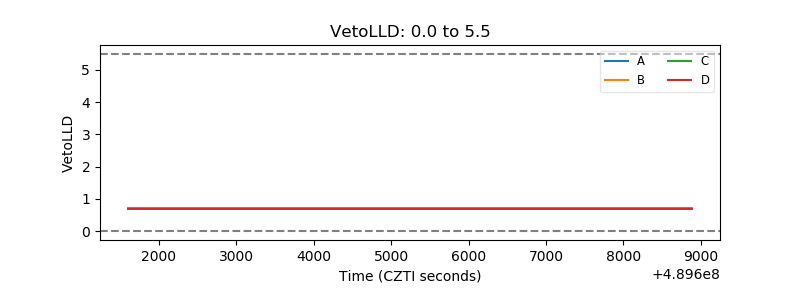 |
| Alpha Counter | 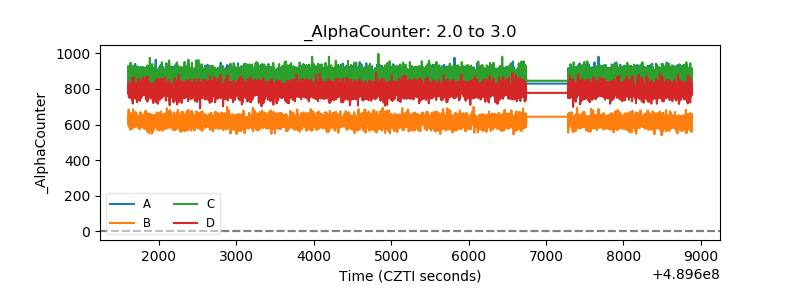 |
| _CPM_Rate | 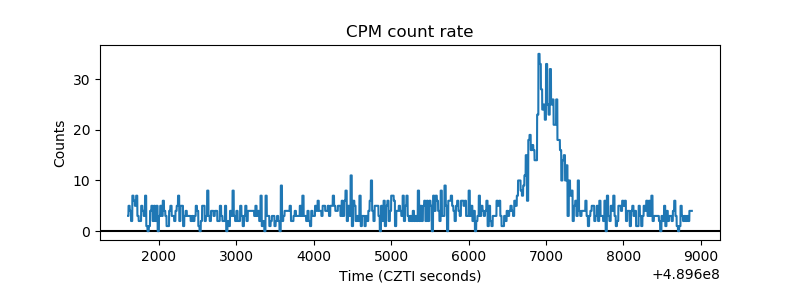 |
| CZT Counter | 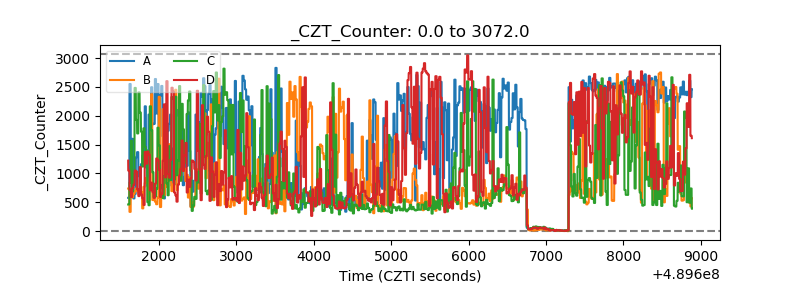 |
| +2.5 Volts monitor | 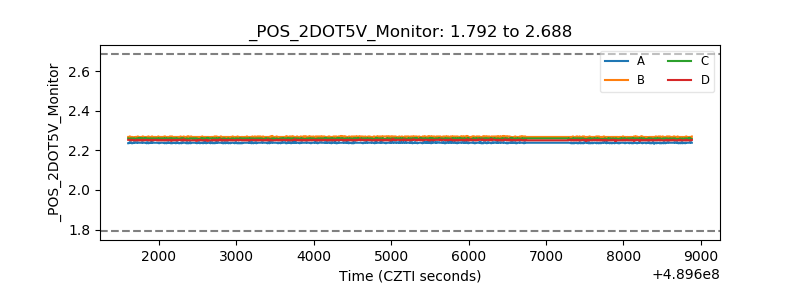 |
| +5 Volts monitor |  |
| _ROLL_ROT | 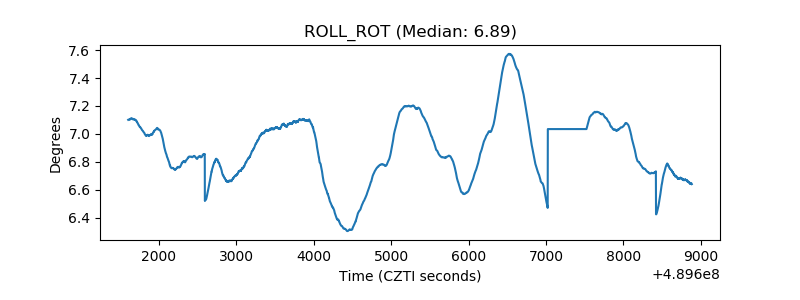 |
| _Roll_DEC | 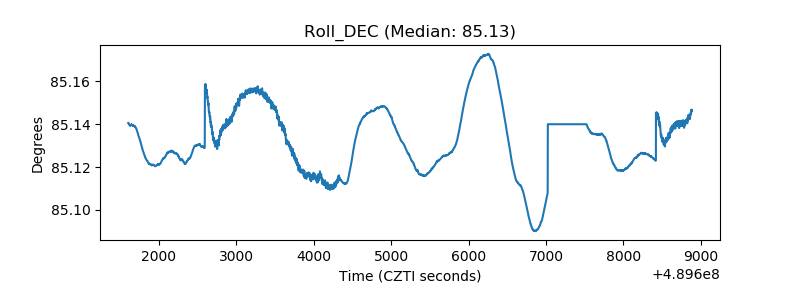 |
| _Roll_RA | 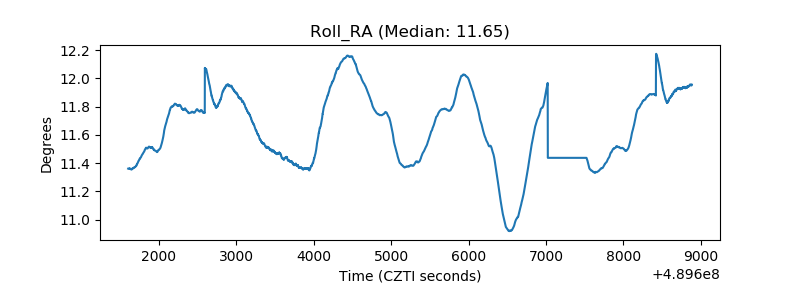 |
| Veto Counter | 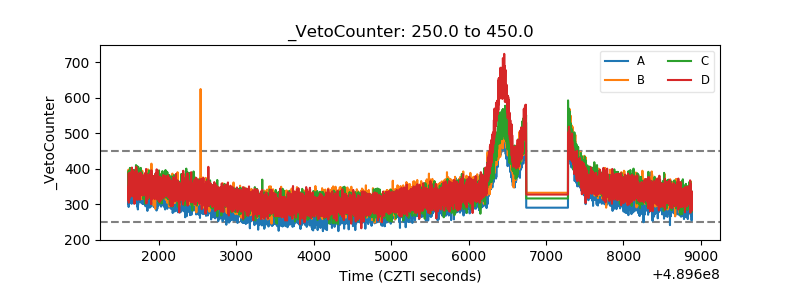 |