| Param | Original file | Final file |
|---|---|---|
| Filename | modeM0/AS1C09_011T08_9000006482_52879cztM0_level2.fits | modeM0/AS1C09_011T08_9000006482_52879cztM0_level2_quad_clean.evt |
| Size (bytes) | 1,098,432,000 | 82,923,840 |
| Size | 1.0 GB | 79.1 MB |
| Events in quadrant A | 15,887,098 | 198,568 |
| Events in quadrant B | 8,369,108 | 622,609 |
| Events in quadrant C | 5,950,857 | 630,708 |
| Events in quadrant D | 9,867,101 | 530,015 |
| Mode M0 | |||
|---|---|---|---|
| Quadrant | BADHDUFLAG | Total packets | Discarded packets |
| A | 0 | 52235 | 0 |
| B | 0 | 30071 | 0 |
| C | 0 | 23262 | 0 |
| D | 0 | 34615 | 0 |
| Mode SS | |||
|---|---|---|---|
| Quadrant | BADHDUFLAG | Total packets | Discarded packets |
| A | 0 | 152 | 0 |
| B | 0 | 152 | 0 |
| C | 0 | 152 | 0 |
| D | 0 | 152 | 0 |
| Quadrant | Total seconds | Saturated seconds | Saturation percentage |
|---|---|---|---|
| A | 7592 | 5708 | 75.184405% |
| B | 7592 | 1652 | 21.759747% |
| C | 7592 | 804 | 10.590095% |
| D | 7593 | 1829 | 24.087976% |
Noise dominated data is calculated using 1-second bins in cleaned event files. If a bin has >2000 counts, and if more than 50% of those come from <1% of pixels, then it is considered to be noise-dominated and hence unusable.
| Quadrant | # 1 sec bins | Bins with >0 counts | Bins with >2000 counts | High rate bins dominated by noise | Noise dominated (total time) | Noise dominated (detector-on time) | Marked lightcurve |
|---|---|---|---|---|---|---|---|
| A | 7591 | 7591 | 5529 | 5529 | 72.84% | 72.84% | 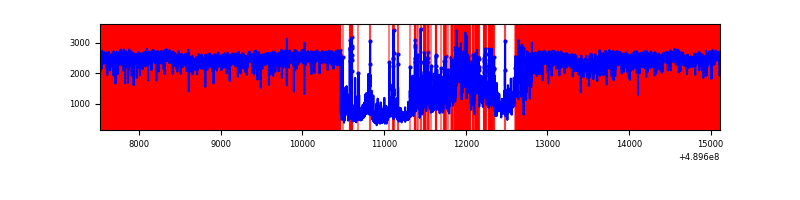 |
| B | 7592 | 7592 | 1243 | 1243 | 16.37% | 16.37% | 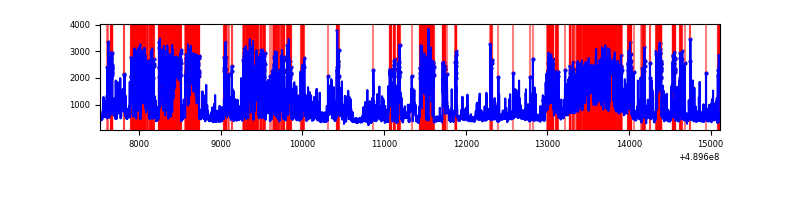 |
| C | 7592 | 7592 | 620 | 620 | 8.17% | 8.17% | 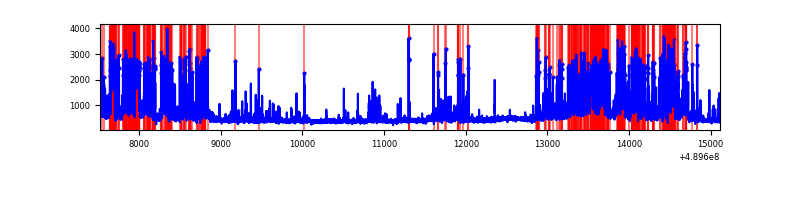 |
| D | 7593 | 7593 | 1729 | 1729 | 22.77% | 22.77% | 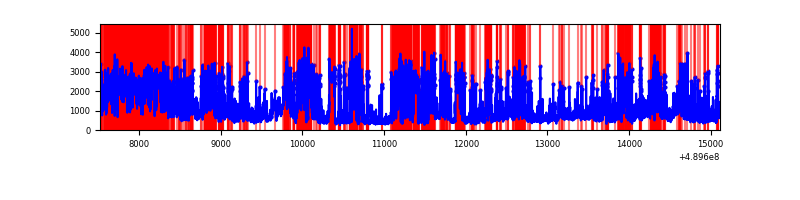 |
Top three noisy pixels from each quadrant. If the there are fewer than three noisy pixels in the level2.evt file, extra rows are filled as -1
| Pixel properties | Quadrant properties | ||||||
|---|---|---|---|---|---|---|---|
| Quadrant | DetID | PixID | Counts | Sigma | Mean | Median | Sigma |
| A | 9 | 191 | 13728178 | 149164.82 | 360 | 351 | 92.0 |
| A | 15 | 174 | 208763 | 2264.58 | 360 | 351 | 92.0 |
| A | 0 | 8 | 207027 | 2245.72 | 360 | 351 | 92.0 |
| B | 8 | 3 | 4039431 | 25996.44 | 738 | 713 | 155.4 |
| B | 4 | 81 | 779059 | 5010.06 | 738 | 713 | 155.4 |
| B | 8 | 128 | 93714 | 598.63 | 738 | 713 | 155.4 |
| C | 15 | 224 | 1355803 | 6515.43 | 752 | 745 | 208.0 |
| C | 13 | 3 | 483597 | 2321.66 | 752 | 745 | 208.0 |
| C | 2 | 12 | 207219 | 992.77 | 752 | 745 | 208.0 |
| D | 8 | 176 | 3544866 | 16680.64 | 718 | 684 | 212.5 |
| D | 12 | 17 | 1416329 | 6662.71 | 718 | 684 | 212.5 |
| D | 2 | 37 | 353490 | 1660.48 | 718 | 684 | 212.5 |
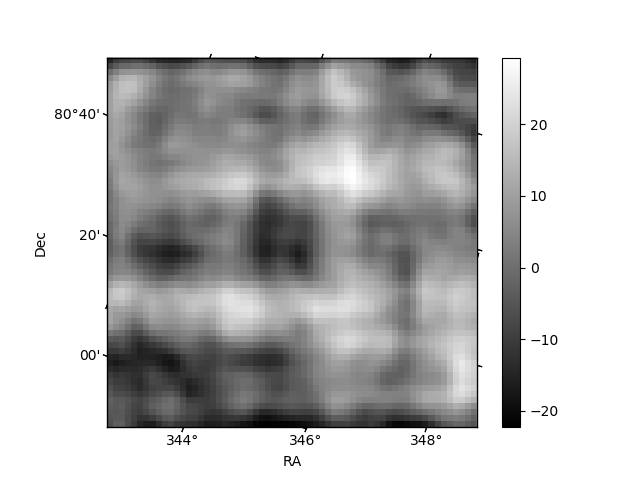
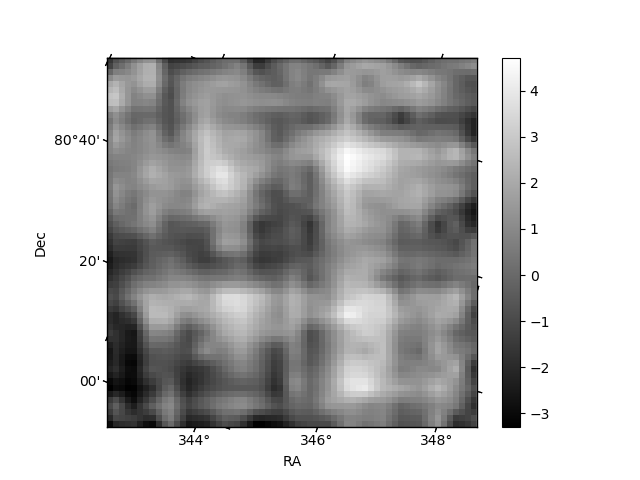
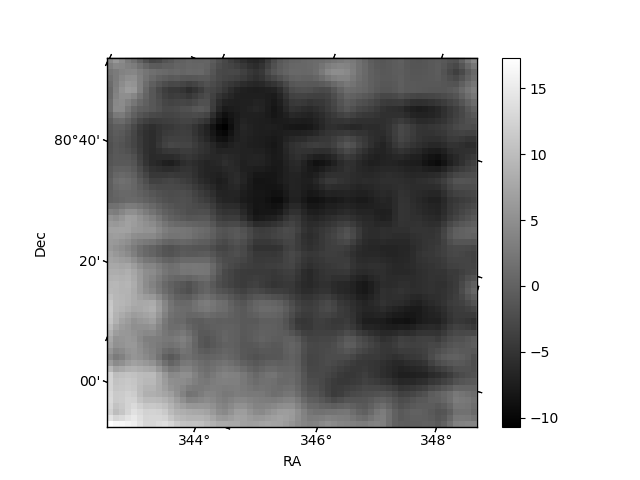
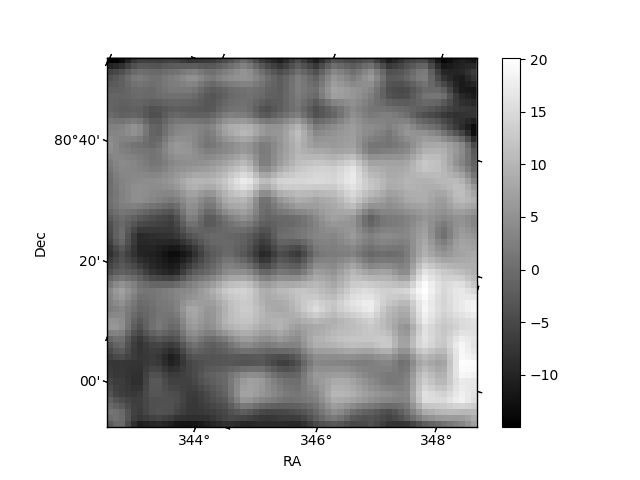
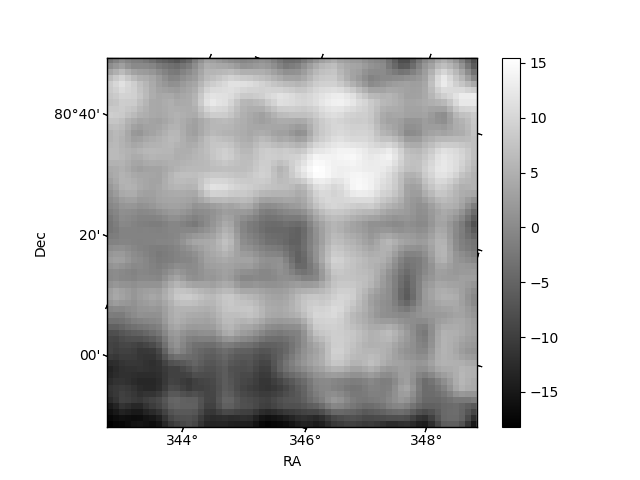
Histogram calculated using DETX and DETY for each event in the final _common_clean file
| Quadrant A | 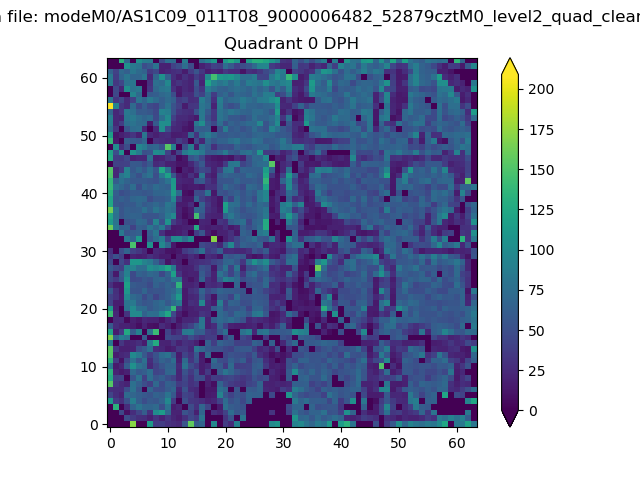 |
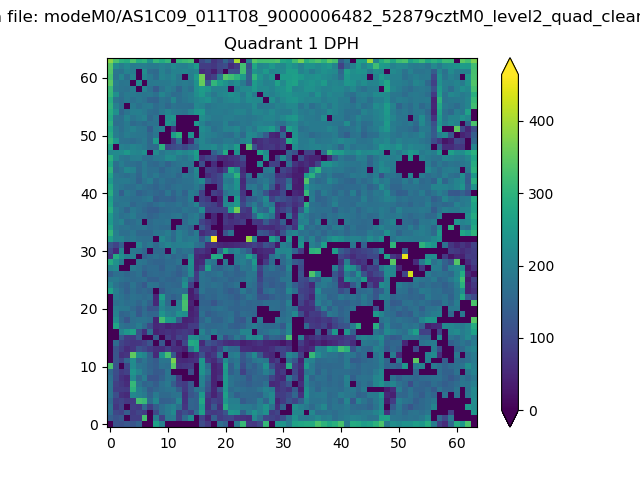 |
Quadrant B |
|---|---|---|---|
| Quadrant D | 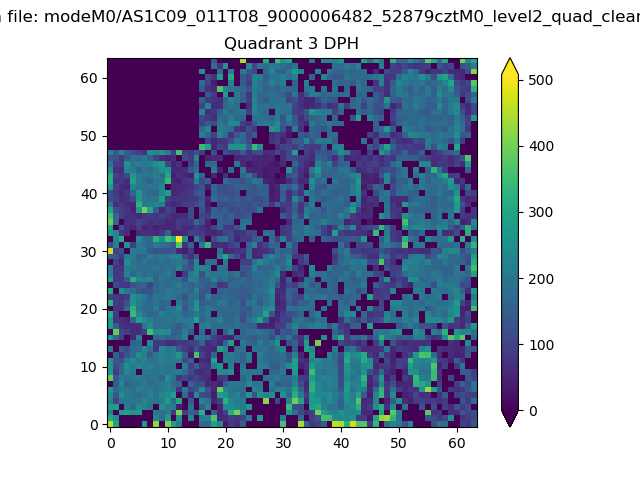 |
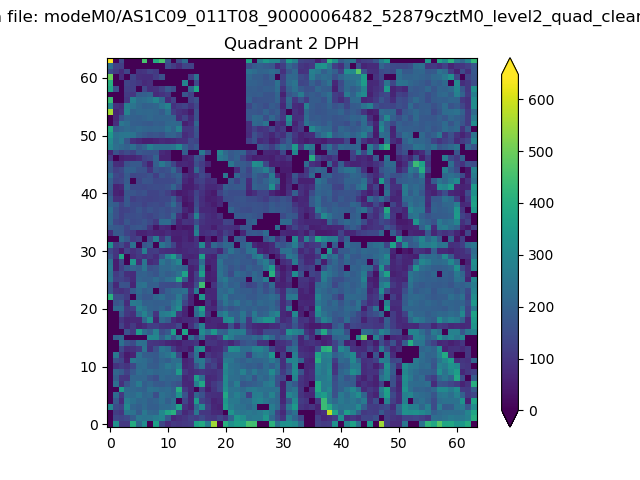 |
Quadrant C |
| Plot type | Count rate plots | Images |
|---|---|---|
| Comparison with Poisson distribution Blue bars denote a histogram of data divided into 1 sec bins. Red curve is a Poisson curve with rate = median count rate of data. |
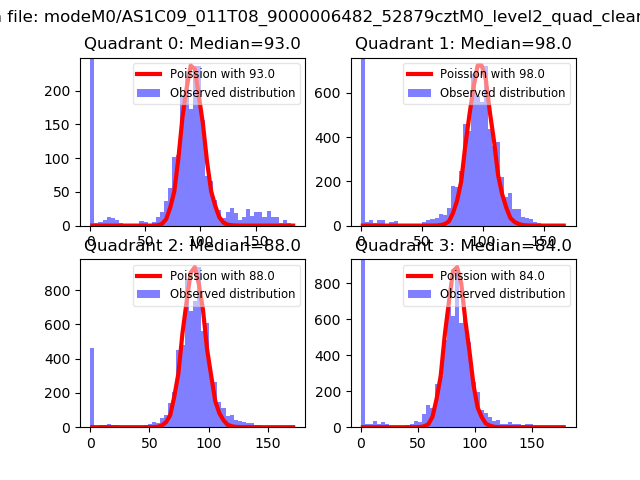 |
 |
| Quadrant-wise count rates Data is divided into 100 sec bins |
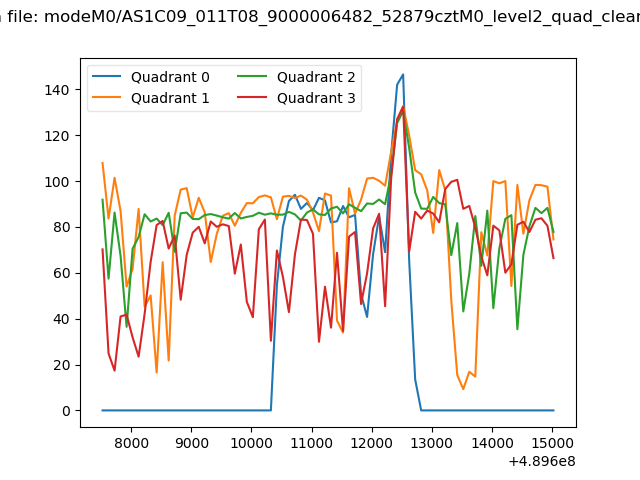 |
|
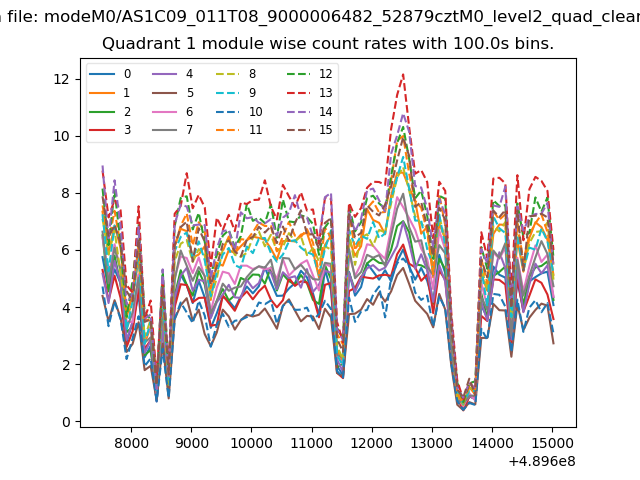
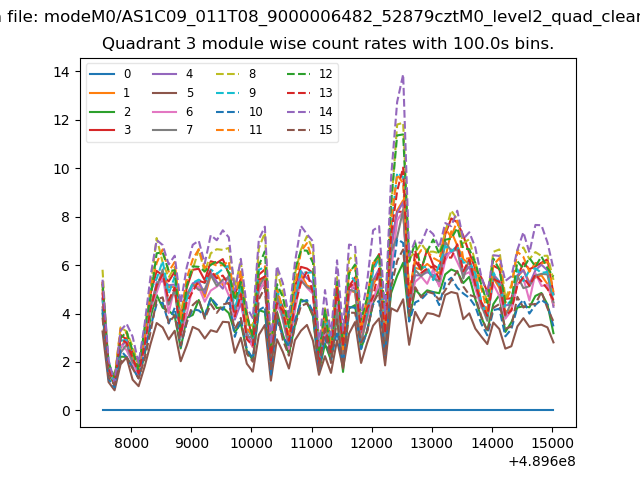
| Module-wise count rates for Quadrant A Data is divided into 100 sec bins |
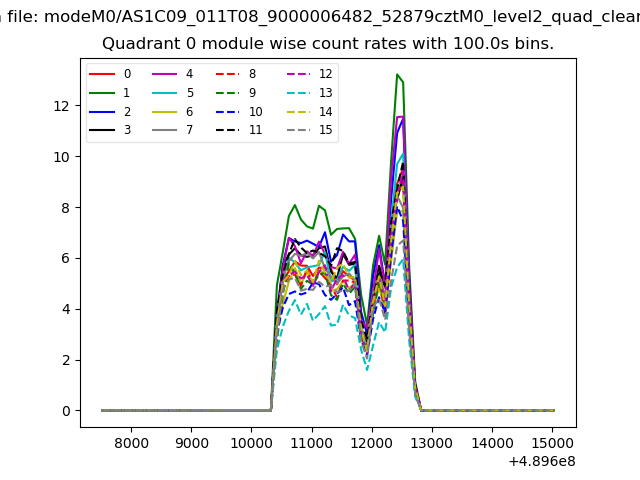 |
 |
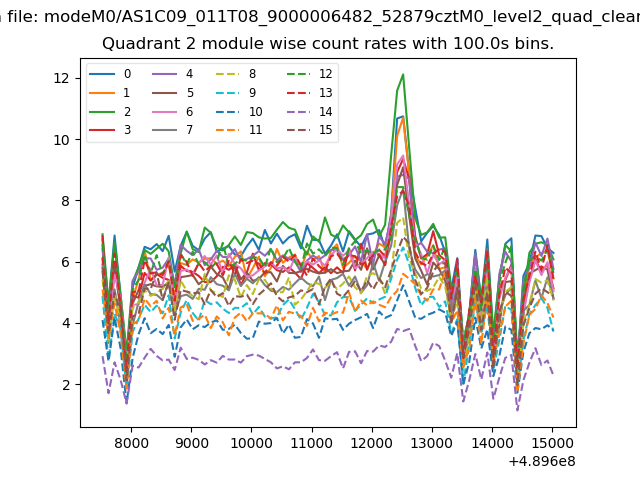
| Module-wise count rates for Quadrant B Data is divided into 100 sec bins |
 |
 |
| Module-wise count rates for Quadrant C Data is divided into 100 sec bins |
 |
 |
| Module-wise count rates for Quadrant D Data is divided into 100 sec bins |
 |
 |
| Parameter | Plot |
|---|---|
| CZT HV Monitor | 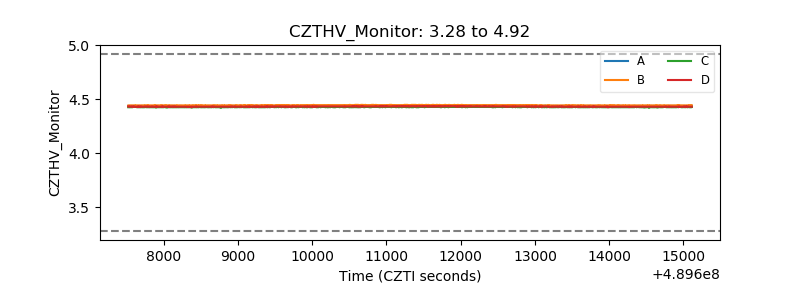 |
| D_VDD | 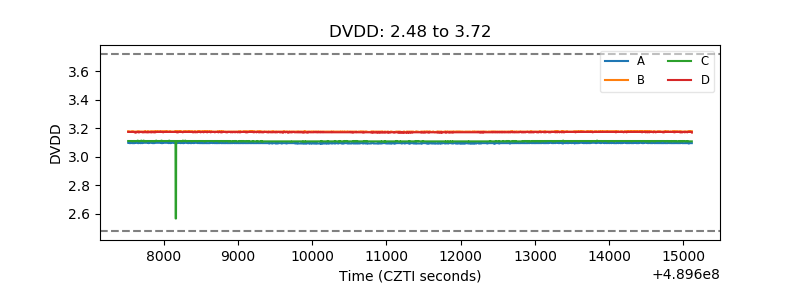 |
| Temperature 1 | 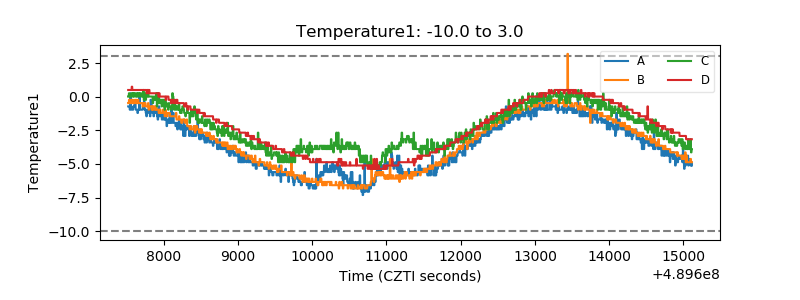 |
| Veto HV Monitor | 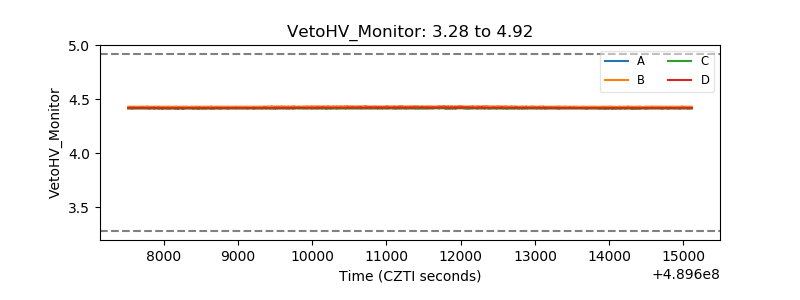 |
| Veto LLD | 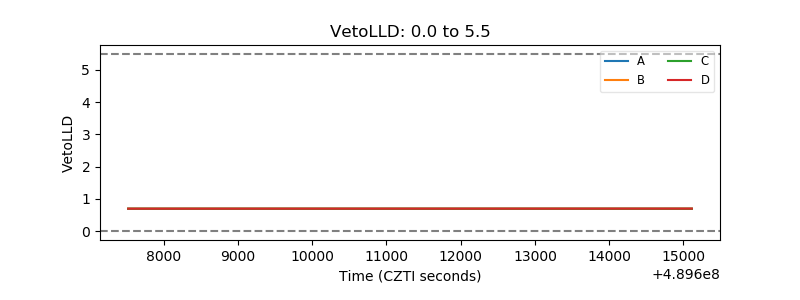 |
| Alpha Counter | 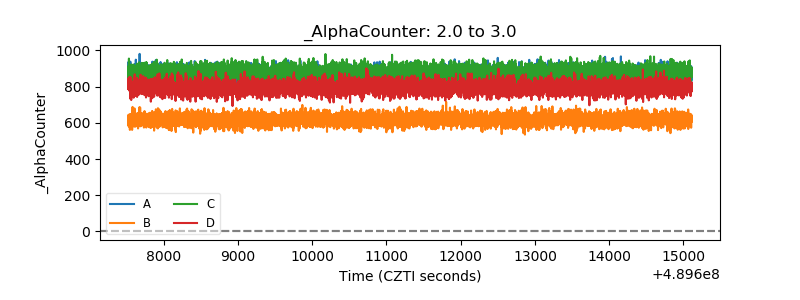 |
| _CPM_Rate | 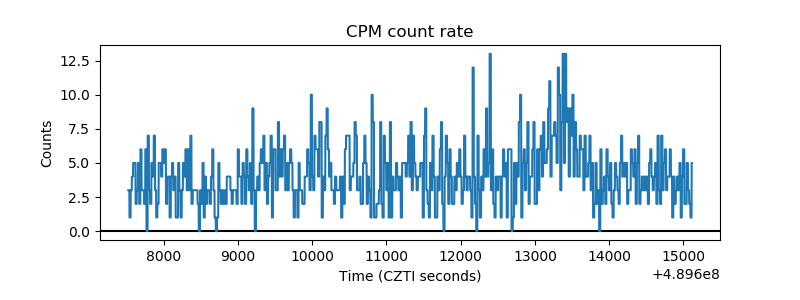 |
| CZT Counter | 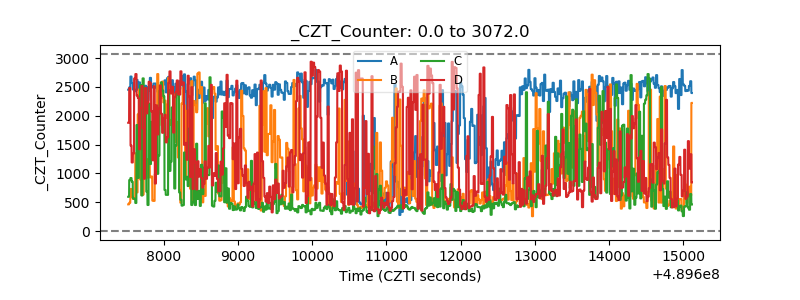 |
| +2.5 Volts monitor |  |
| +5 Volts monitor |  |
| _ROLL_ROT | 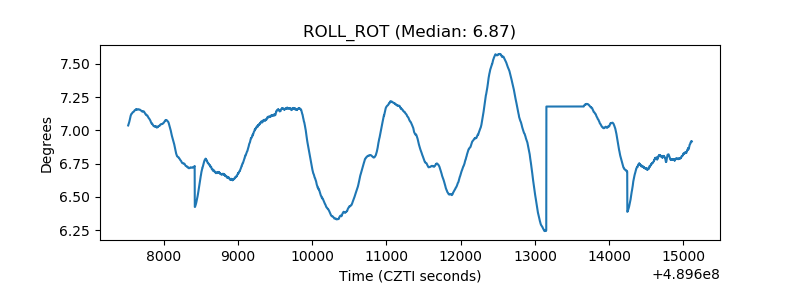 |
| _Roll_DEC | 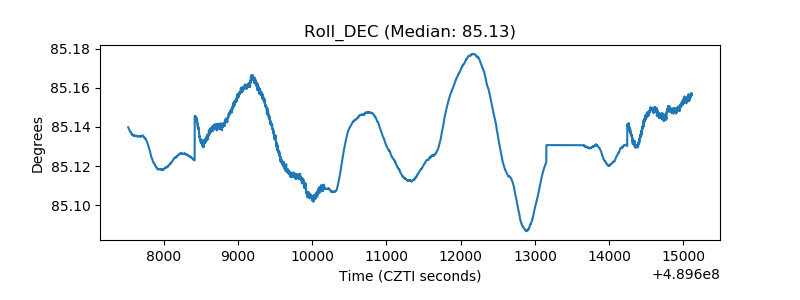 |
| _Roll_RA | 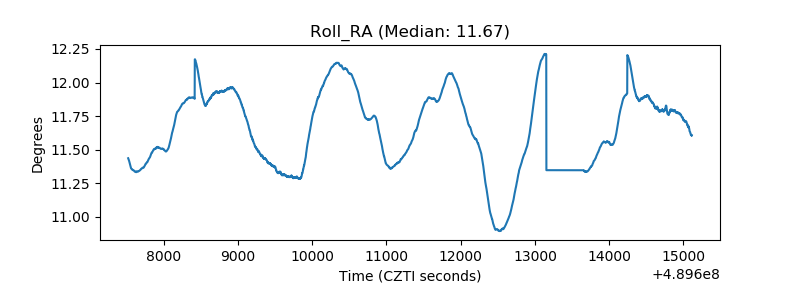 |
| Veto Counter | 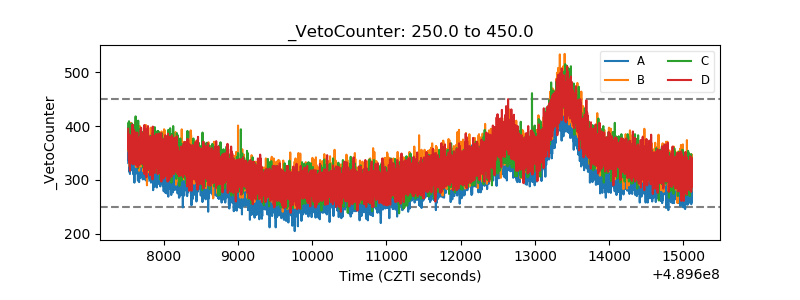 |