| Param | Original file | Final file |
|---|---|---|
| Filename | modeM0/AS1C09_011T08_9000006482_52880cztM0_level2.fits | modeM0/AS1C09_011T08_9000006482_52880cztM0_level2_quad_clean.evt |
| Size (bytes) | 1,041,641,280 | 85,371,840 |
| Size | 993.4 MB | 81.4 MB |
| Events in quadrant A | 18,813,780 | 51,478 |
| Events in quadrant B | 6,260,171 | 721,564 |
| Events in quadrant C | 6,504,973 | 620,313 |
| Events in quadrant D | 6,376,234 | 649,694 |
| Mode M0 | |||
|---|---|---|---|
| Quadrant | BADHDUFLAG | Total packets | Discarded packets |
| A | 0 | 60945 | 0 |
| B | 0 | 24227 | 0 |
| C | 0 | 25106 | 0 |
| D | 0 | 24474 | 1 |
| Mode SS | |||
|---|---|---|---|
| Quadrant | BADHDUFLAG | Total packets | Discarded packets |
| A | 0 | 156 | 0 |
| B | 0 | 156 | 0 |
| C | 0 | 156 | 0 |
| D | 0 | 156 | 0 |
| Quadrant | Total seconds | Saturated seconds | Saturation percentage |
|---|---|---|---|
| A | 7786 | 7313 | 93.924994% |
| B | 7786 | 731 | 9.388646% |
| C | 7786 | 1010 | 12.972001% |
| D | 7785 | 482 | 6.191394% |
Noise dominated data is calculated using 1-second bins in cleaned event files. If a bin has >2000 counts, and if more than 50% of those come from <1% of pixels, then it is considered to be noise-dominated and hence unusable.
| Quadrant | # 1 sec bins | Bins with >0 counts | Bins with >2000 counts | High rate bins dominated by noise | Noise dominated (total time) | Noise dominated (detector-on time) | Marked lightcurve |
|---|---|---|---|---|---|---|---|
| A | 7785 | 7785 | 7133 | 7133 | 91.62% | 91.62% | 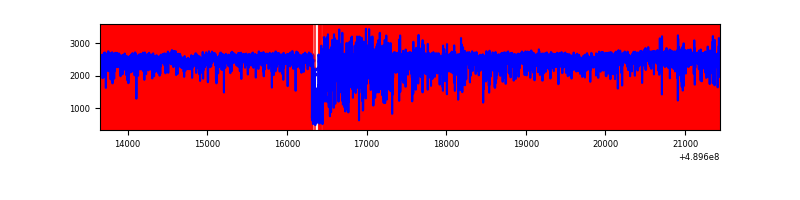 |
| B | 7786 | 7786 | 560 | 560 | 7.19% | 7.19% | 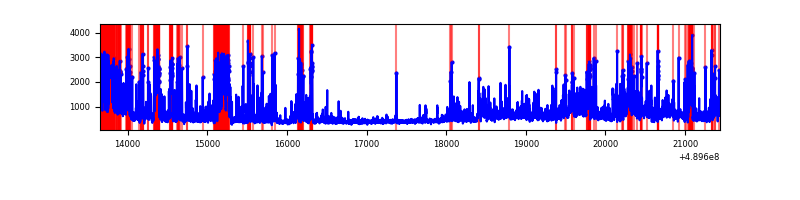 |
| C | 7786 | 7786 | 786 | 786 | 10.10% | 10.10% | 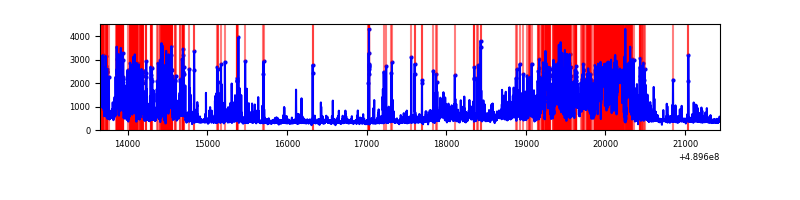 |
| D | 7785 | 7785 | 457 | 457 | 5.87% | 5.87% | 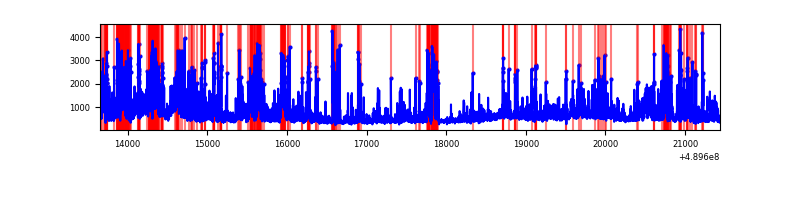 |
Top three noisy pixels from each quadrant. If the there are fewer than three noisy pixels in the level2.evt file, extra rows are filled as -1
| Pixel properties | Quadrant properties | ||||||
|---|---|---|---|---|---|---|---|
| Quadrant | DetID | PixID | Counts | Sigma | Mean | Median | Sigma |
| A | 9 | 191 | 17100737 | 214380.71 | 311 | 305 | 79.8 |
| A | 0 | 8 | 163190 | 2042.02 | 311 | 305 | 79.8 |
| A | 15 | 174 | 62088 | 774.55 | 311 | 305 | 79.8 |
| B | 8 | 3 | 2117186 | 12673.38 | 786 | 758 | 167.0 |
| B | 10 | 44 | 243057 | 1450.91 | 786 | 758 | 167.0 |
| B | 4 | 81 | 116376 | 692.33 | 786 | 758 | 167.0 |
| C | 15 | 224 | 1233420 | 5929.02 | 756 | 750 | 207.9 |
| C | 15 | 158 | 528799 | 2539.86 | 756 | 750 | 207.9 |
| C | 13 | 3 | 494893 | 2376.78 | 756 | 750 | 207.9 |
| D | 8 | 176 | 1084373 | 4733.74 | 791 | 755 | 228.9 |
| D | 3 | 12 | 455647 | 1987.18 | 791 | 755 | 228.9 |
| D | 12 | 17 | 348870 | 1520.73 | 791 | 755 | 228.9 |
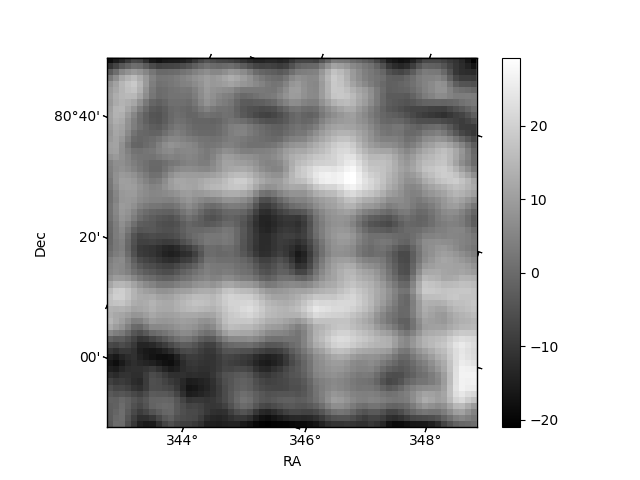
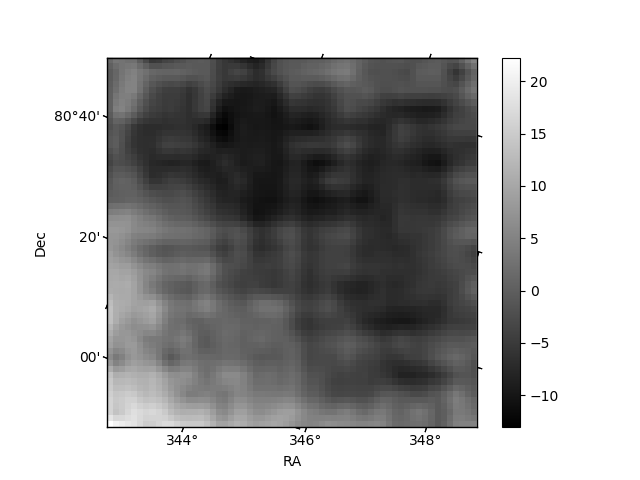
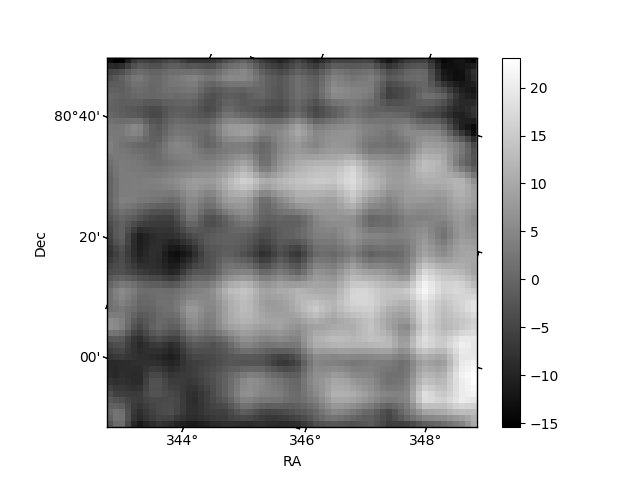
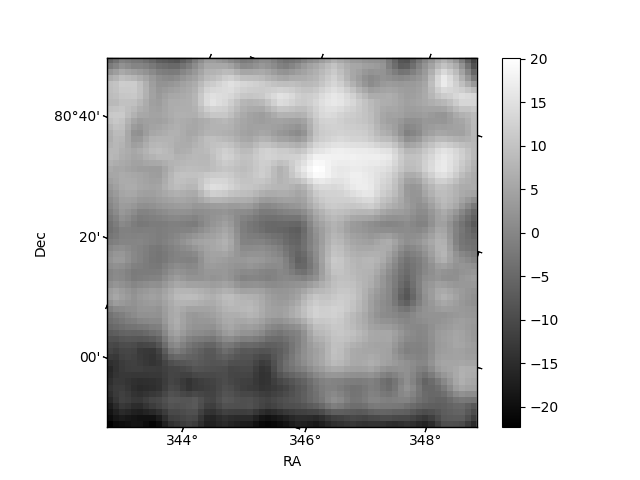
Histogram calculated using DETX and DETY for each event in the final _common_clean file
| Quadrant A | 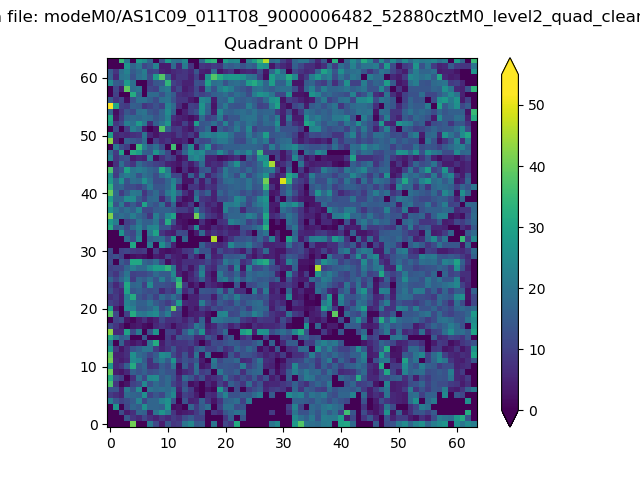 |
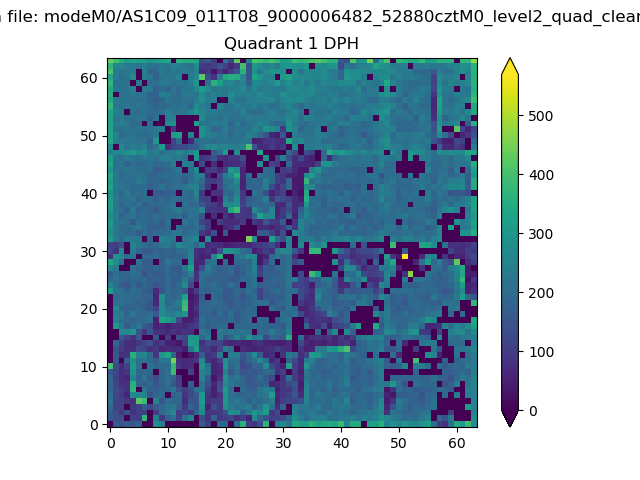 |
Quadrant B |
|---|---|---|---|
| Quadrant D | 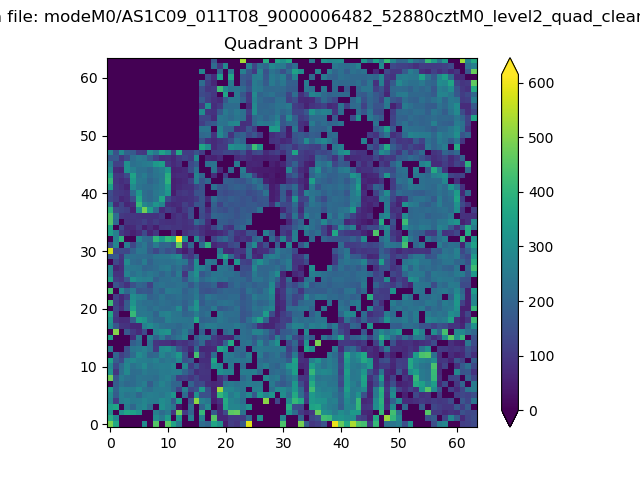 |
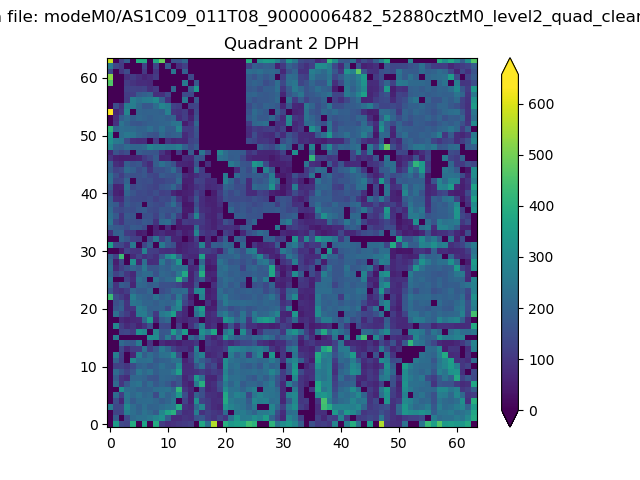 |
Quadrant C |
| Plot type | Count rate plots | Images |
|---|---|---|
| Comparison with Poisson distribution Blue bars denote a histogram of data divided into 1 sec bins. Red curve is a Poisson curve with rate = median count rate of data. |
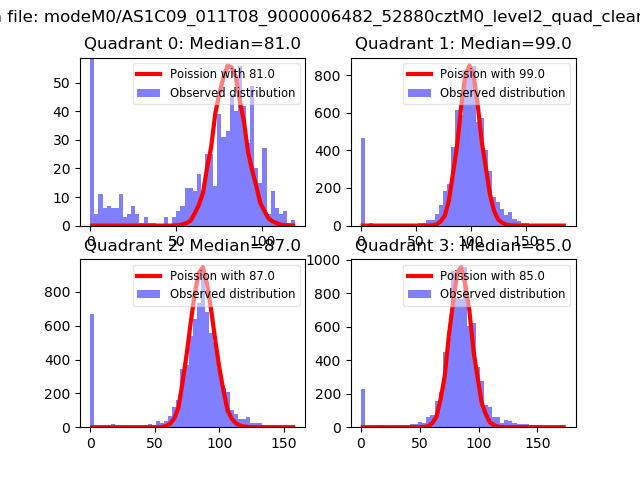 |
 |
| Quadrant-wise count rates Data is divided into 100 sec bins |
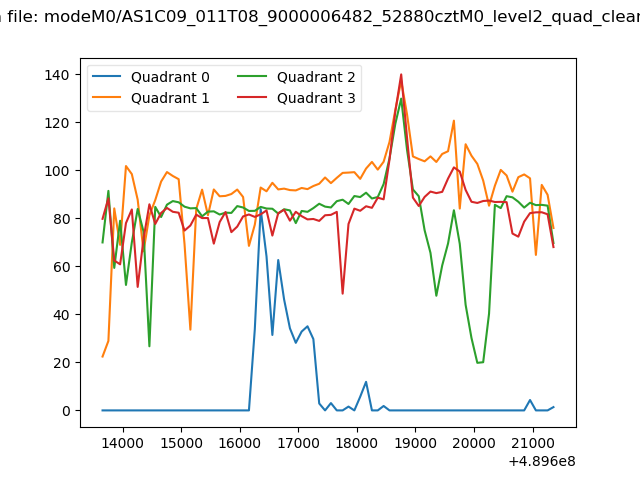 |
|
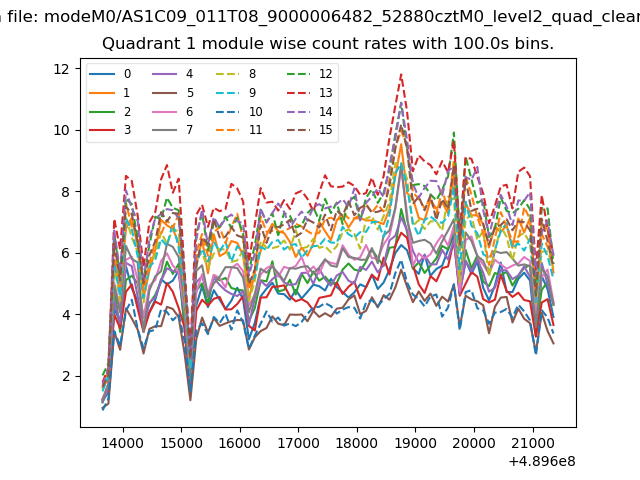
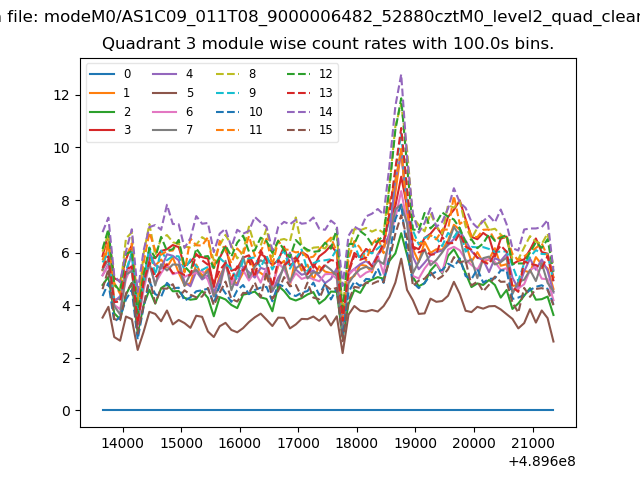
| Module-wise count rates for Quadrant A Data is divided into 100 sec bins |
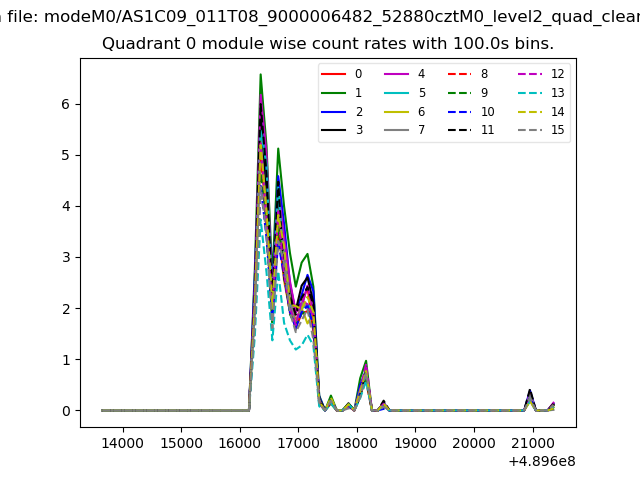 |
 |
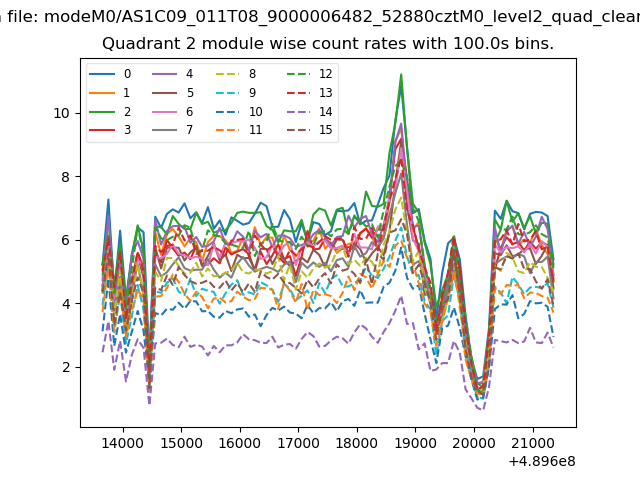
| Module-wise count rates for Quadrant B Data is divided into 100 sec bins |
 |
 |
| Module-wise count rates for Quadrant C Data is divided into 100 sec bins |
 |
 |
| Module-wise count rates for Quadrant D Data is divided into 100 sec bins |
 |
 |
| Parameter | Plot |
|---|---|
| CZT HV Monitor | 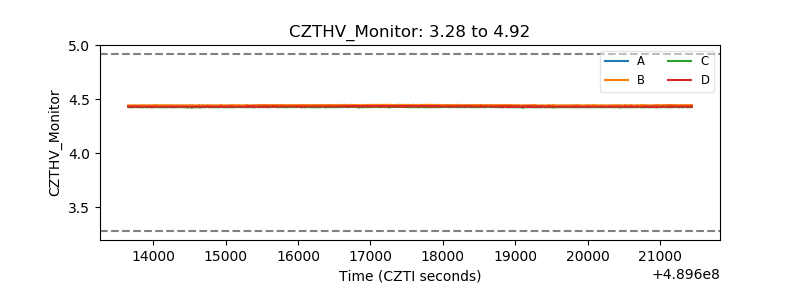 |
| D_VDD | 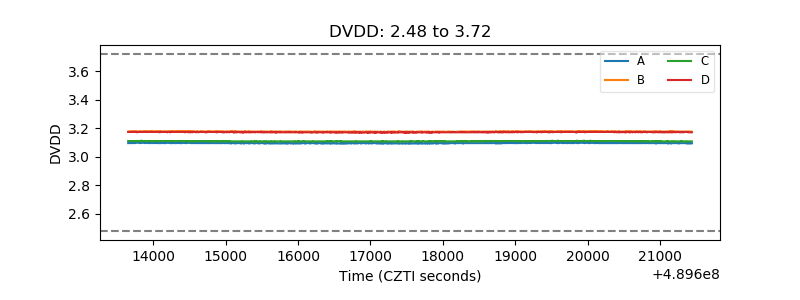 |
| Temperature 1 | 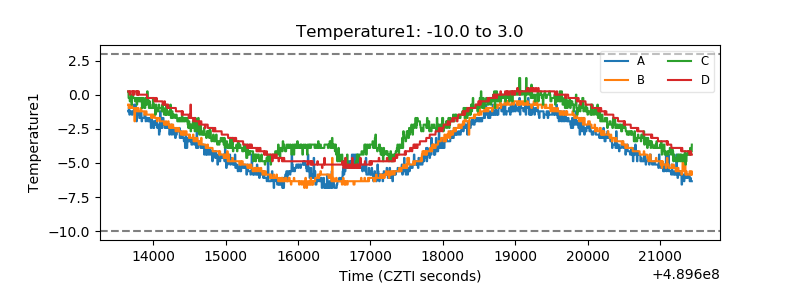 |
| Veto HV Monitor |  |
| Veto LLD | 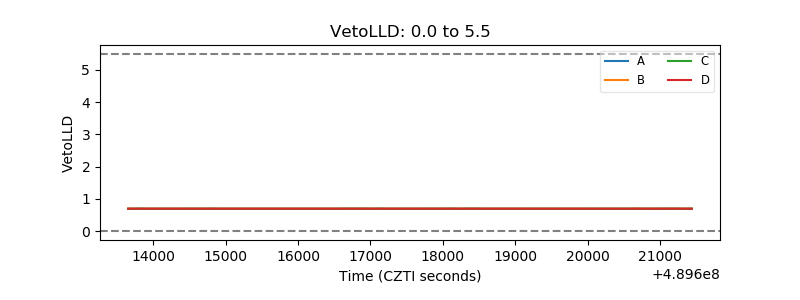 |
| Alpha Counter | 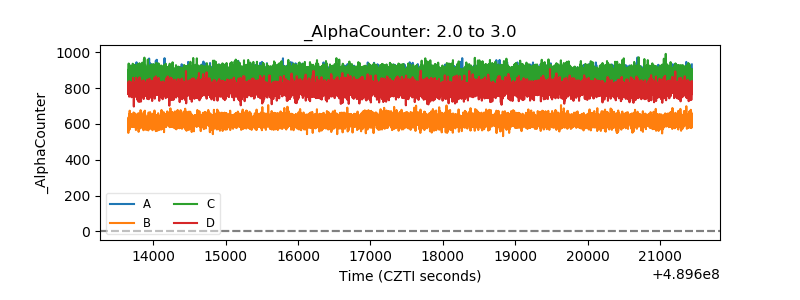 |
| _CPM_Rate |  |
| CZT Counter | 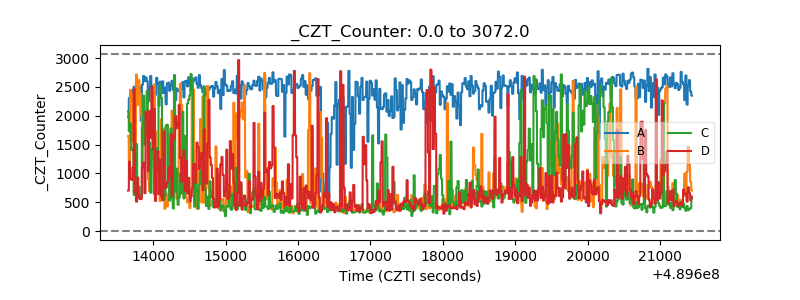 |
| +2.5 Volts monitor |  |
| +5 Volts monitor |  |
| _ROLL_ROT | 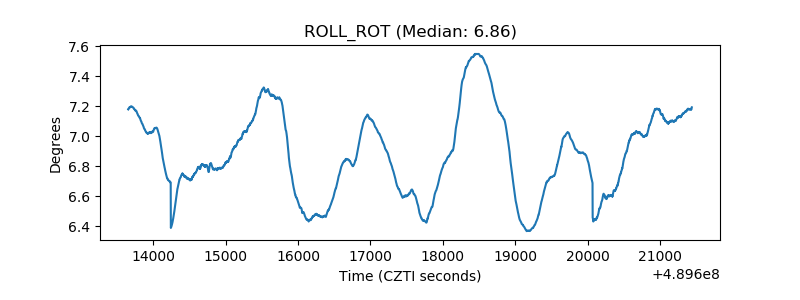 |
| _Roll_DEC | 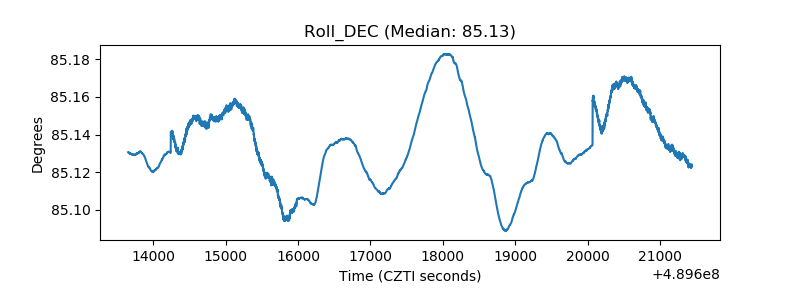 |
| _Roll_RA | 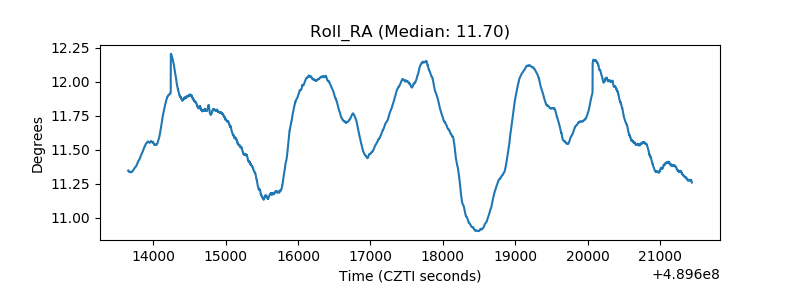 |
| Veto Counter | 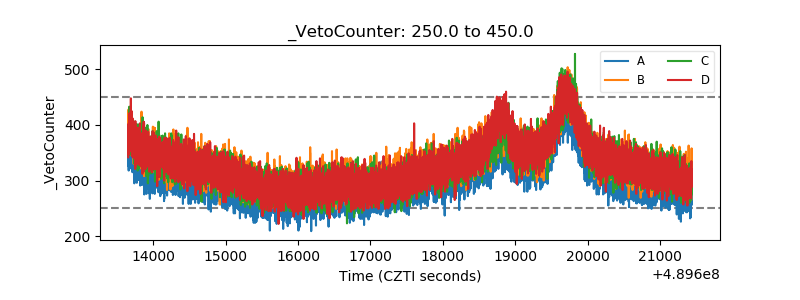 |