| Param | Original file | Final file |
|---|---|---|
| Filename | modeM0/AS1C09_011T08_9000006482_52884cztM0_level2.fits | modeM0/AS1C09_011T08_9000006482_52884cztM0_level2_quad_clean.evt |
| Size (bytes) | 648,596,160 | 85,285,440 |
| Size | 618.5 MB | 81.3 MB |
| Events in quadrant A | 9,934,868 | 435,821 |
| Events in quadrant B | 5,341,108 | 612,748 |
| Events in quadrant C | 3,505,161 | 569,278 |
| Events in quadrant D | 4,731,568 | 516,831 |
| Mode M0 | |||
|---|---|---|---|
| Quadrant | BADHDUFLAG | Total packets | Discarded packets |
| A | 0 | 34004 | 3 |
| B | 0 | 20355 | 1 |
| C | 0 | 15031 | 1 |
| D | 0 | 18593 | 1 |
| Mode M9 | |||
|---|---|---|---|
| Quadrant | BADHDUFLAG | Total packets | Discarded packets |
| A | 0 | 8 | 0 |
| B | 0 | 8 | 0 |
| C | 0 | 8 | 0 |
| D | 0 | 8 | 0 |
| Mode SS | |||
|---|---|---|---|
| Quadrant | BADHDUFLAG | Total packets | Discarded packets |
| A | 0 | 130 | 0 |
| B | 0 | 130 | 0 |
| C | 0 | 130 | 0 |
| D | 0 | 130 | 0 |
| Quadrant | Total seconds | Saturated seconds | Saturation percentage |
|---|---|---|---|
| A | 6411 | 1997 | 31.149587% |
| B | 6412 | 359 | 5.598877% |
| C | 6412 | 76 | 1.185278% |
| D | 6412 | 420 | 6.550218% |
Noise dominated data is calculated using 1-second bins in cleaned event files. If a bin has >2000 counts, and if more than 50% of those come from <1% of pixels, then it is considered to be noise-dominated and hence unusable.
| Quadrant | # 1 sec bins | Bins with >0 counts | Bins with >2000 counts | High rate bins dominated by noise | Noise dominated (total time) | Noise dominated (detector-on time) | Marked lightcurve |
|---|---|---|---|---|---|---|---|
| A | 7185 | 6410 | 1902 | 1902 | 26.47% | 29.67% | 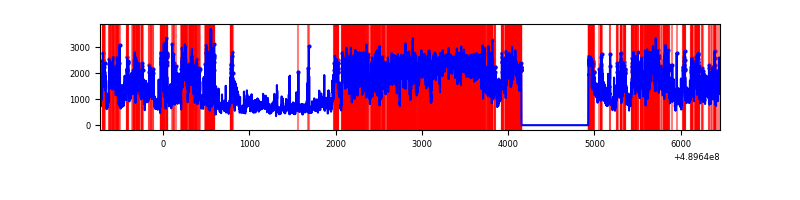 |
| B | 7187 | 6412 | 220 | 220 | 3.06% | 3.43% | 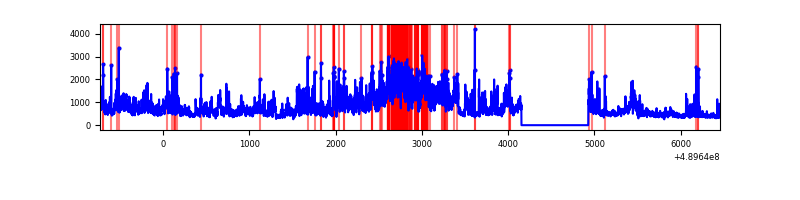 |
| C | 7187 | 6413 | 60 | 60 | 0.83% | 0.94% | 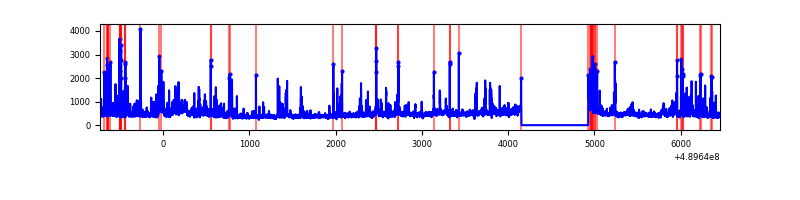 |
| D | 7187 | 6413 | 408 | 408 | 5.68% | 6.36% | 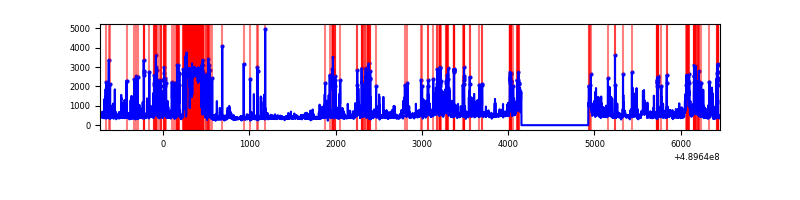 |
Top three noisy pixels from each quadrant. If the there are fewer than three noisy pixels in the level2.evt file, extra rows are filled as -1
| Pixel properties | Quadrant properties | ||||||
|---|---|---|---|---|---|---|---|
| Quadrant | DetID | PixID | Counts | Sigma | Mean | Median | Sigma |
| A | 9 | 191 | 6281374 | 41909.08 | 599 | 587 | 149.9 |
| A | 12 | 17 | 414786 | 2763.78 | 599 | 587 | 149.9 |
| A | 7 | 206 | 141902 | 942.94 | 599 | 587 | 149.9 |
| B | 8 | 3 | 2178167 | 15531.51 | 651 | 627 | 140.2 |
| B | 4 | 81 | 166089 | 1180.17 | 651 | 627 | 140.2 |
| B | 5 | 185 | 65629 | 463.63 | 651 | 627 | 140.2 |
| C | 13 | 3 | 209683 | 1165.1 | 642 | 635 | 179.4 |
| C | 7 | 80 | 208176 | 1156.71 | 642 | 635 | 179.4 |
| C | 4 | 5 | 82757 | 457.7 | 642 | 635 | 179.4 |
| D | 12 | 17 | 671124 | 3689.1 | 626 | 595 | 181.8 |
| D | 3 | 224 | 464588 | 2552.78 | 626 | 595 | 181.8 |
| D | 8 | 176 | 271497 | 1490.44 | 626 | 595 | 181.8 |
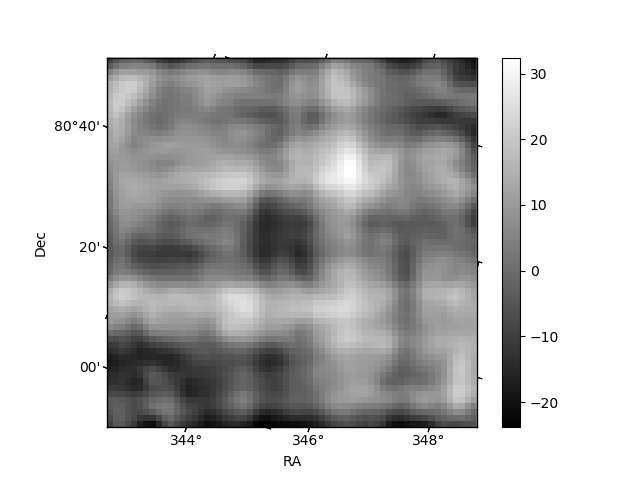
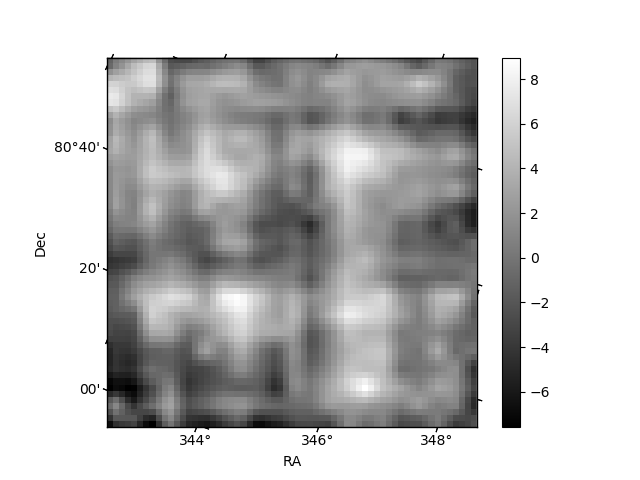
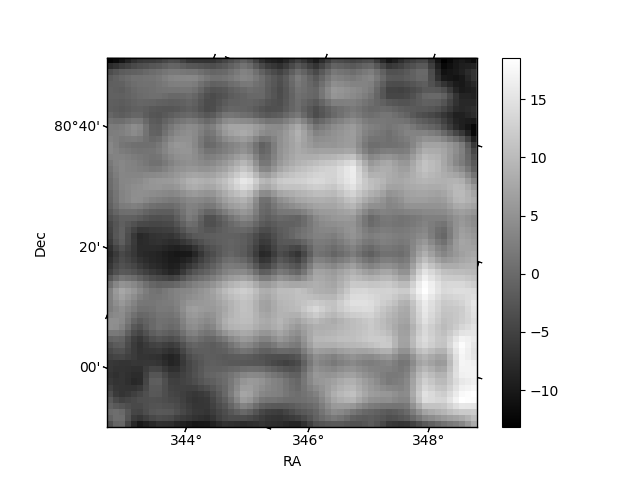
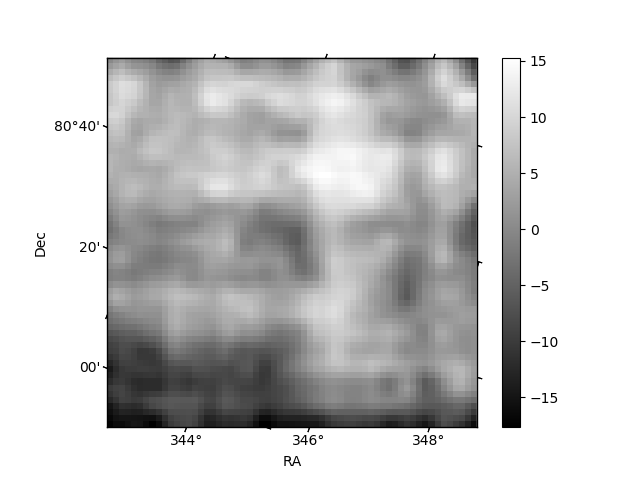
Histogram calculated using DETX and DETY for each event in the final _common_clean file
| Quadrant A | 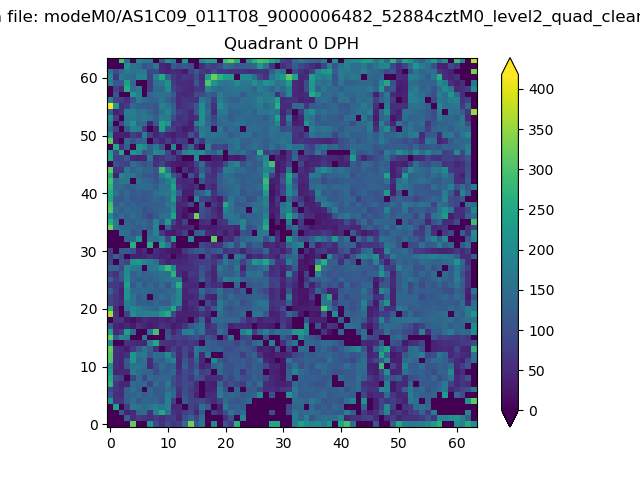 |
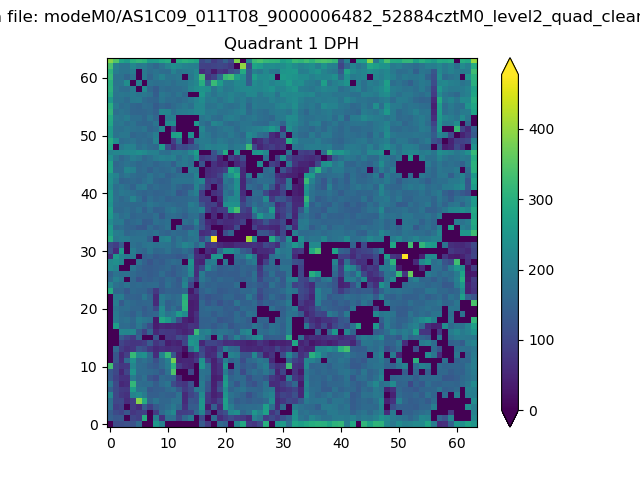 |
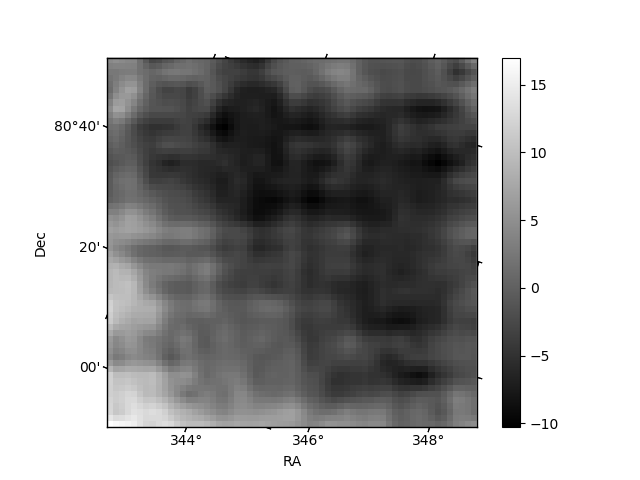
Quadrant B |
|---|---|---|---|
| Quadrant D | 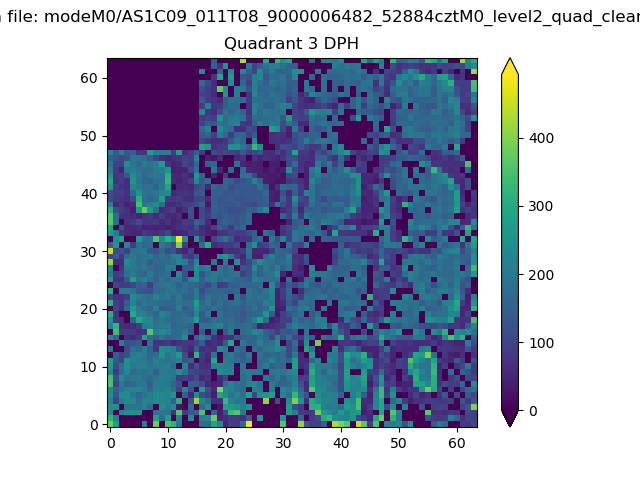 |
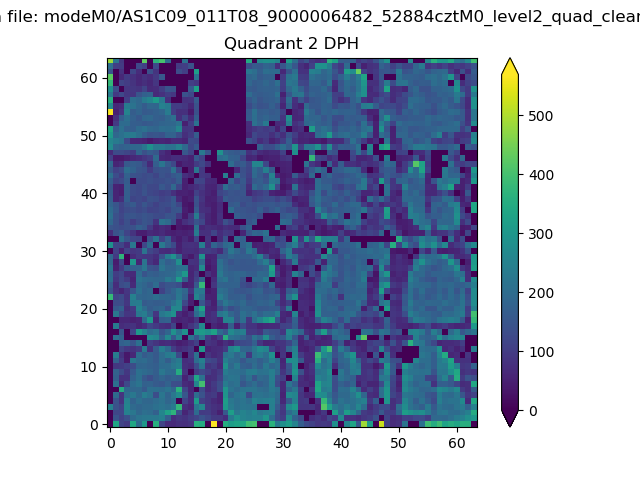 |
Quadrant C |
| Plot type | Count rate plots | Images |
|---|---|---|
| Comparison with Poisson distribution Blue bars denote a histogram of data divided into 1 sec bins. Red curve is a Poisson curve with rate = median count rate of data. |
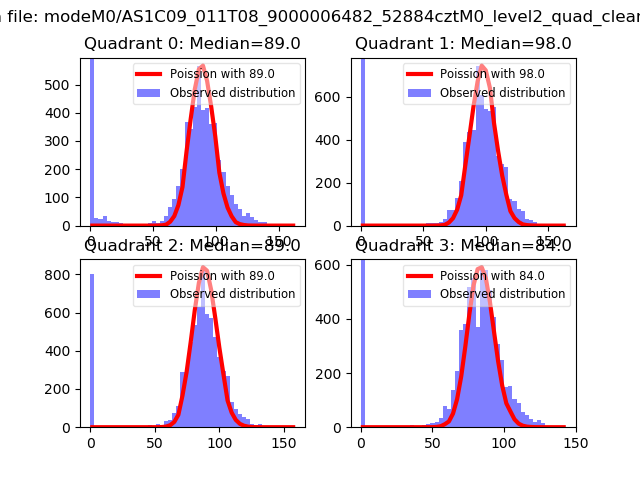 |
 |
| Quadrant-wise count rates Data is divided into 100 sec bins |
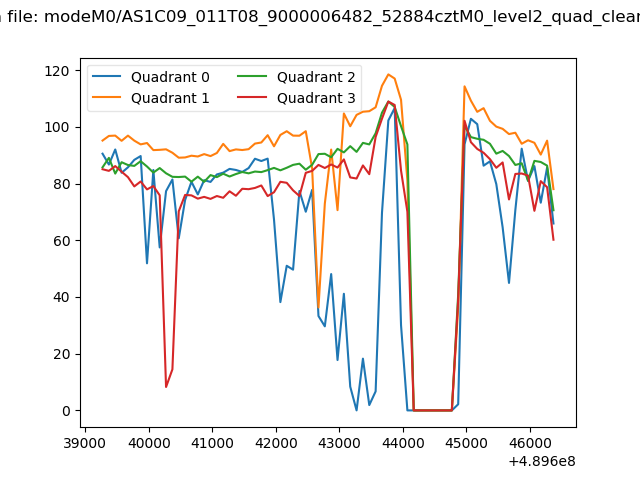 |
|
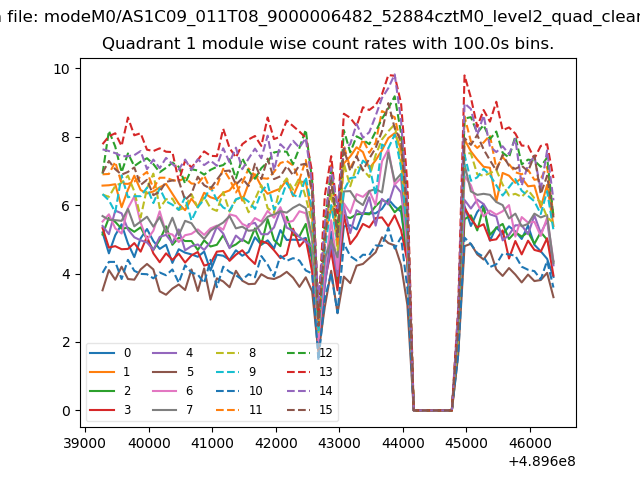
| Module-wise count rates for Quadrant A Data is divided into 100 sec bins |
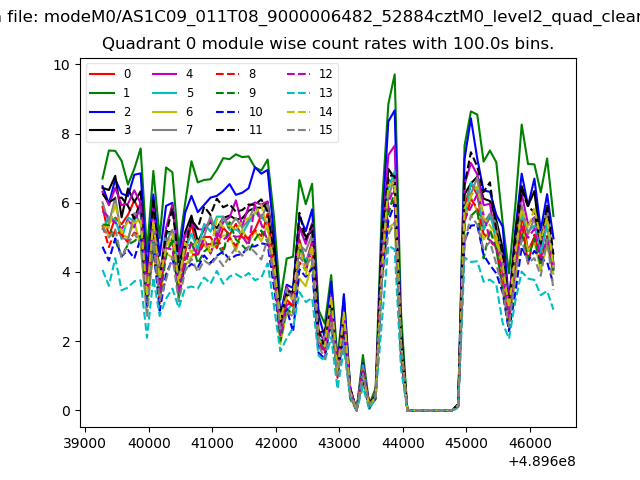 |
 |
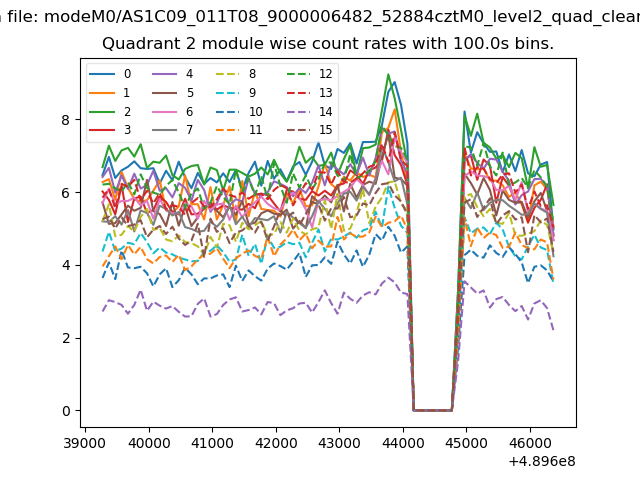
| Module-wise count rates for Quadrant B Data is divided into 100 sec bins |
 |
 |
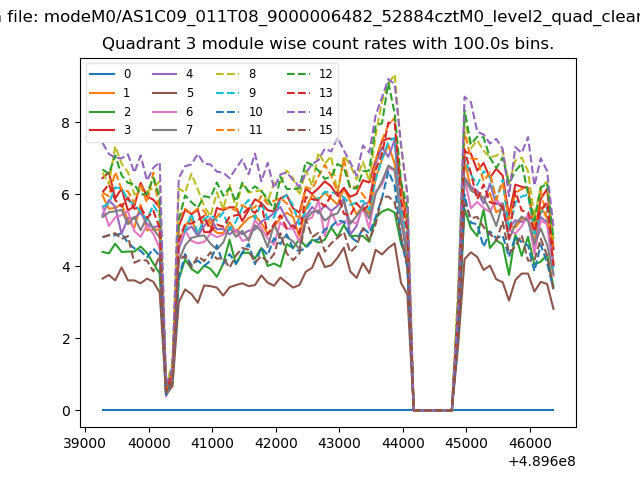
| Module-wise count rates for Quadrant C Data is divided into 100 sec bins |
 |
 |
| Module-wise count rates for Quadrant D Data is divided into 100 sec bins |
 |
 |
| Parameter | Plot |
|---|---|
| CZT HV Monitor | 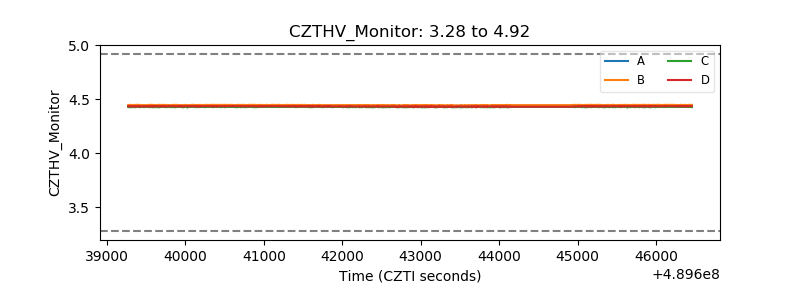 |
| D_VDD | 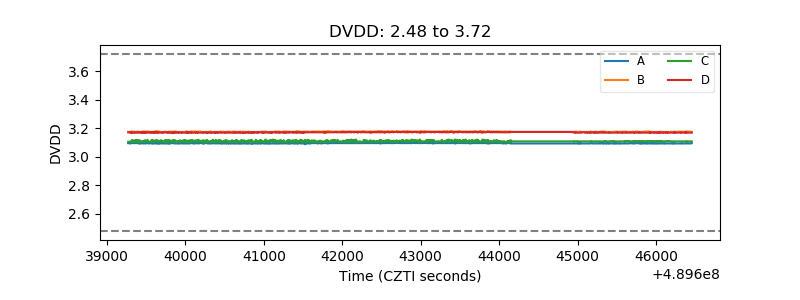 |
| Temperature 1 | 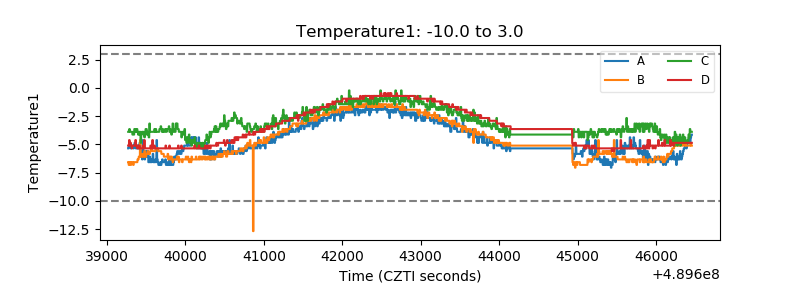 |
| Veto HV Monitor | 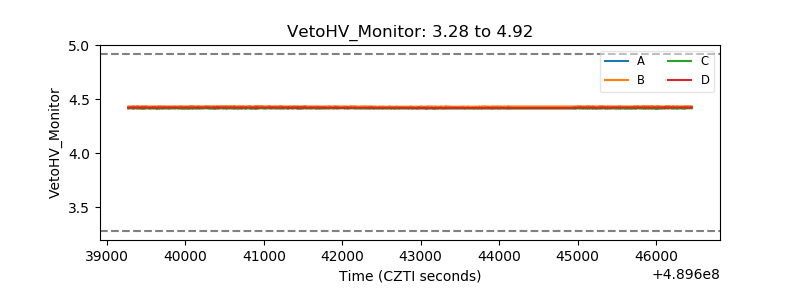 |
| Veto LLD | 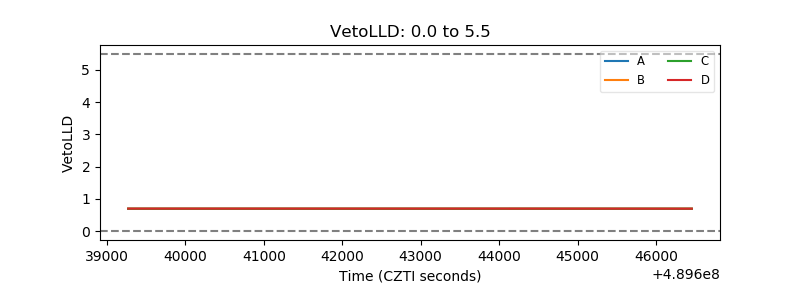 |
| Alpha Counter | 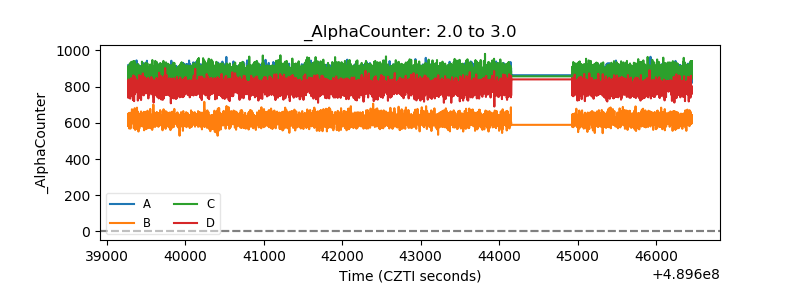 |
| _CPM_Rate |  |
| CZT Counter | 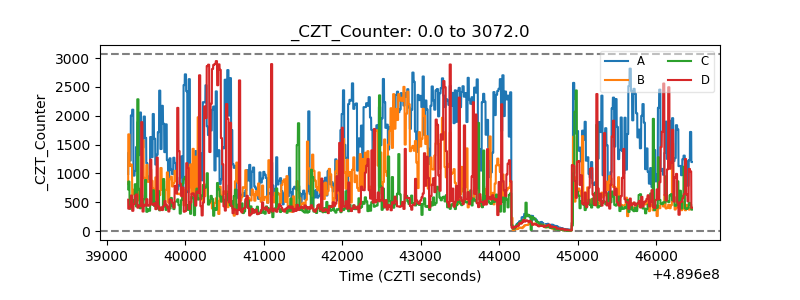 |
| +2.5 Volts monitor |  |
| +5 Volts monitor |  |
| _ROLL_ROT | 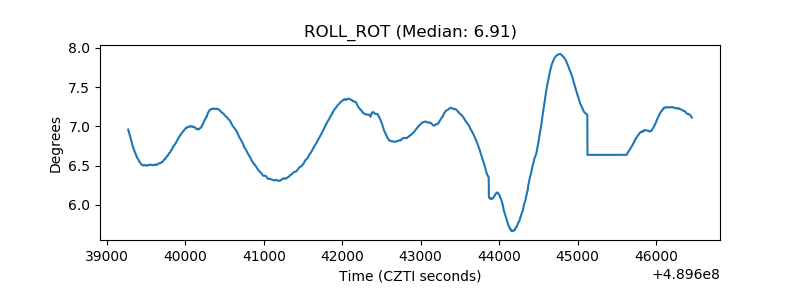 |
| _Roll_DEC | 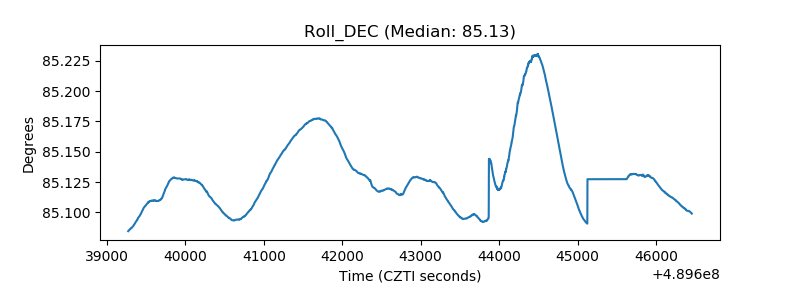 |
| _Roll_RA | 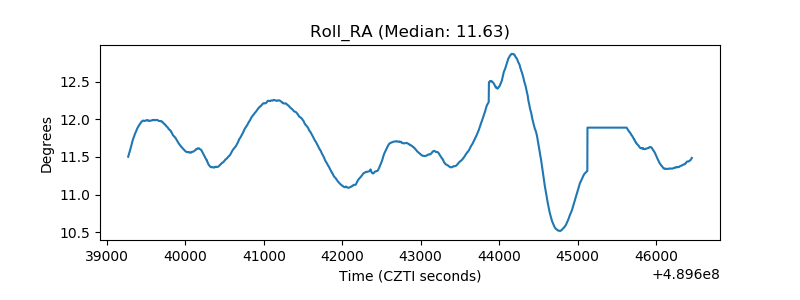 |
| Veto Counter | 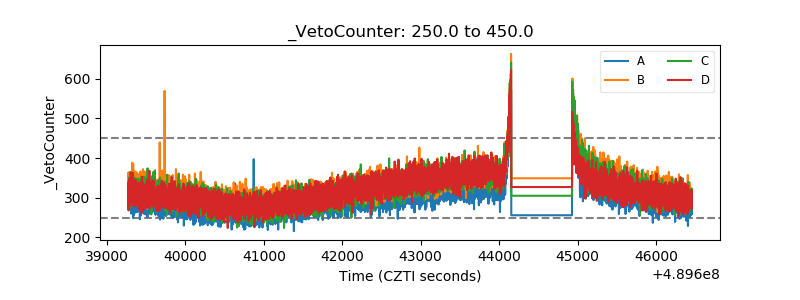 |