| Param | Original file | Final file |
|---|---|---|
| Filename | modeM0/AS1C09_011T08_9000006482_52885cztM0_level2.fits | modeM0/AS1C09_011T08_9000006482_52885cztM0_level2_quad_clean.evt |
| Size (bytes) | 613,045,440 | 81,434,880 |
| Size | 584.6 MB | 77.7 MB |
| Events in quadrant A | 9,980,392 | 389,147 |
| Events in quadrant B | 3,348,228 | 604,381 |
| Events in quadrant C | 4,241,025 | 528,224 |
| Events in quadrant D | 4,648,918 | 516,509 |
| Mode M0 | |||
|---|---|---|---|
| Quadrant | BADHDUFLAG | Total packets | Discarded packets |
| A | 0 | 33923 | 1 |
| B | 0 | 14269 | 1 |
| C | 0 | 17020 | 1 |
| D | 0 | 18091 | 1 |
| Mode M9 | |||
|---|---|---|---|
| Quadrant | BADHDUFLAG | Total packets | Discarded packets |
| A | 0 | 9 | 0 |
| B | 0 | 9 | 0 |
| C | 0 | 9 | 0 |
| D | 0 | 9 | 0 |
| Mode SS | |||
|---|---|---|---|
| Quadrant | BADHDUFLAG | Total packets | Discarded packets |
| A | 0 | 124 | 0 |
| B | 0 | 124 | 0 |
| C | 0 | 124 | 0 |
| D | 0 | 124 | 0 |
| Quadrant | Total seconds | Saturated seconds | Saturation percentage |
|---|---|---|---|
| A | 6120 | 2226 | 36.372549% |
| B | 6119 | 152 | 2.484066% |
| C | 6120 | 320 | 5.228758% |
| D | 6120 | 194 | 3.169935% |
Noise dominated data is calculated using 1-second bins in cleaned event files. If a bin has >2000 counts, and if more than 50% of those come from <1% of pixels, then it is considered to be noise-dominated and hence unusable.
| Quadrant | # 1 sec bins | Bins with >0 counts | Bins with >2000 counts | High rate bins dominated by noise | Noise dominated (total time) | Noise dominated (detector-on time) | Marked lightcurve |
|---|---|---|---|---|---|---|---|
| A | 7045 | 6120 | 2095 | 2095 | 29.74% | 34.23% | 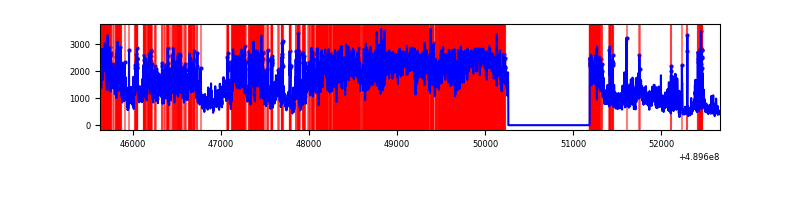 |
| B | 7044 | 6119 | 86 | 86 | 1.22% | 1.41% | 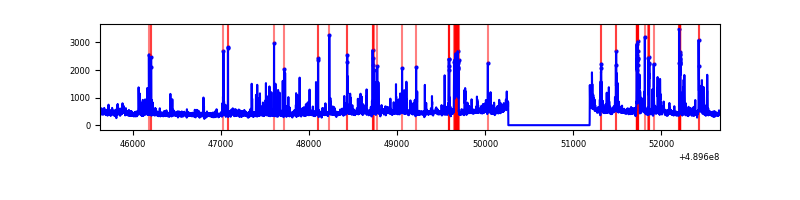 |
| C | 7044 | 6120 | 271 | 271 | 3.85% | 4.43% | 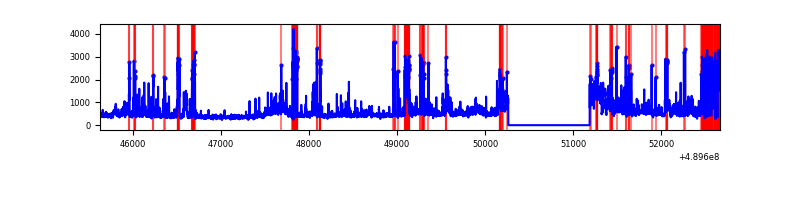 |
| D | 7045 | 6121 | 201 | 201 | 2.85% | 3.28% | 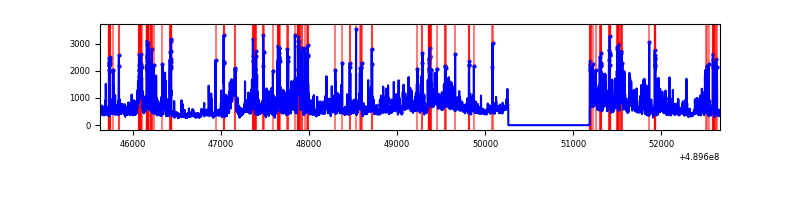 |
Top three noisy pixels from each quadrant. If the there are fewer than three noisy pixels in the level2.evt file, extra rows are filled as -1
| Pixel properties | Quadrant properties | ||||||
|---|---|---|---|---|---|---|---|
| Quadrant | DetID | PixID | Counts | Sigma | Mean | Median | Sigma |
| A | 9 | 191 | 6473547 | 46294.98 | 560 | 547 | 139.8 |
| A | 12 | 17 | 364432 | 2602.51 | 560 | 547 | 139.8 |
| A | 0 | 8 | 272901 | 1947.88 | 560 | 547 | 139.8 |
| B | 1 | 255 | 283390 | 2103.66 | 627 | 605 | 134.4 |
| B | 8 | 3 | 137244 | 1016.47 | 627 | 605 | 134.4 |
| B | 4 | 81 | 124407 | 920.97 | 627 | 605 | 134.4 |
| C | 7 | 80 | 1191135 | 7183.04 | 602 | 597 | 165.7 |
| C | 13 | 3 | 212443 | 1278.16 | 602 | 597 | 165.7 |
| C | 2 | 12 | 80656 | 483.03 | 602 | 597 | 165.7 |
| D | 3 | 224 | 489145 | 2798.3 | 608 | 580 | 174.6 |
| D | 2 | 37 | 430936 | 2464.91 | 608 | 580 | 174.6 |
| D | 8 | 176 | 420853 | 2407.15 | 608 | 580 | 174.6 |
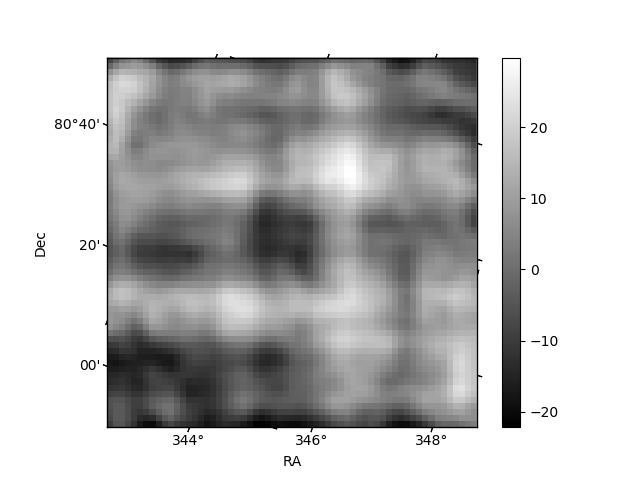
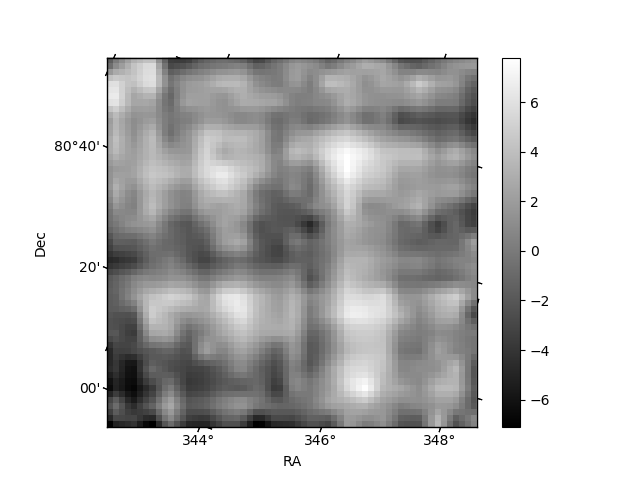
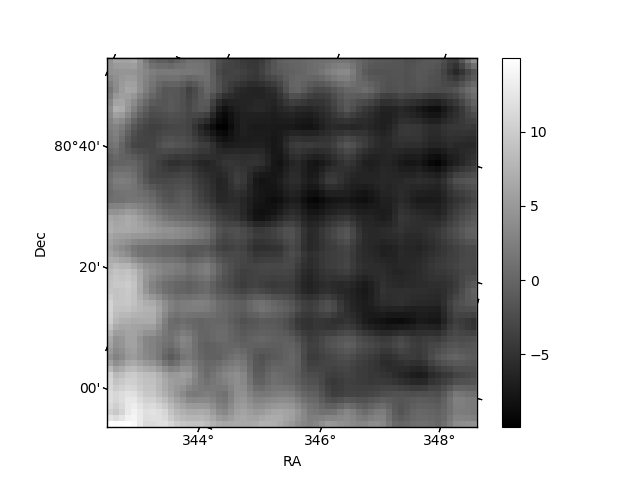
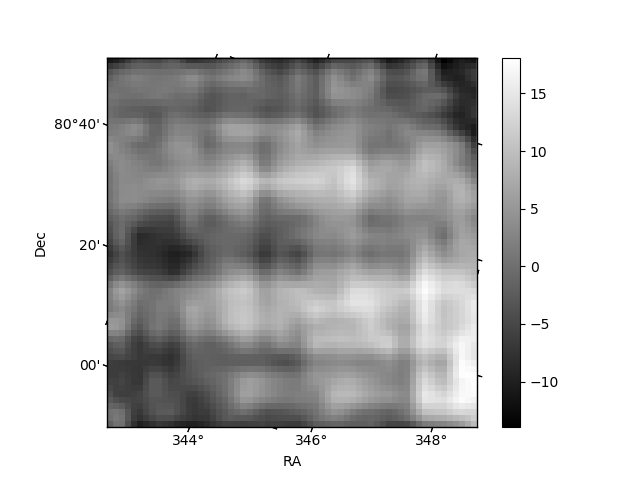
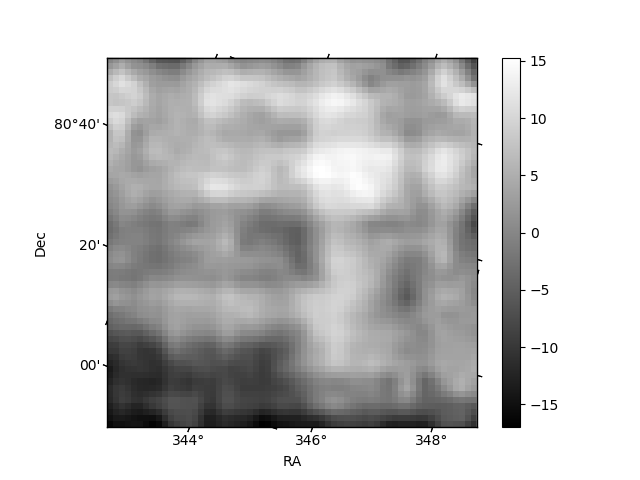
Histogram calculated using DETX and DETY for each event in the final _common_clean file
| Quadrant A | 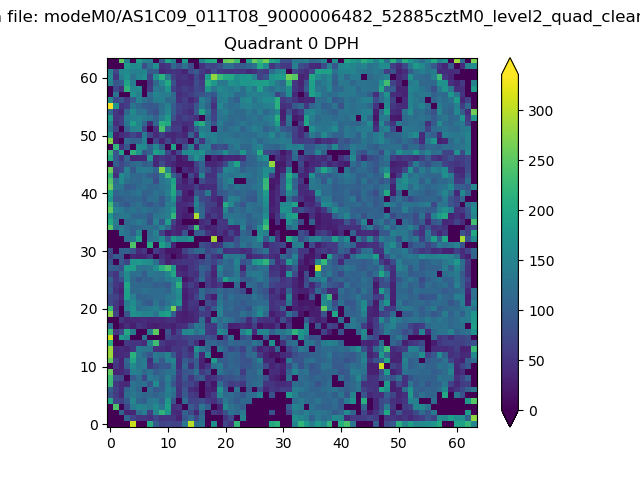 |
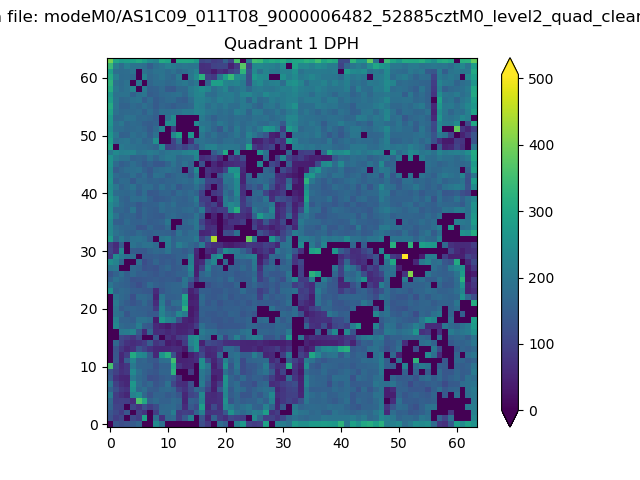 |
Quadrant B |
|---|---|---|---|
| Quadrant D | 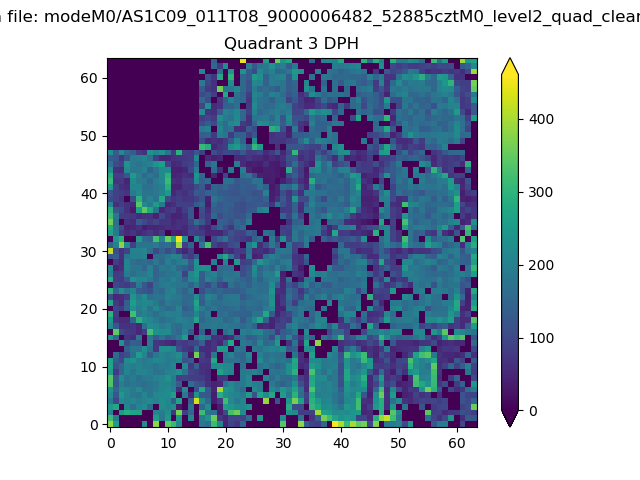 |
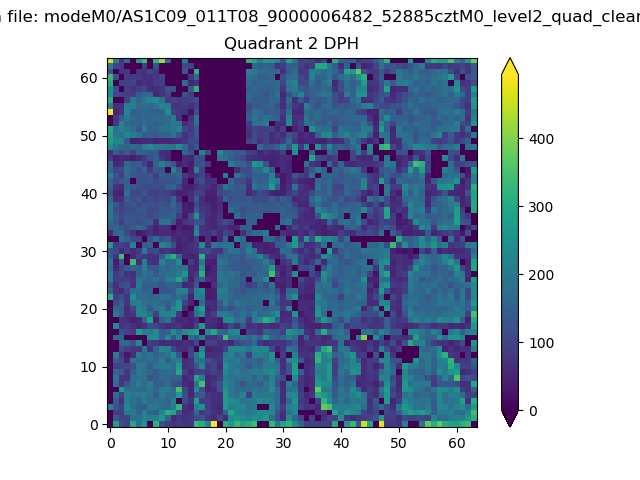 |
Quadrant C |
| Plot type | Count rate plots | Images |
|---|---|---|
| Comparison with Poisson distribution Blue bars denote a histogram of data divided into 1 sec bins. Red curve is a Poisson curve with rate = median count rate of data. |
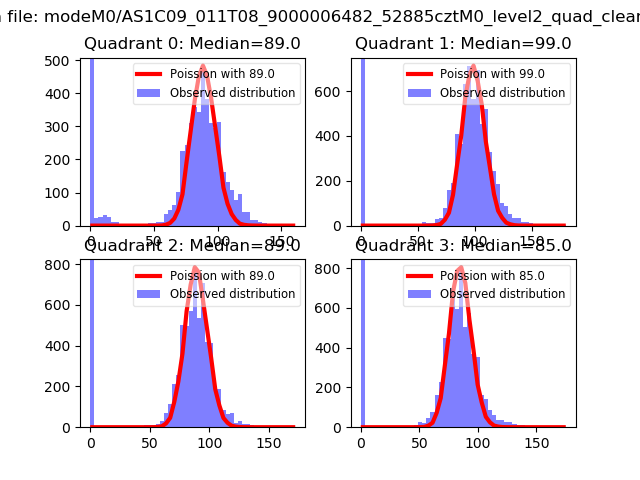 |
 |
| Quadrant-wise count rates Data is divided into 100 sec bins |
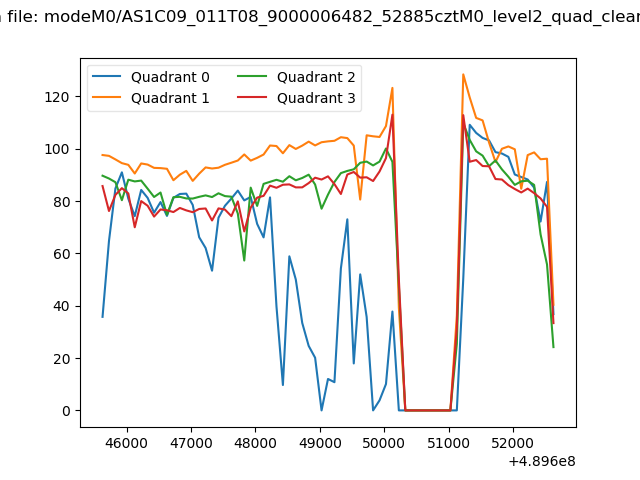 |
|
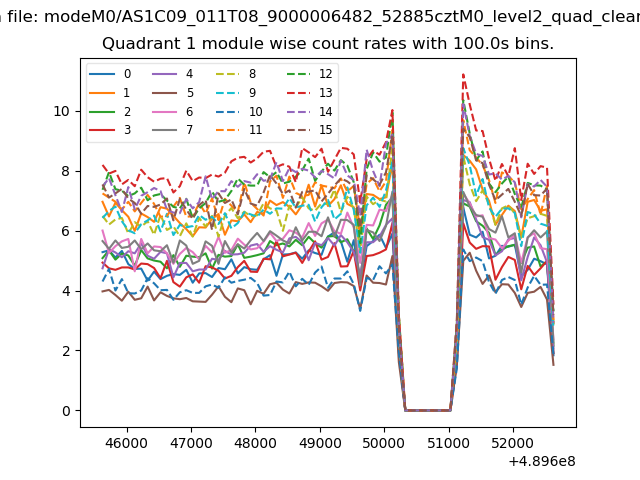
| Module-wise count rates for Quadrant A Data is divided into 100 sec bins |
 |
 |
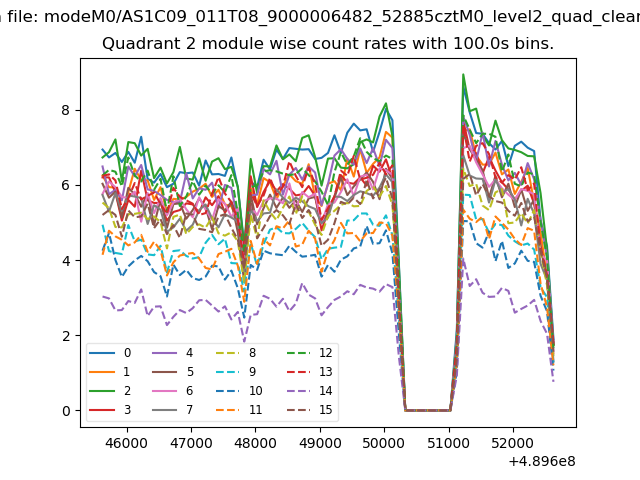
| Module-wise count rates for Quadrant B Data is divided into 100 sec bins |
 |
 |
| Module-wise count rates for Quadrant C Data is divided into 100 sec bins |
 |
 |
| Module-wise count rates for Quadrant D Data is divided into 100 sec bins |
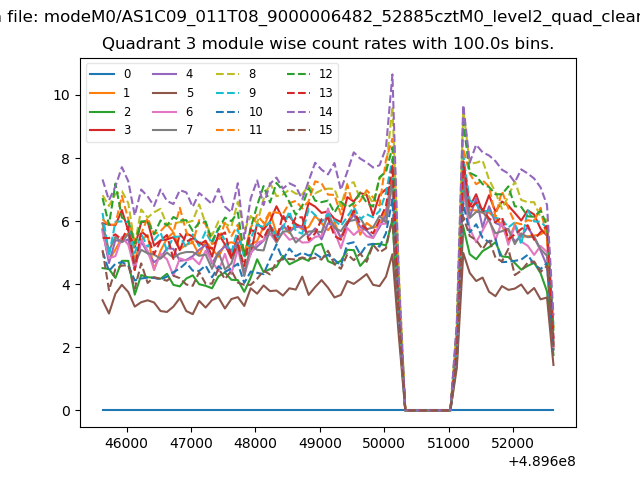 |
 |
| Parameter | Plot |
|---|---|
| CZT HV Monitor | 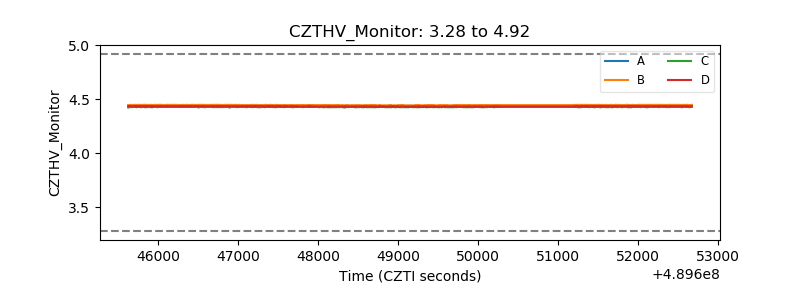 |
| D_VDD | 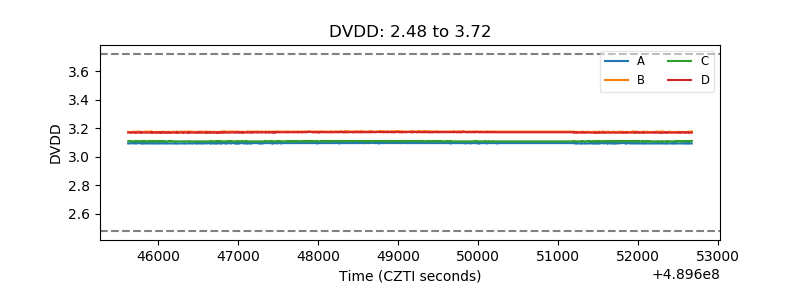 |
| Temperature 1 | 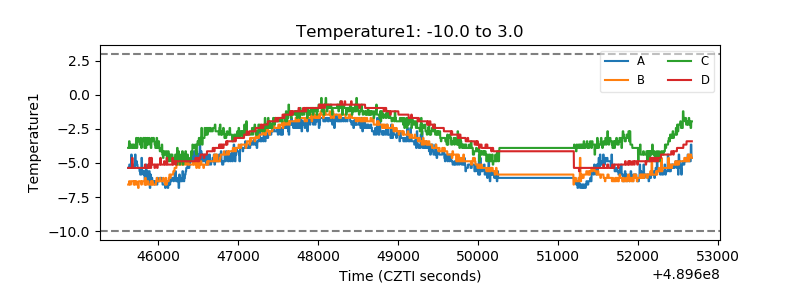 |
| Veto HV Monitor | 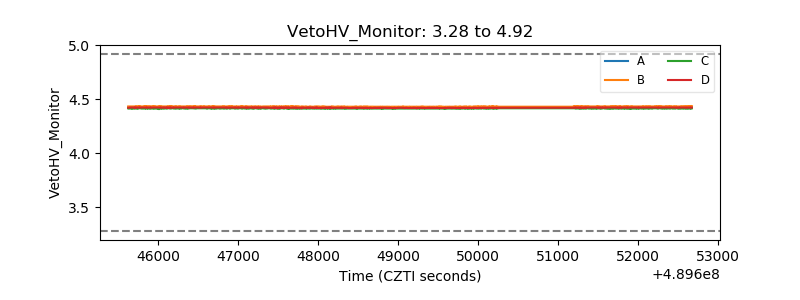 |
| Veto LLD | 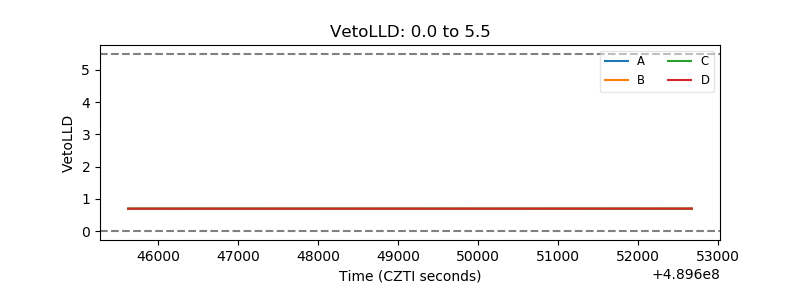 |
| Alpha Counter | 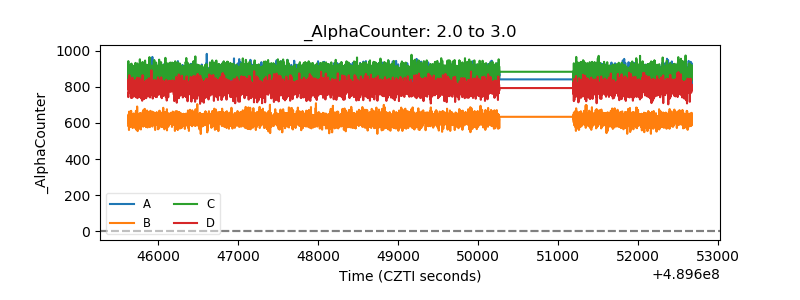 |
| _CPM_Rate | 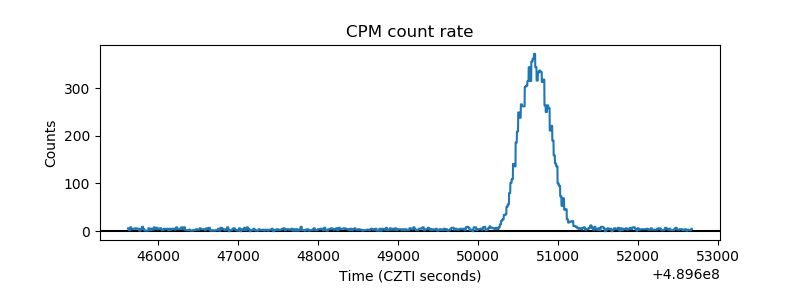 |
| CZT Counter | 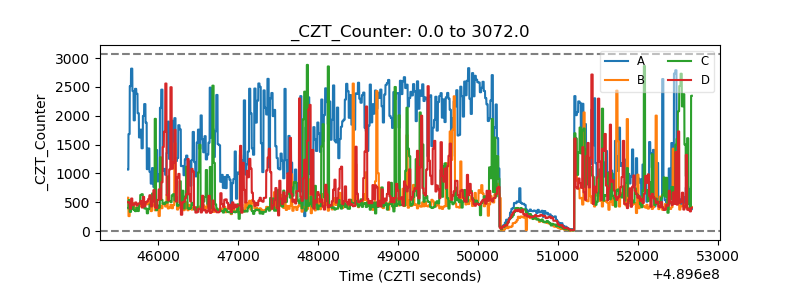 |
| +2.5 Volts monitor |  |
| +5 Volts monitor | 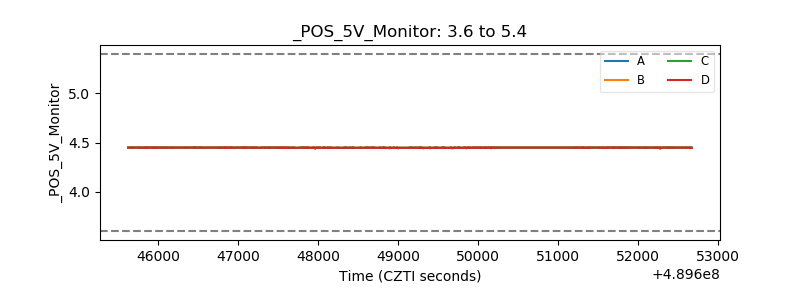 |
| _ROLL_ROT | 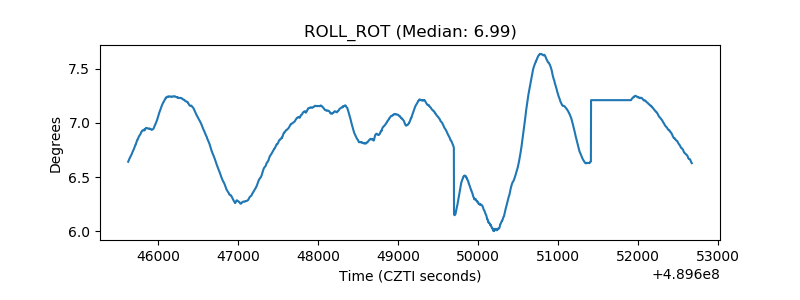 |
| _Roll_DEC | 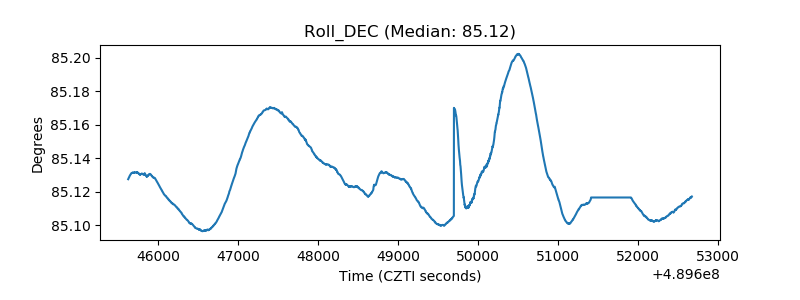 |
| _Roll_RA | 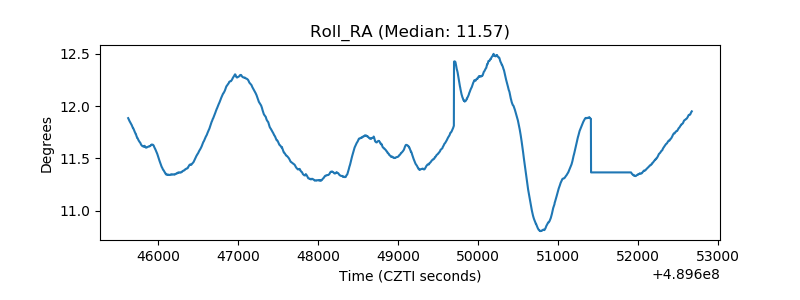 |
| Veto Counter | 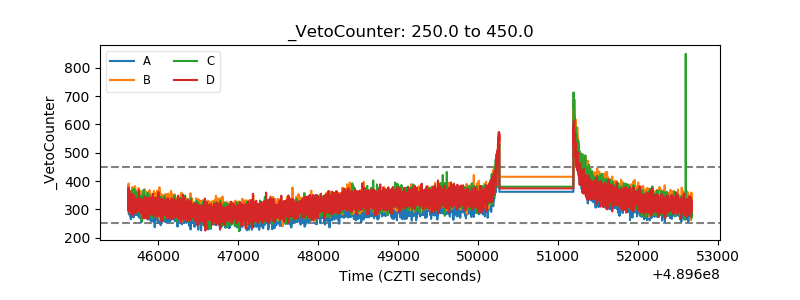 |