| Param | Original file | Final file |
|---|---|---|
| Filename | modeM0/AS1C09_011T08_9000006482_52888cztM0_level2.fits | modeM0/AS1C09_011T08_9000006482_52888cztM0_level2_quad_clean.evt |
| Size (bytes) | 563,734,080 | 84,225,600 |
| Size | 537.6 MB | 80.3 MB |
| Events in quadrant A | 7,866,654 | 501,117 |
| Events in quadrant B | 3,927,826 | 606,981 |
| Events in quadrant C | 3,933,744 | 535,499 |
| Events in quadrant D | 4,687,997 | 499,154 |
| Mode M0 | |||
|---|---|---|---|
| Quadrant | BADHDUFLAG | Total packets | Discarded packets |
| A | 0 | 27473 | 1 |
| B | 0 | 15528 | 1 |
| C | 0 | 15751 | 1 |
| D | 0 | 17906 | 1 |
| Mode M9 | |||
|---|---|---|---|
| Quadrant | BADHDUFLAG | Total packets | Discarded packets |
| A | 0 | 11 | 0 |
| B | 0 | 11 | 0 |
| C | 0 | 11 | 0 |
| D | 0 | 11 | 0 |
| Mode SS | |||
|---|---|---|---|
| Quadrant | BADHDUFLAG | Total packets | Discarded packets |
| A | 0 | 118 | 0 |
| B | 0 | 118 | 0 |
| C | 0 | 118 | 0 |
| D | 0 | 118 | 0 |
| Quadrant | Total seconds | Saturated seconds | Saturation percentage |
|---|---|---|---|
| A | 5832 | 960 | 16.460905% |
| B | 5832 | 222 | 3.806584% |
| C | 5833 | 291 | 4.988857% |
| D | 5833 | 412 | 7.063261% |
Noise dominated data is calculated using 1-second bins in cleaned event files. If a bin has >2000 counts, and if more than 50% of those come from <1% of pixels, then it is considered to be noise-dominated and hence unusable.
| Quadrant | # 1 sec bins | Bins with >0 counts | Bins with >2000 counts | High rate bins dominated by noise | Noise dominated (total time) | Noise dominated (detector-on time) | Marked lightcurve |
|---|---|---|---|---|---|---|---|
| A | 6937 | 5832 | 868 | 868 | 12.51% | 14.88% | 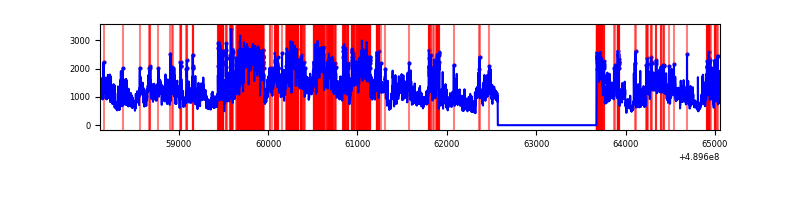 |
| B | 6937 | 5832 | 106 | 106 | 1.53% | 1.82% | 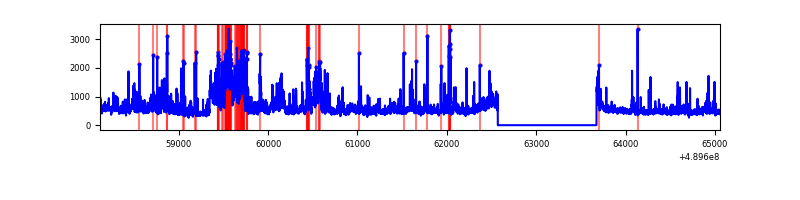 |
| C | 6938 | 5833 | 238 | 238 | 3.43% | 4.08% | 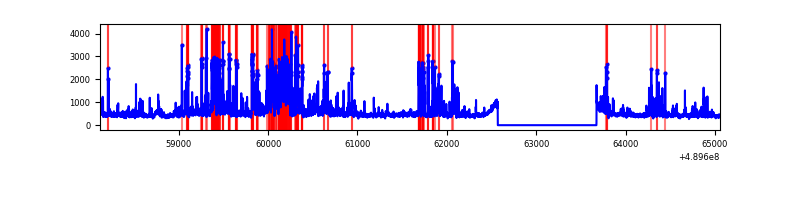 |
| D | 6938 | 5833 | 380 | 380 | 5.48% | 6.51% | 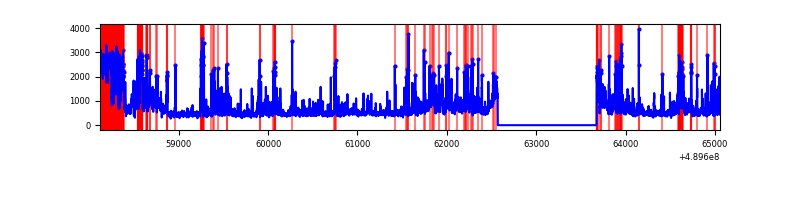 |
Top three noisy pixels from each quadrant. If the there are fewer than three noisy pixels in the level2.evt file, extra rows are filled as -1
| Pixel properties | Quadrant properties | ||||||
|---|---|---|---|---|---|---|---|
| Quadrant | DetID | PixID | Counts | Sigma | Mean | Median | Sigma |
| A | 9 | 191 | 4327703 | 28475.65 | 598 | 585 | 152.0 |
| A | 12 | 17 | 379457 | 2493.26 | 598 | 585 | 152.0 |
| A | 12 | 80 | 242577 | 1592.49 | 598 | 585 | 152.0 |
| B | 8 | 3 | 823998 | 6334.13 | 614 | 595 | 130.0 |
| B | 7 | 0 | 124197 | 950.82 | 614 | 595 | 130.0 |
| B | 4 | 81 | 78550 | 599.68 | 614 | 595 | 130.0 |
| C | 7 | 80 | 872580 | 5342.9 | 593 | 587 | 163.2 |
| C | 2 | 12 | 144665 | 882.8 | 593 | 587 | 163.2 |
| C | 1 | 45 | 121040 | 738.04 | 593 | 587 | 163.2 |
| D | 11 | 176 | 615271 | 3593.16 | 595 | 568 | 171.1 |
| D | 10 | 172 | 523319 | 3055.67 | 595 | 568 | 171.1 |
| D | 8 | 176 | 445996 | 2603.69 | 595 | 568 | 171.1 |
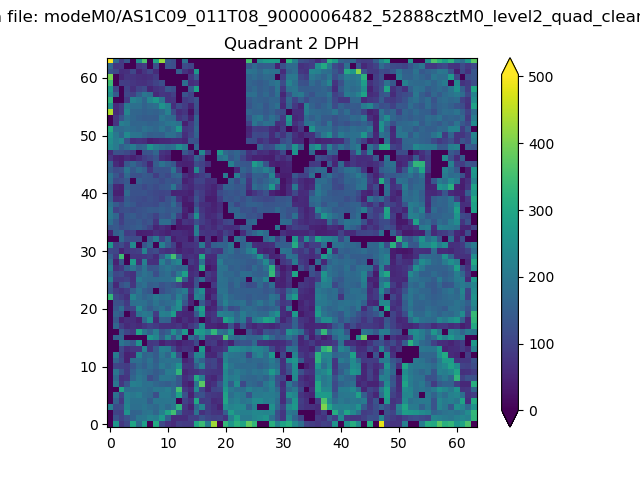
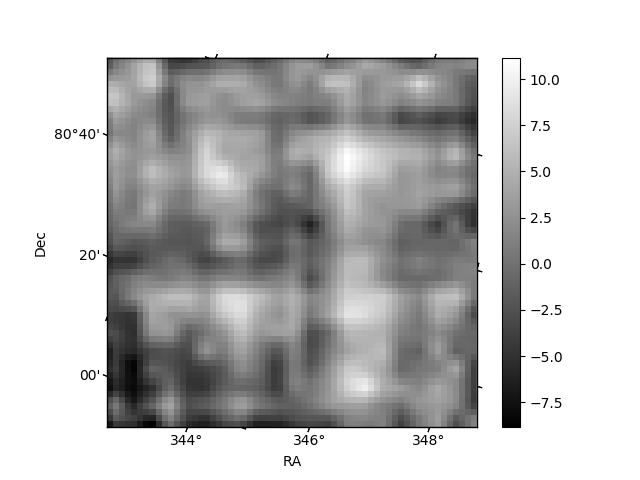
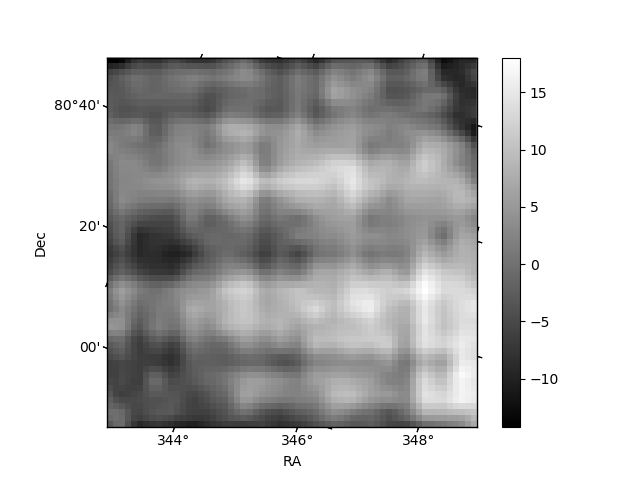
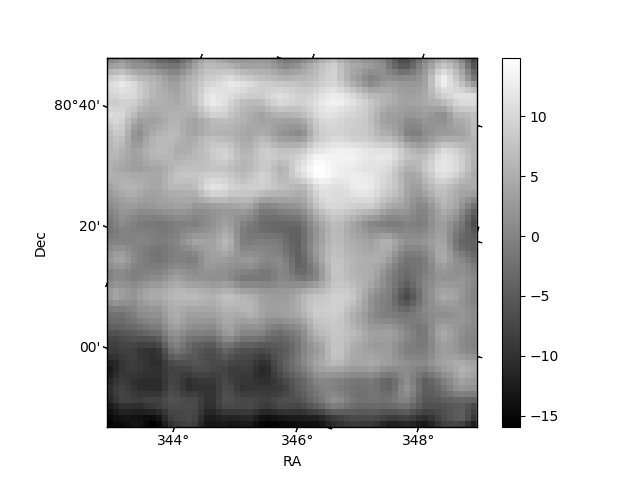
Histogram calculated using DETX and DETY for each event in the final _common_clean file
| Quadrant A | 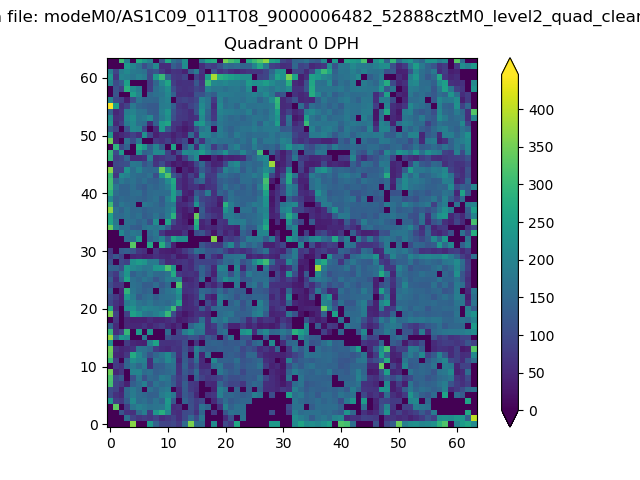 |
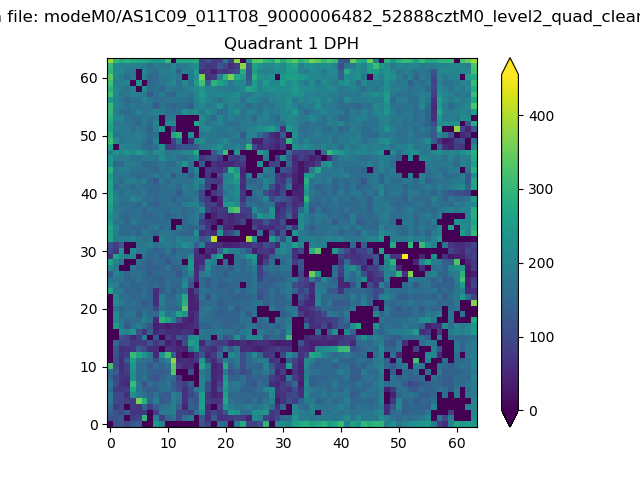 |
Quadrant B |
|---|---|---|---|
| Quadrant D | 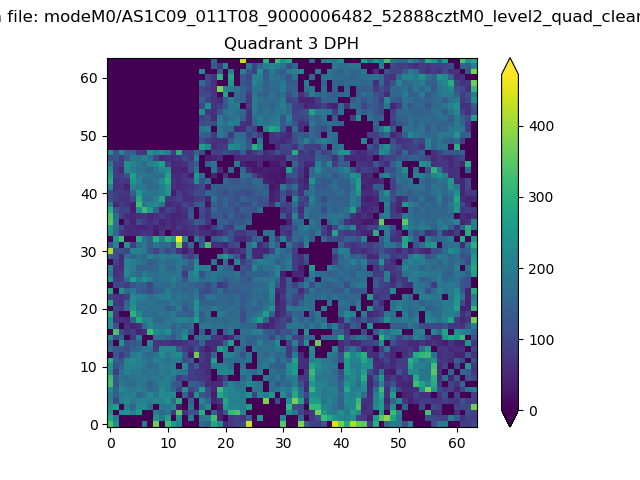 |
 |
Quadrant C |
| Plot type | Count rate plots | Images |
|---|---|---|
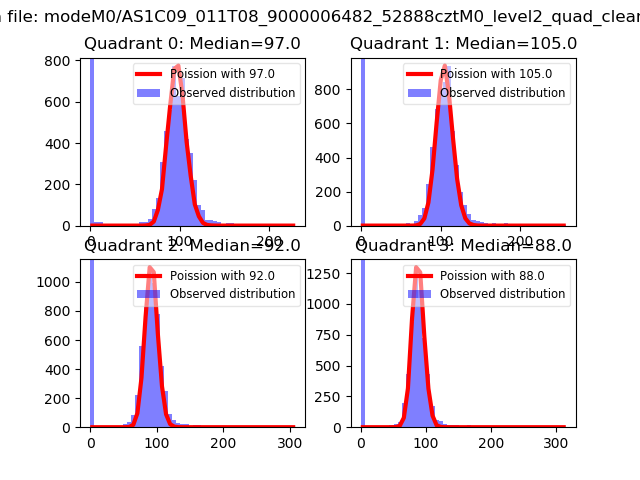
| Comparison with Poisson distribution Blue bars denote a histogram of data divided into 1 sec bins. Red curve is a Poisson curve with rate = median count rate of data. |
 |
 |
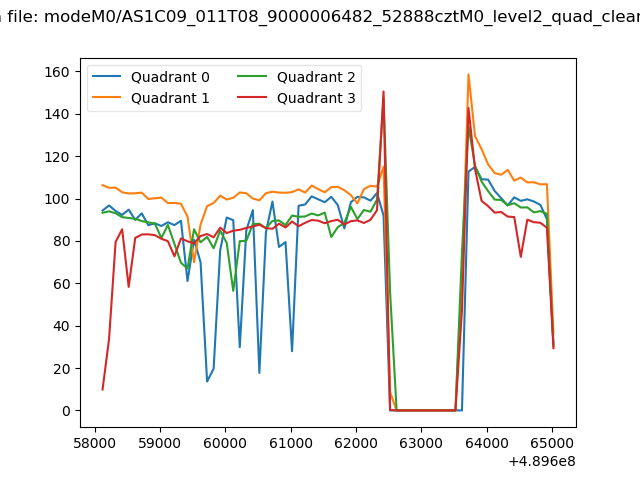
| Quadrant-wise count rates Data is divided into 100 sec bins |
 |
|
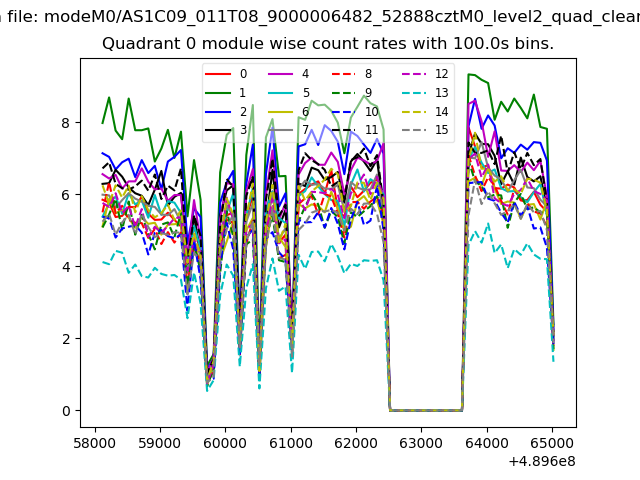
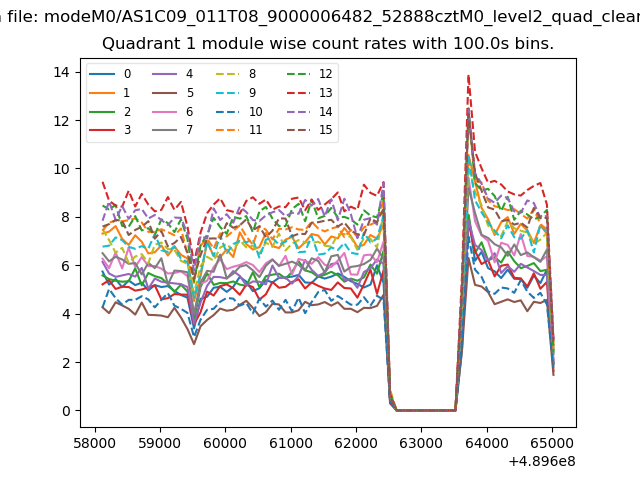
| Module-wise count rates for Quadrant A Data is divided into 100 sec bins |
 |
 |
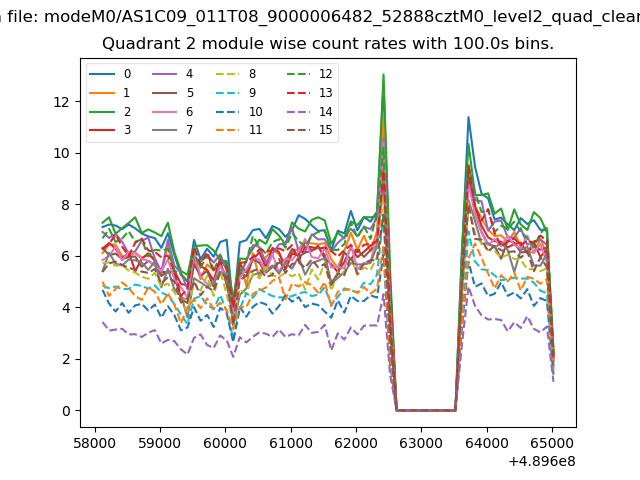
| Module-wise count rates for Quadrant B Data is divided into 100 sec bins |
 |
 |
| Module-wise count rates for Quadrant C Data is divided into 100 sec bins |
 |
 |
| Module-wise count rates for Quadrant D Data is divided into 100 sec bins |
 |
 |
| Parameter | Plot |
|---|---|
| CZT HV Monitor | 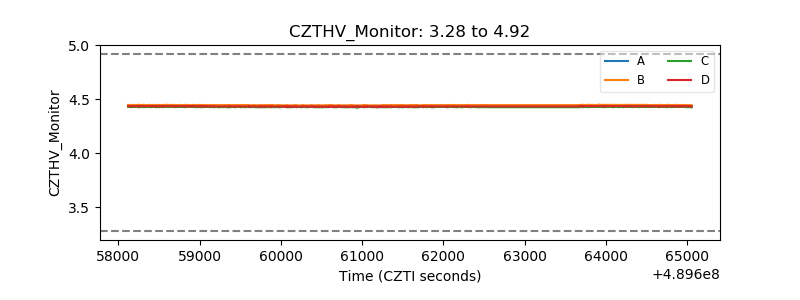 |
| D_VDD | 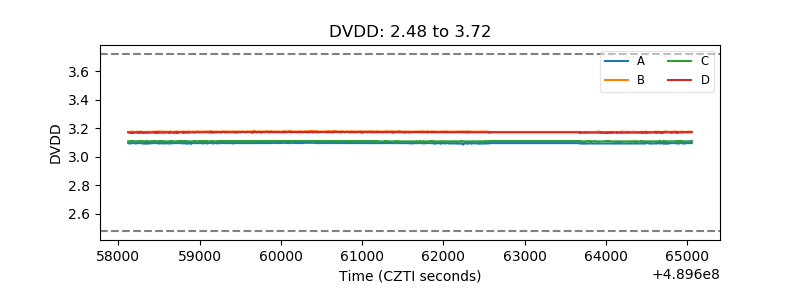 |
| Temperature 1 | 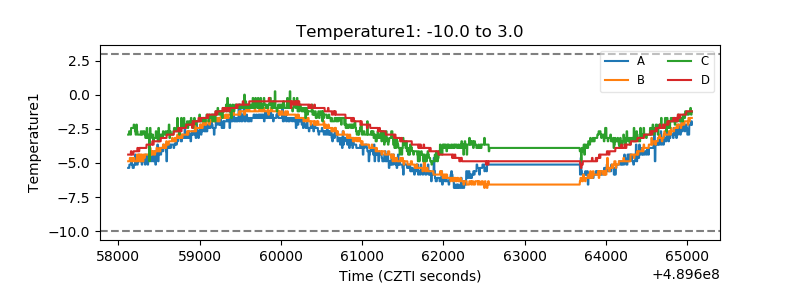 |
| Veto HV Monitor |  |
| Veto LLD | 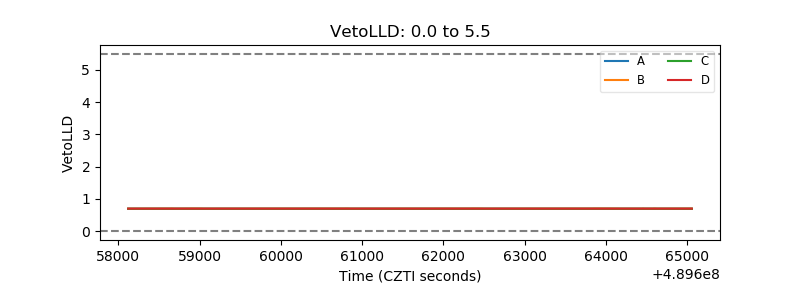 |
| Alpha Counter | 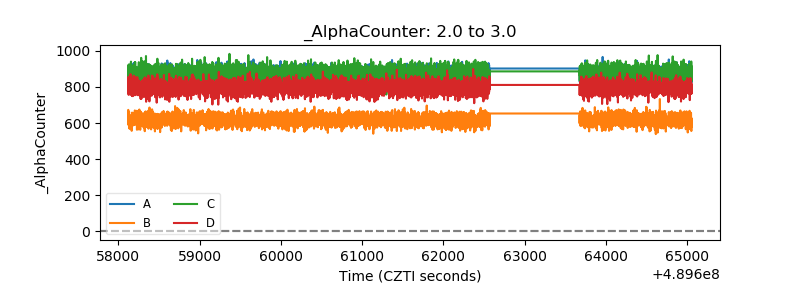 |
| _CPM_Rate | 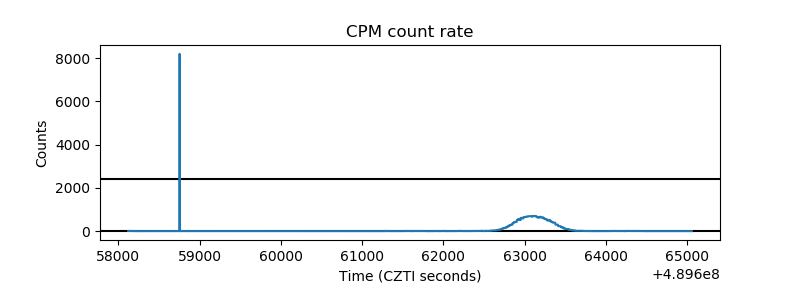 |
| CZT Counter | 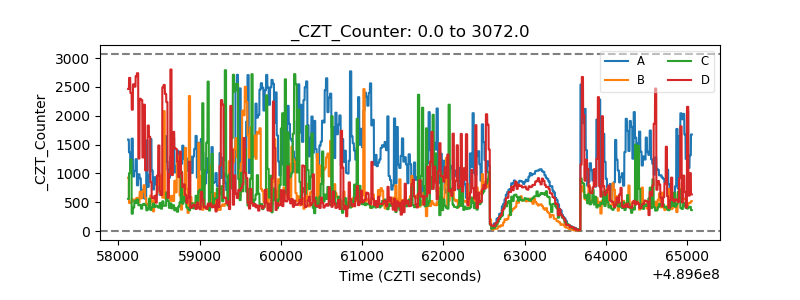 |
| +2.5 Volts monitor | 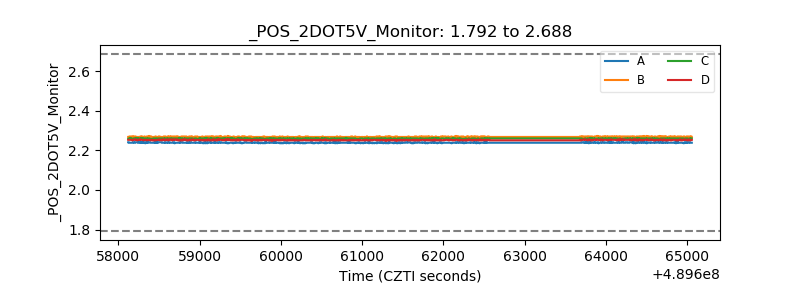 |
| +5 Volts monitor |  |
| _ROLL_ROT | 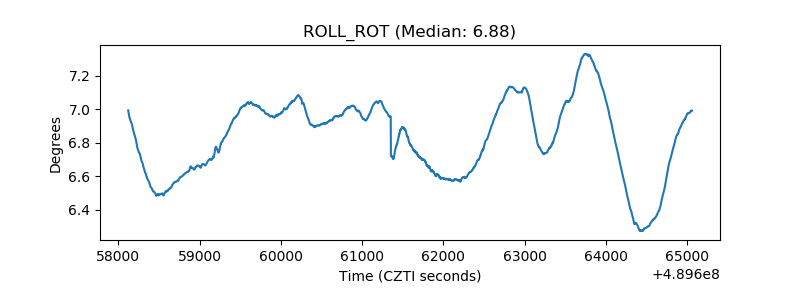 |
| _Roll_DEC | 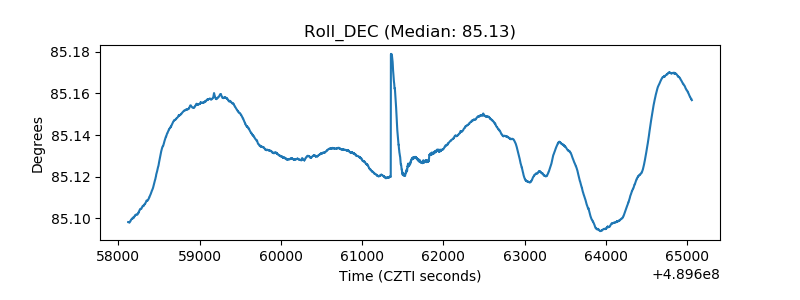 |
| _Roll_RA | 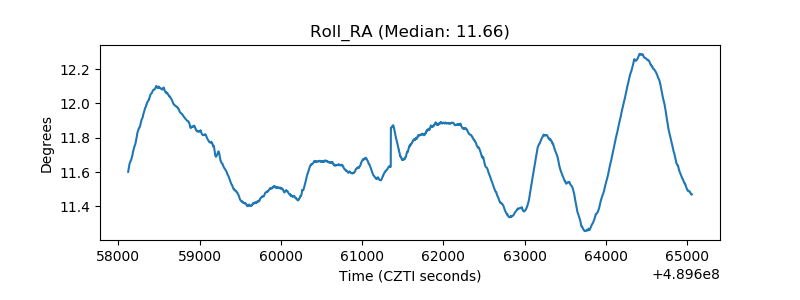 |
| Veto Counter | 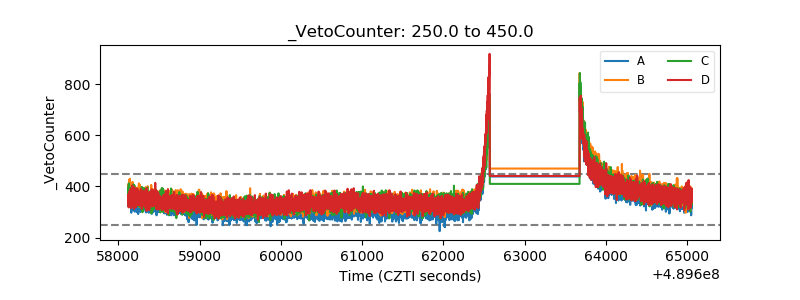 |