| Param | Original file | Final file |
|---|---|---|
| Filename | modeM0/AS1C09_011T08_9000006482_52889cztM0_level2.fits | modeM0/AS1C09_011T08_9000006482_52889cztM0_level2_quad_clean.evt |
| Size (bytes) | 750,778,560 | 84,453,120 |
| Size | 716.0 MB | 80.5 MB |
| Events in quadrant A | 11,380,119 | 387,895 |
| Events in quadrant B | 7,107,002 | 568,646 |
| Events in quadrant C | 4,044,595 | 592,250 |
| Events in quadrant D | 4,768,471 | 565,186 |
| Mode M0 | |||
|---|---|---|---|
| Quadrant | BADHDUFLAG | Total packets | Discarded packets |
| A | 0 | 38195 | 1 |
| B | 0 | 25419 | 1 |
| C | 0 | 16482 | 1 |
| D | 0 | 18456 | 1 |
| Mode M9 | |||
|---|---|---|---|
| Quadrant | BADHDUFLAG | Total packets | Discarded packets |
| A | 0 | 12 | 0 |
| B | 0 | 12 | 0 |
| C | 0 | 12 | 0 |
| D | 0 | 12 | 0 |
| Mode SS | |||
|---|---|---|---|
| Quadrant | BADHDUFLAG | Total packets | Discarded packets |
| A | 0 | 128 | 0 |
| B | 0 | 128 | 0 |
| C | 0 | 128 | 0 |
| D | 0 | 128 | 0 |
| Quadrant | Total seconds | Saturated seconds | Saturation percentage |
|---|---|---|---|
| A | 6349 | 2942 | 46.338006% |
| B | 6349 | 1371 | 21.593952% |
| C | 6349 | 185 | 2.913845% |
| D | 6349 | 296 | 4.662152% |
Noise dominated data is calculated using 1-second bins in cleaned event files. If a bin has >2000 counts, and if more than 50% of those come from <1% of pixels, then it is considered to be noise-dominated and hence unusable.
| Quadrant | # 1 sec bins | Bins with >0 counts | Bins with >2000 counts | High rate bins dominated by noise | Noise dominated (total time) | Noise dominated (detector-on time) | Marked lightcurve |
|---|---|---|---|---|---|---|---|
| A | 7559 | 6349 | 2715 | 2715 | 35.92% | 42.76% | 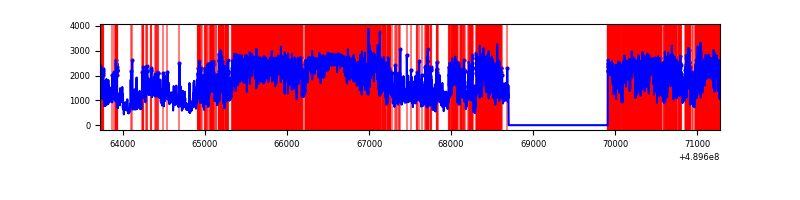 |
| B | 7558 | 6348 | 1084 | 1084 | 14.34% | 17.08% | 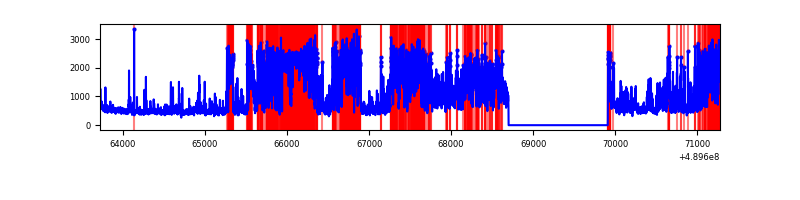 |
| C | 7559 | 6350 | 153 | 153 | 2.02% | 2.41% | 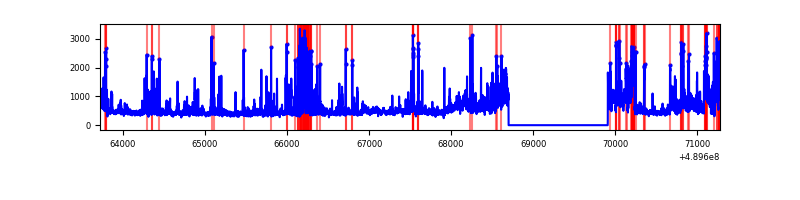 |
| D | 7559 | 6350 | 283 | 283 | 3.74% | 4.46% | 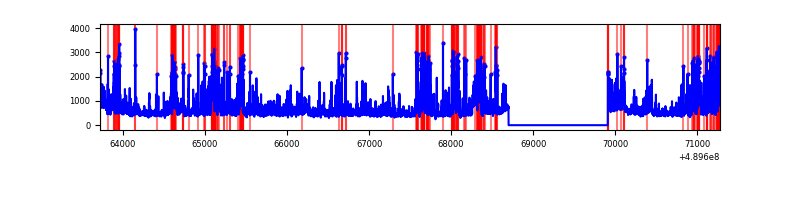 |
Top three noisy pixels from each quadrant. If the there are fewer than three noisy pixels in the level2.evt file, extra rows are filled as -1
| Pixel properties | Quadrant properties | ||||||
|---|---|---|---|---|---|---|---|
| Quadrant | DetID | PixID | Counts | Sigma | Mean | Median | Sigma |
| A | 9 | 191 | 7464554 | 50960.19 | 589 | 577 | 146.5 |
| A | 12 | 17 | 840346 | 5733.51 | 589 | 577 | 146.5 |
| A | 8 | 43 | 193699 | 1318.54 | 589 | 577 | 146.5 |
| B | 8 | 3 | 2511576 | 18822.38 | 632 | 613 | 133.4 |
| B | 10 | 44 | 1466514 | 10988.51 | 632 | 613 | 133.4 |
| B | 4 | 81 | 207191 | 1548.52 | 632 | 613 | 133.4 |
| C | 7 | 80 | 463329 | 2576.58 | 651 | 643 | 179.6 |
| C | 2 | 12 | 294510 | 1636.47 | 651 | 643 | 179.6 |
| C | 12 | 252 | 213915 | 1187.66 | 651 | 643 | 179.6 |
| D | 8 | 176 | 780183 | 4104.92 | 657 | 627 | 189.9 |
| D | 2 | 249 | 426120 | 2240.52 | 657 | 627 | 189.9 |
| D | 10 | 172 | 317563 | 1668.89 | 657 | 627 | 189.9 |
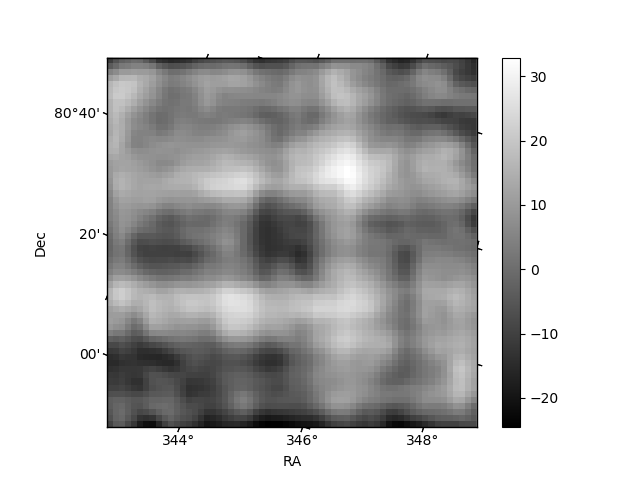
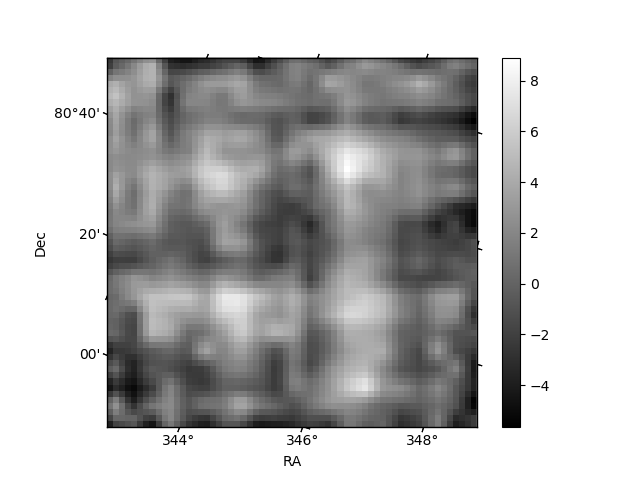
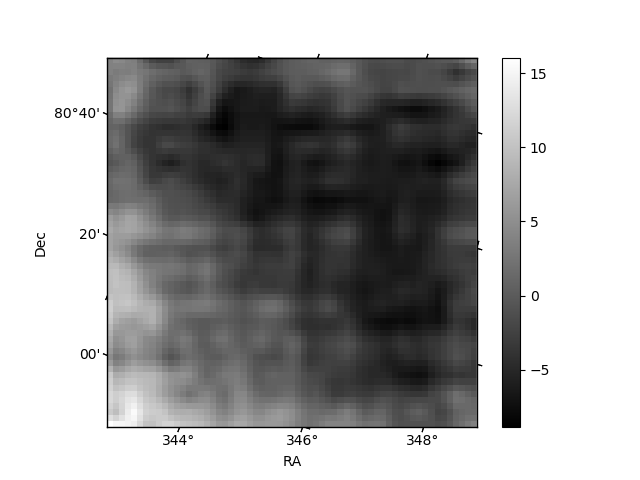
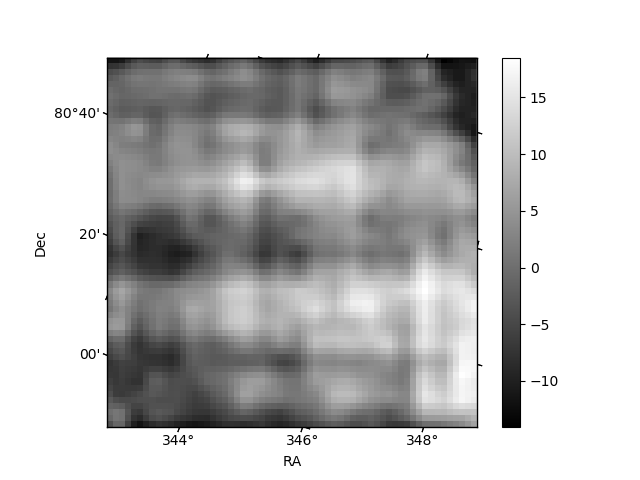
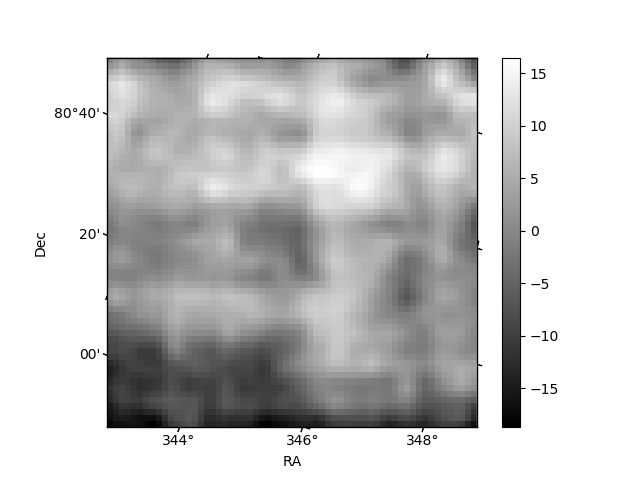
Histogram calculated using DETX and DETY for each event in the final _common_clean file
| Quadrant A | 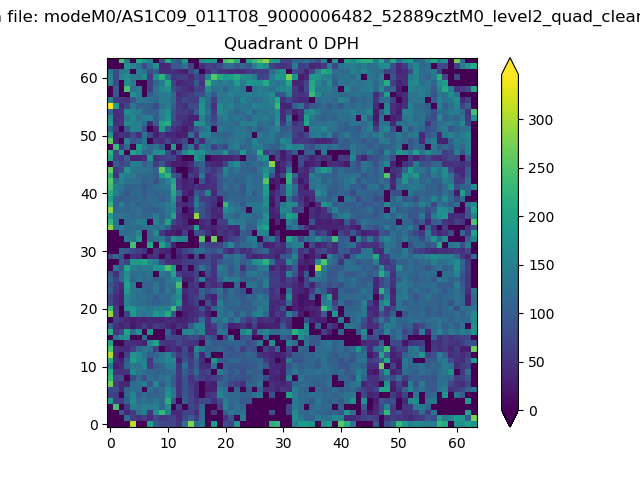 |
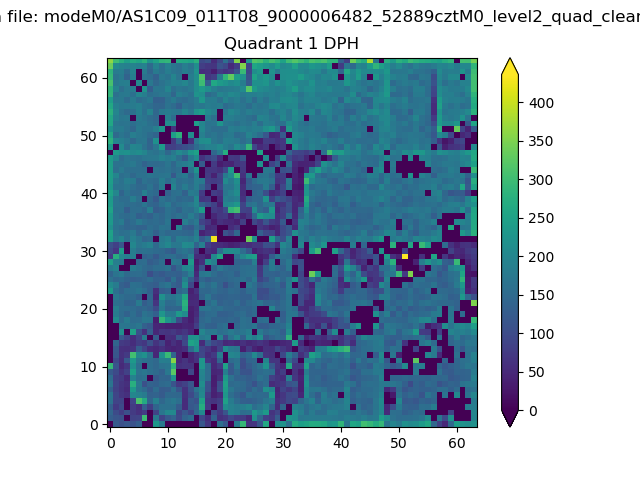 |
Quadrant B |
|---|---|---|---|
| Quadrant D | 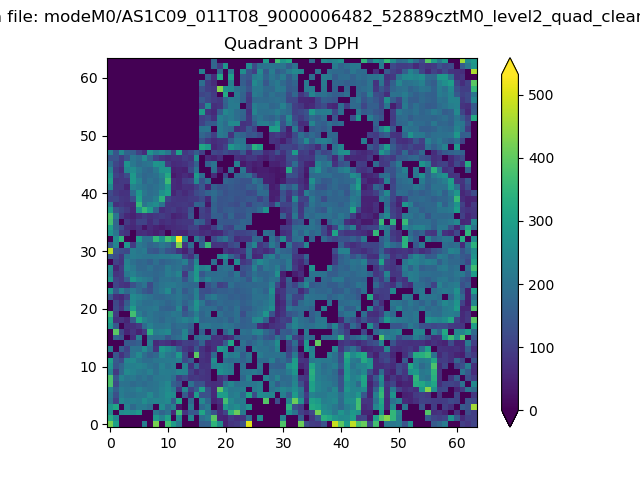 |
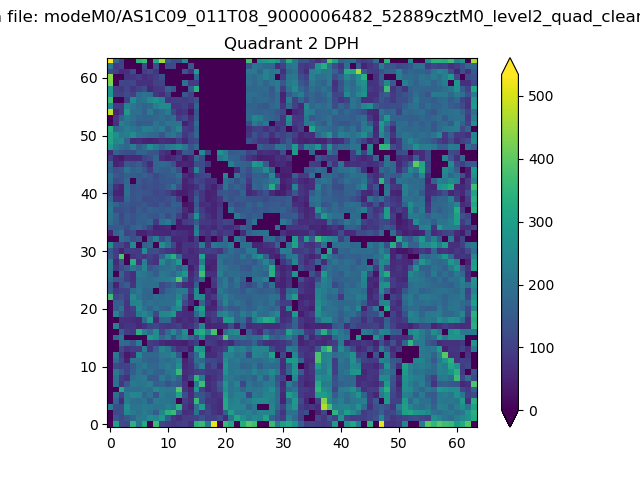 |
Quadrant C |
| Plot type | Count rate plots | Images |
|---|---|---|
| Comparison with Poisson distribution Blue bars denote a histogram of data divided into 1 sec bins. Red curve is a Poisson curve with rate = median count rate of data. |
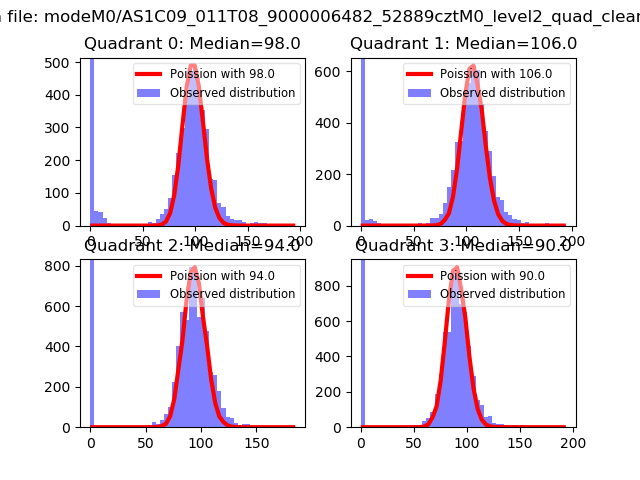 |
 |
| Quadrant-wise count rates Data is divided into 100 sec bins |
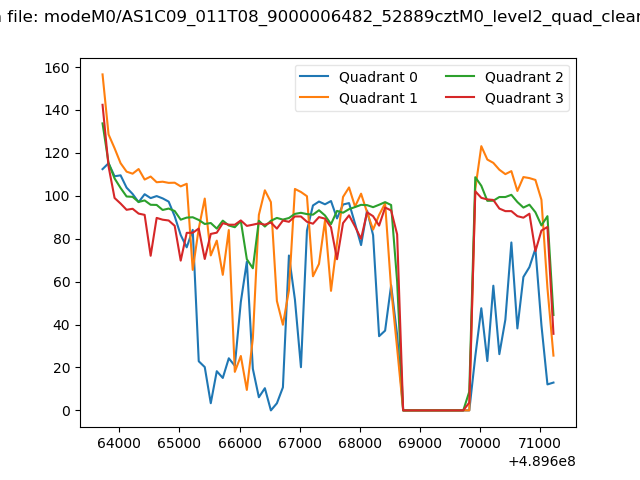 |
|
| Module-wise count rates for Quadrant A Data is divided into 100 sec bins |
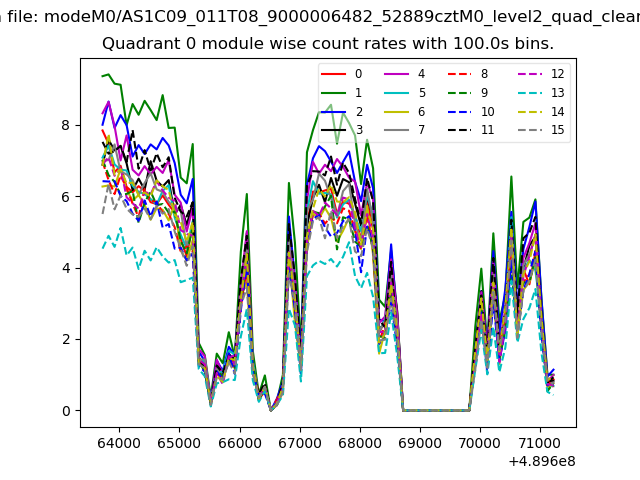 |
 |
| Module-wise count rates for Quadrant B Data is divided into 100 sec bins |
 |
 |
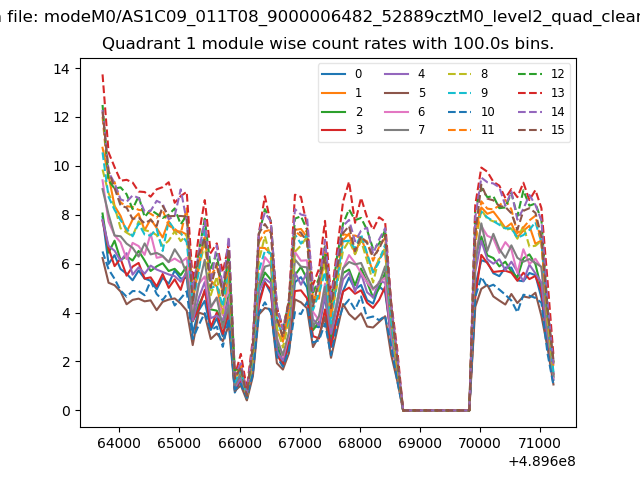
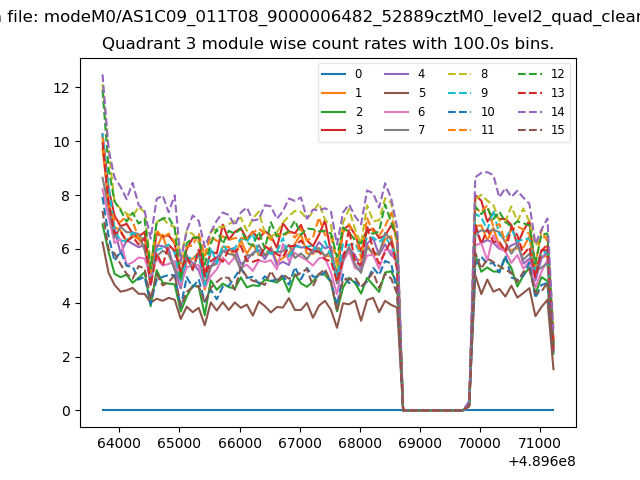
| Module-wise count rates for Quadrant C Data is divided into 100 sec bins |
 |
 |
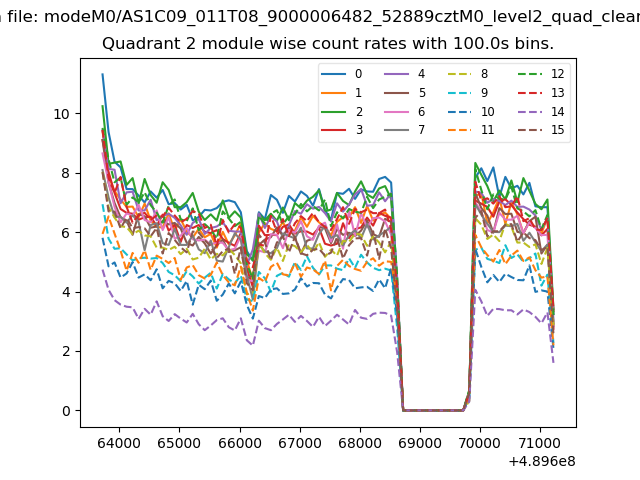
| Module-wise count rates for Quadrant D Data is divided into 100 sec bins |
 |
 |
| Parameter | Plot |
|---|---|
| CZT HV Monitor | 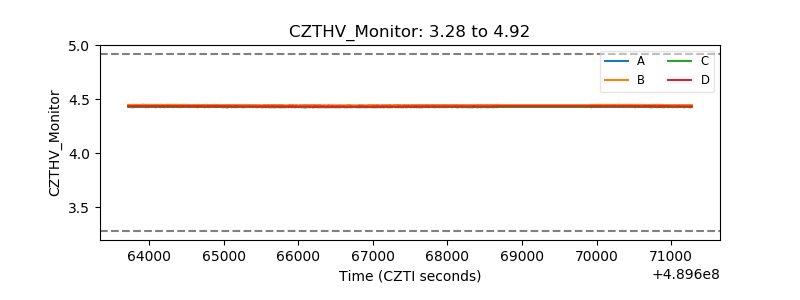 |
| D_VDD | 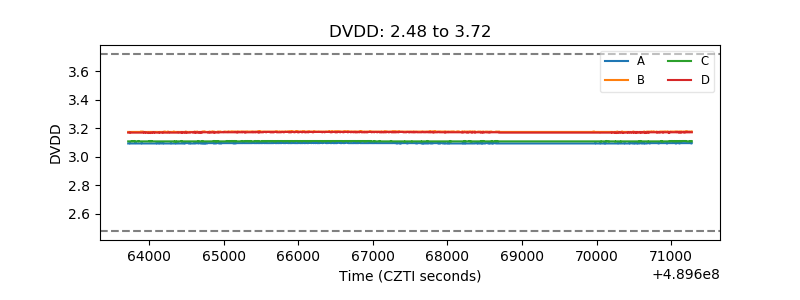 |
| Temperature 1 |  |
| Veto HV Monitor |  |
| Veto LLD | 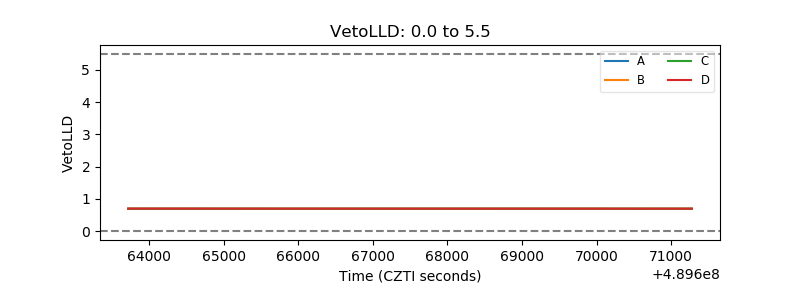 |
| Alpha Counter | 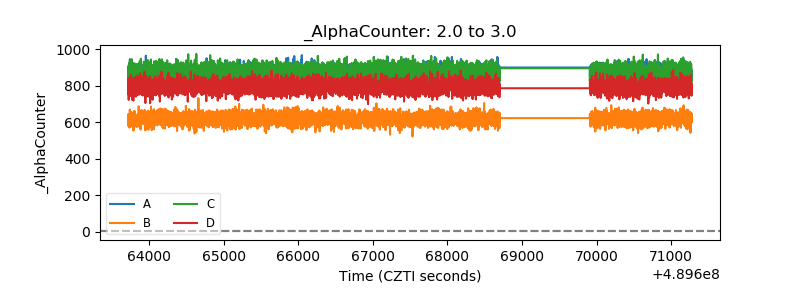 |
| _CPM_Rate | 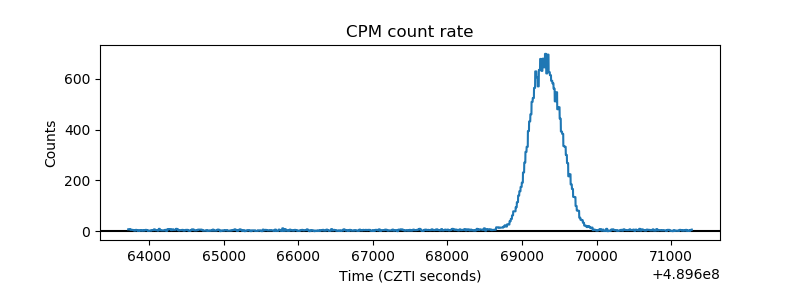 |
| CZT Counter | 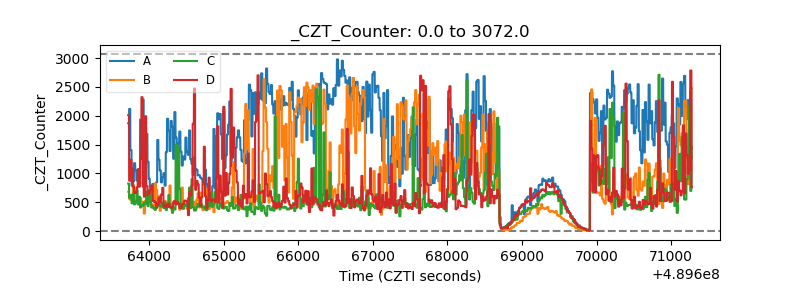 |
| +2.5 Volts monitor |  |
| +5 Volts monitor |  |
| _ROLL_ROT | 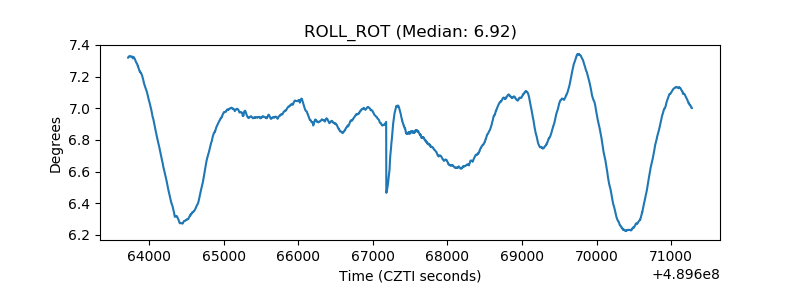 |
| _Roll_DEC | 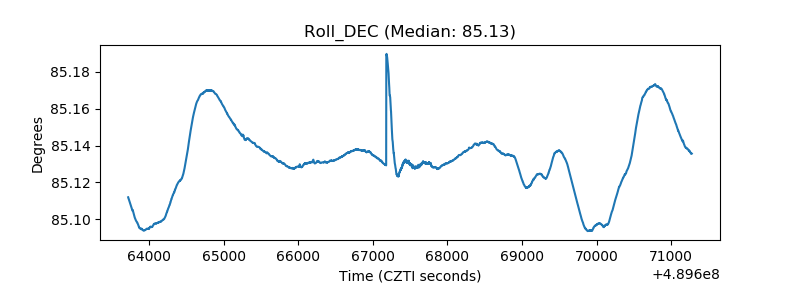 |
| _Roll_RA | 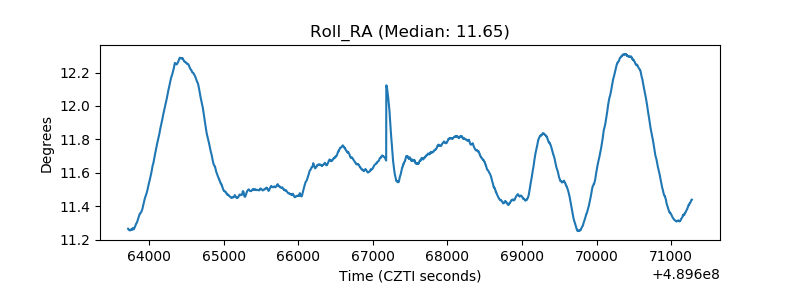 |
| Veto Counter | 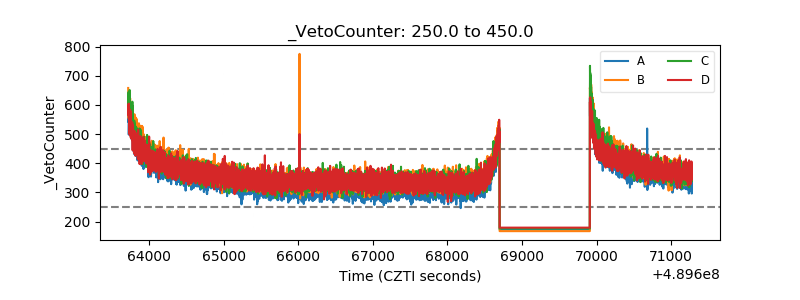 |