| Param | Original file | Final file |
|---|---|---|
| Filename | modeM0/AS1C09_011T08_9000006482_52890cztM0_level2.fits | modeM0/AS1C09_011T08_9000006482_52890cztM0_level2_quad_clean.evt |
| Size (bytes) | 891,541,440 | 82,998,720 |
| Size | 850.2 MB | 79.2 MB |
| Events in quadrant A | 13,837,222 | 293,896 |
| Events in quadrant B | 7,713,322 | 576,411 |
| Events in quadrant C | 4,343,805 | 617,409 |
| Events in quadrant D | 6,589,356 | 557,594 |
| Mode M0 | |||
|---|---|---|---|
| Quadrant | BADHDUFLAG | Total packets | Discarded packets |
| A | 0 | 45697 | 1 |
| B | 0 | 27509 | 1 |
| C | 0 | 17531 | 1 |
| D | 0 | 24156 | 1 |
| Mode M9 | |||
|---|---|---|---|
| Quadrant | BADHDUFLAG | Total packets | Discarded packets |
| A | 0 | 12 | 0 |
| B | 0 | 12 | 0 |
| C | 0 | 12 | 0 |
| D | 0 | 12 | 0 |
| Mode SS | |||
|---|---|---|---|
| Quadrant | BADHDUFLAG | Total packets | Discarded packets |
| A | 0 | 136 | 0 |
| B | 0 | 136 | 0 |
| C | 0 | 136 | 0 |
| D | 0 | 136 | 0 |
| Quadrant | Total seconds | Saturated seconds | Saturation percentage |
|---|---|---|---|
| A | 6704 | 4313 | 64.334726% |
| B | 6704 | 1611 | 24.030430% |
| C | 6705 | 201 | 2.997763% |
| D | 6705 | 697 | 10.395227% |
Noise dominated data is calculated using 1-second bins in cleaned event files. If a bin has >2000 counts, and if more than 50% of those come from <1% of pixels, then it is considered to be noise-dominated and hence unusable.
| Quadrant | # 1 sec bins | Bins with >0 counts | Bins with >2000 counts | High rate bins dominated by noise | Noise dominated (total time) | Noise dominated (detector-on time) | Marked lightcurve |
|---|---|---|---|---|---|---|---|
| A | 7854 | 6704 | 4090 | 4090 | 52.08% | 61.01% | 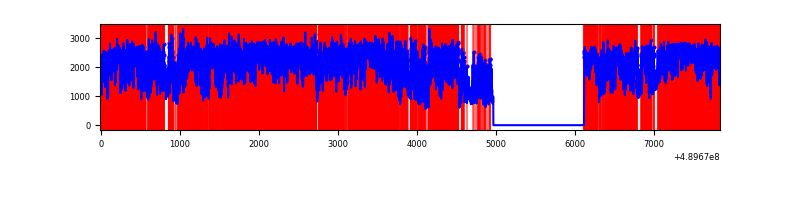 |
| B | 7854 | 6704 | 1403 | 1403 | 17.86% | 20.93% | 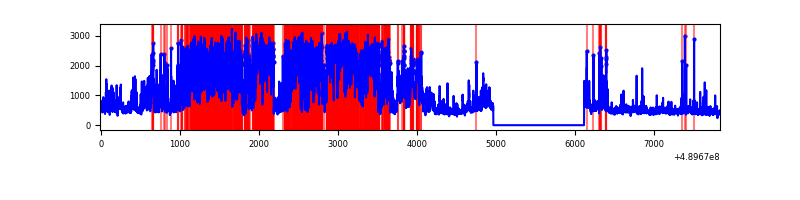 |
| C | 7855 | 6705 | 151 | 151 | 1.92% | 2.25% | 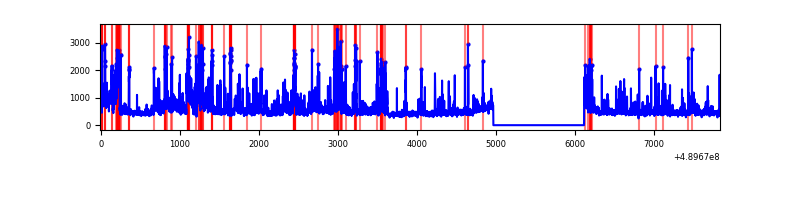 |
| D | 7855 | 6705 | 639 | 639 | 8.13% | 9.53% | 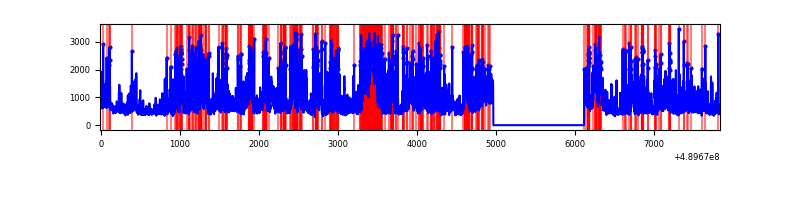 |
Top three noisy pixels from each quadrant. If the there are fewer than three noisy pixels in the level2.evt file, extra rows are filled as -1
| Pixel properties | Quadrant properties | ||||||
|---|---|---|---|---|---|---|---|
| Quadrant | DetID | PixID | Counts | Sigma | Mean | Median | Sigma |
| A | 9 | 191 | 10288033 | 71244.02 | 581 | 567 | 144.4 |
| A | 12 | 17 | 492977 | 3410.1 | 581 | 567 | 144.4 |
| A | 8 | 43 | 249837 | 1726.28 | 581 | 567 | 144.4 |
| B | 8 | 3 | 4174361 | 29583.22 | 667 | 644 | 141.1 |
| B | 10 | 254 | 363983 | 2575.34 | 667 | 644 | 141.1 |
| B | 4 | 81 | 86212 | 606.5 | 667 | 644 | 141.1 |
| C | 7 | 80 | 535570 | 2822.58 | 694 | 688 | 189.5 |
| C | 2 | 12 | 175359 | 921.74 | 694 | 688 | 189.5 |
| C | 3 | 233 | 133784 | 702.35 | 694 | 688 | 189.5 |
| D | 8 | 176 | 1681619 | 8625.84 | 679 | 649 | 194.9 |
| D | 15 | 125 | 687679 | 3525.47 | 679 | 649 | 194.9 |
| D | 10 | 172 | 338817 | 1735.3 | 679 | 649 | 194.9 |
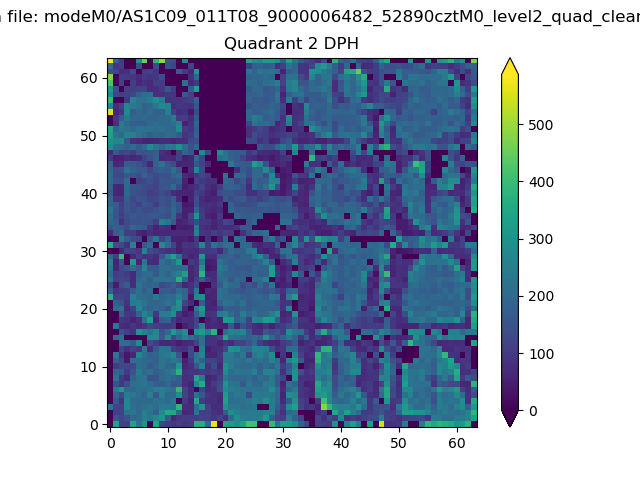
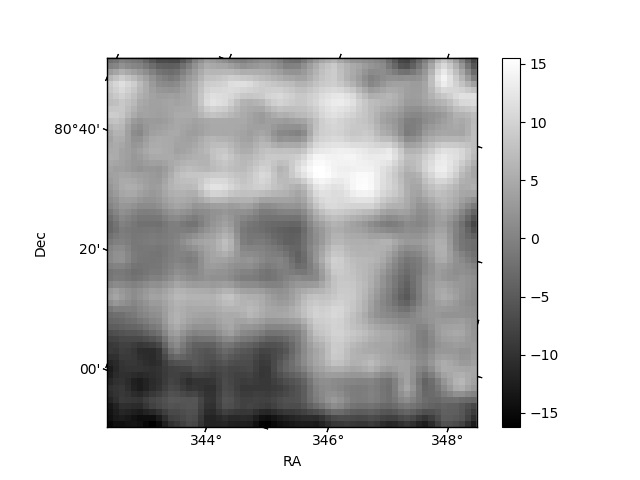
Histogram calculated using DETX and DETY for each event in the final _common_clean file
| Quadrant A | 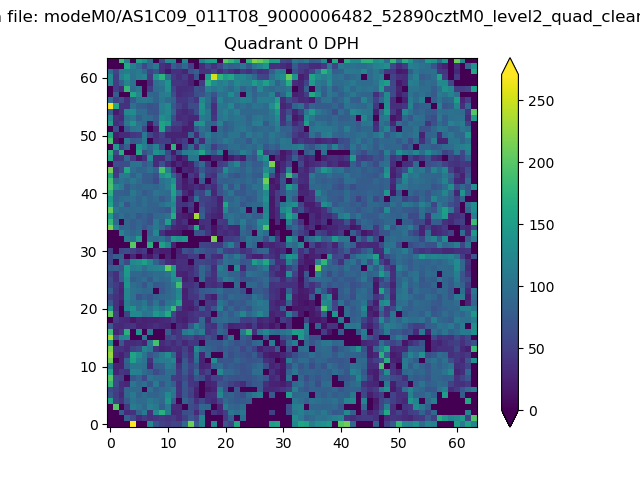 |
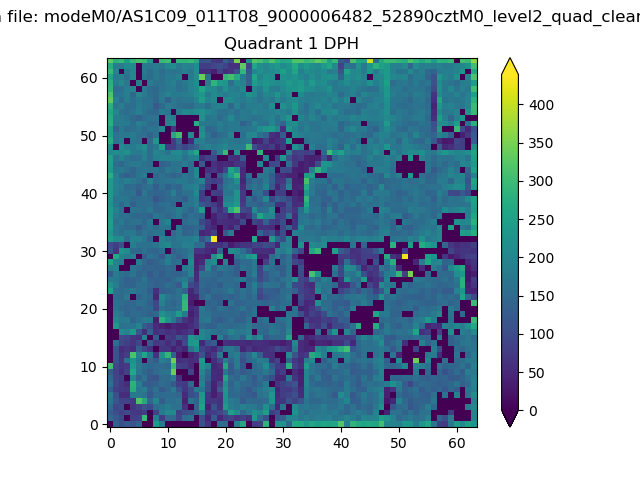 |
Quadrant B |
|---|---|---|---|
| Quadrant D | 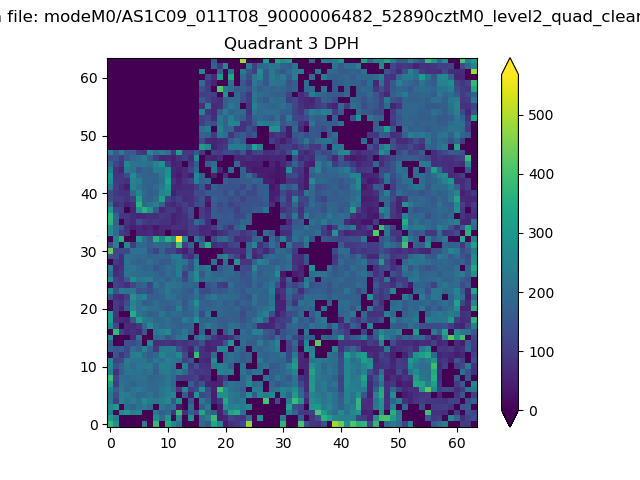 |
 |
Quadrant C |
| Plot type | Count rate plots | Images |
|---|---|---|
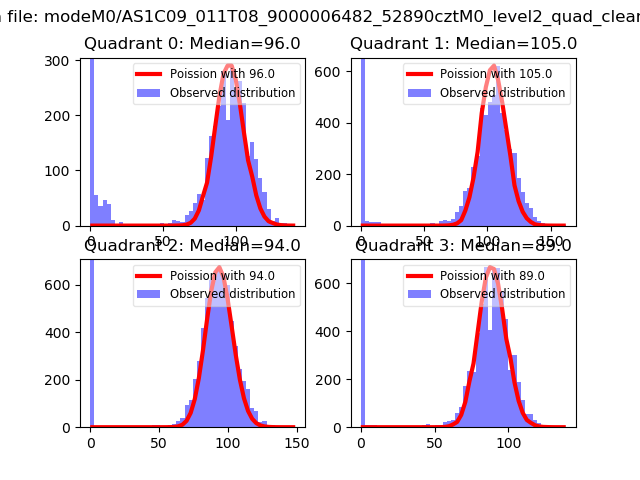
| Comparison with Poisson distribution Blue bars denote a histogram of data divided into 1 sec bins. Red curve is a Poisson curve with rate = median count rate of data. |
 |
 |
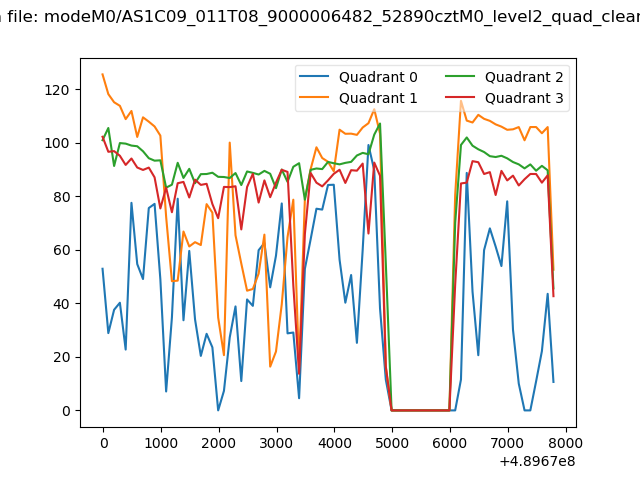
| Quadrant-wise count rates Data is divided into 100 sec bins |
 |
|
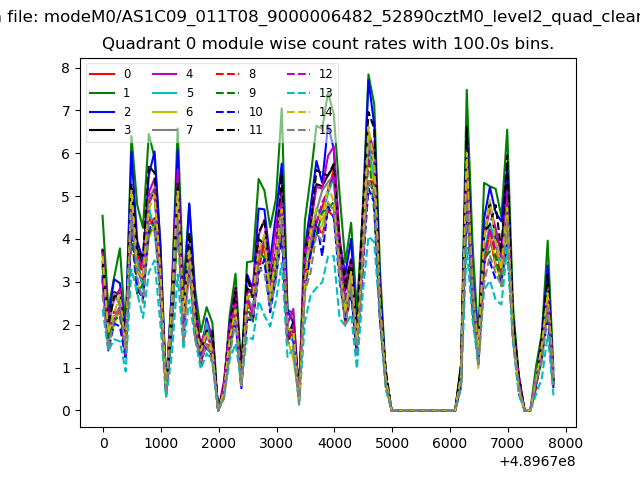
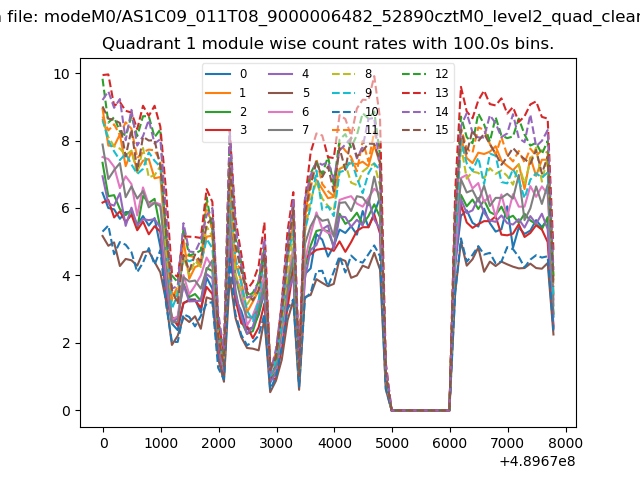
| Module-wise count rates for Quadrant A Data is divided into 100 sec bins |
 |
 |
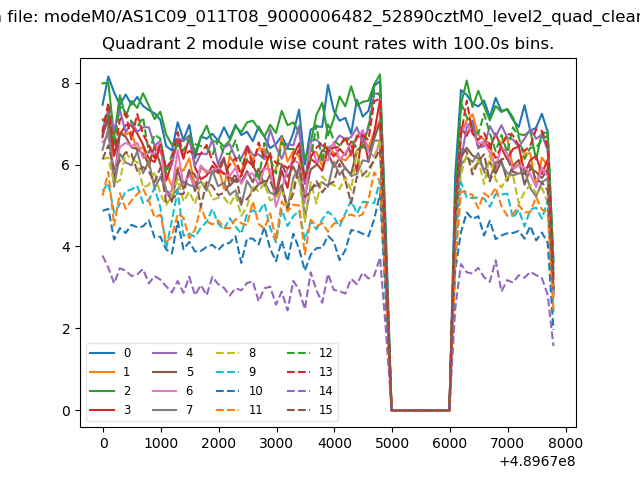
| Module-wise count rates for Quadrant B Data is divided into 100 sec bins |
 |
 |
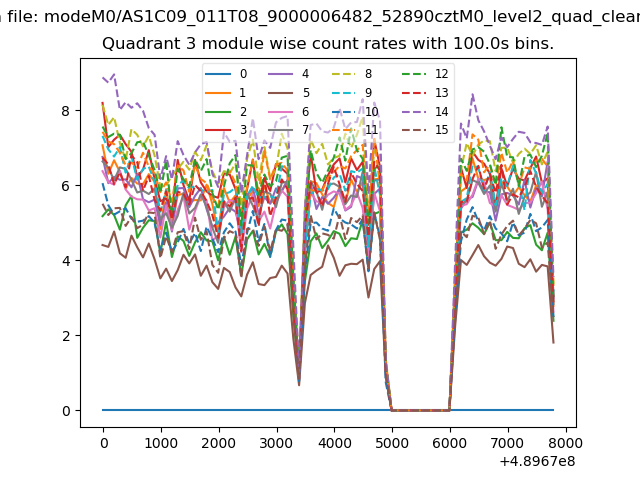
| Module-wise count rates for Quadrant C Data is divided into 100 sec bins |
 |
 |
| Module-wise count rates for Quadrant D Data is divided into 100 sec bins |
 |
 |
| Parameter | Plot |
|---|---|
| CZT HV Monitor | 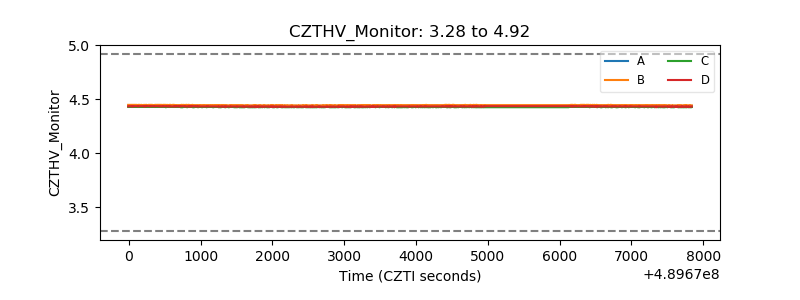 |
| D_VDD | 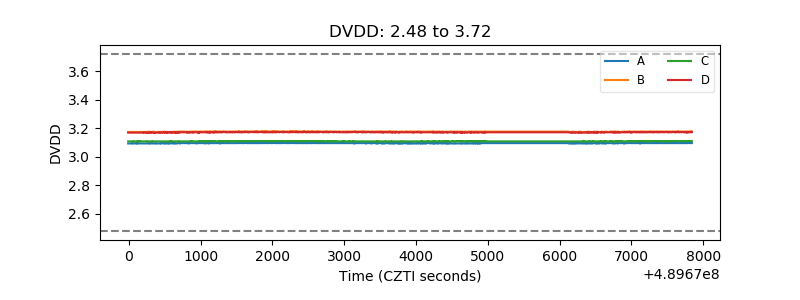 |
| Temperature 1 | 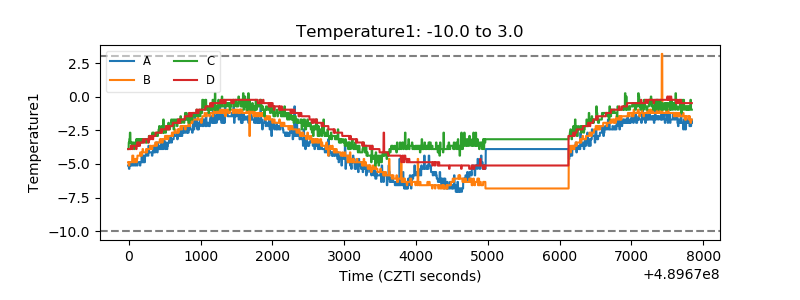 |
| Veto HV Monitor | 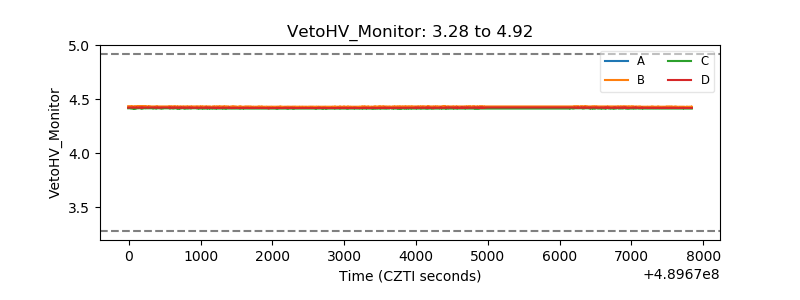 |
| Veto LLD | 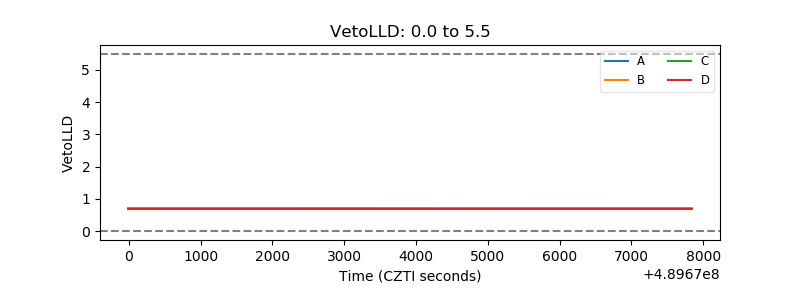 |
| Alpha Counter |  |
| _CPM_Rate | 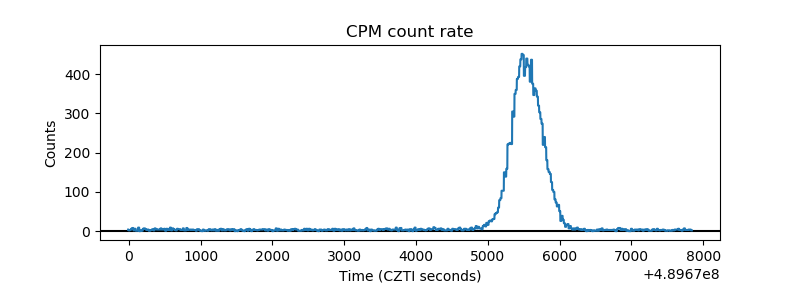 |
| CZT Counter | 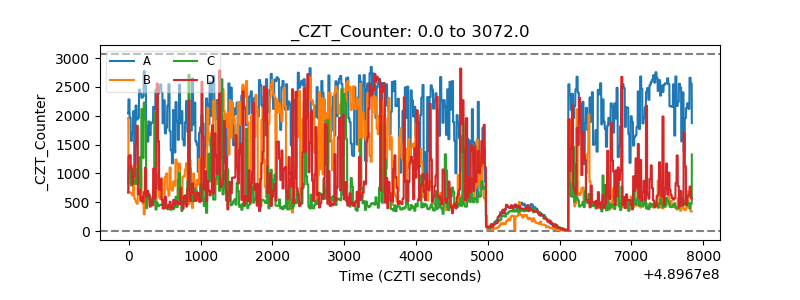 |
| +2.5 Volts monitor | 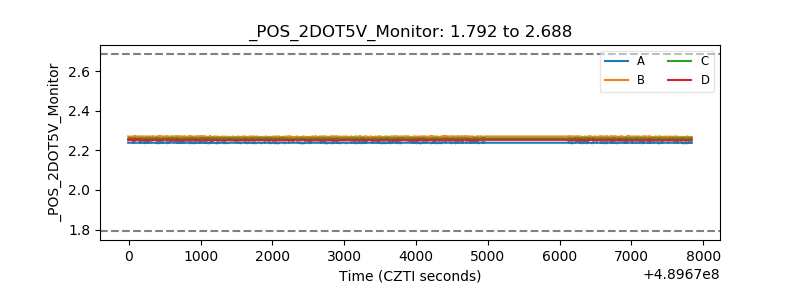 |
| +5 Volts monitor | 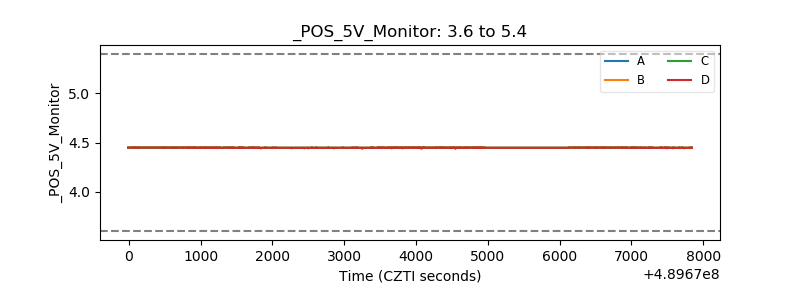 |
| _ROLL_ROT | 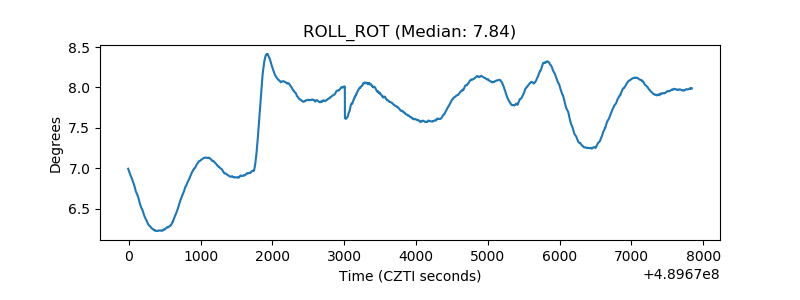 |
| _Roll_DEC | 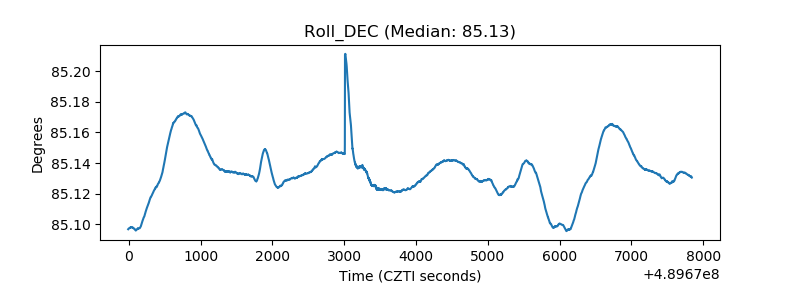 |
| _Roll_RA | 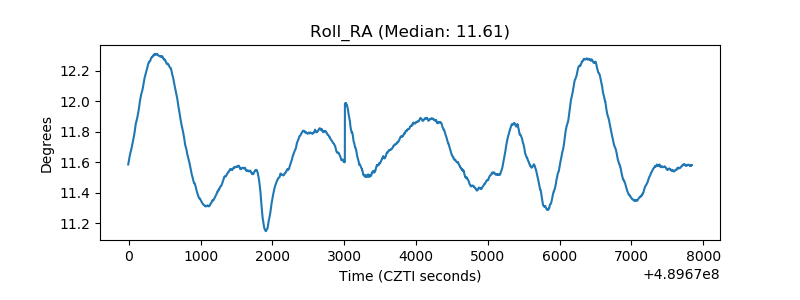 |
| Veto Counter | 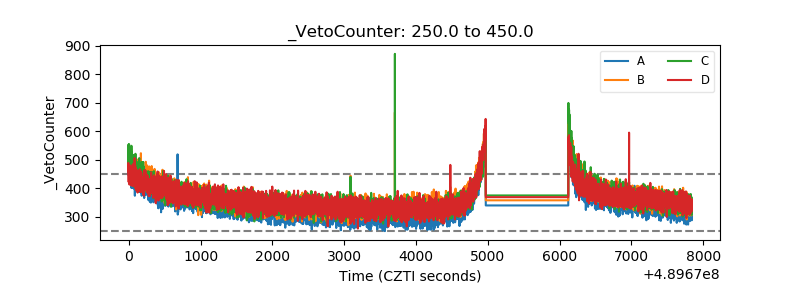 |