| Param | Original file | Final file |
|---|---|---|
| Filename | modeM0/AS1C09_011T08_9000006482_52891cztM0_level2.fits | modeM0/AS1C09_011T08_9000006482_52891cztM0_level2_quad_clean.evt |
| Size (bytes) | 552,093,120 | 86,567,040 |
| Size | 526.5 MB | 82.6 MB |
| Events in quadrant A | 5,934,778 | 514,820 |
| Events in quadrant B | 3,311,762 | 639,494 |
| Events in quadrant C | 3,318,630 | 567,527 |
| Events in quadrant D | 7,385,069 | 462,579 |
| Mode M0 | |||
|---|---|---|---|
| Quadrant | BADHDUFLAG | Total packets | Discarded packets |
| A | 0 | 21838 | 1 |
| B | 0 | 14171 | 1 |
| C | 0 | 14170 | 1 |
| D | 0 | 26287 | 1 |
| Mode M9 | |||
|---|---|---|---|
| Quadrant | BADHDUFLAG | Total packets | Discarded packets |
| A | 0 | 11 | 0 |
| B | 0 | 11 | 0 |
| C | 0 | 11 | 0 |
| D | 0 | 11 | 0 |
| Mode SS | |||
|---|---|---|---|
| Quadrant | BADHDUFLAG | Total packets | Discarded packets |
| A | 0 | 126 | 0 |
| B | 0 | 126 | 0 |
| C | 0 | 126 | 0 |
| D | 0 | 126 | 0 |
| Quadrant | Total seconds | Saturated seconds | Saturation percentage |
|---|---|---|---|
| A | 6260 | 1181 | 18.865815% |
| B | 6261 | 156 | 2.491615% |
| C | 6261 | 121 | 1.932599% |
| D | 6261 | 1222 | 19.517649% |
Noise dominated data is calculated using 1-second bins in cleaned event files. If a bin has >2000 counts, and if more than 50% of those come from <1% of pixels, then it is considered to be noise-dominated and hence unusable.
| Quadrant | # 1 sec bins | Bins with >0 counts | Bins with >2000 counts | High rate bins dominated by noise | Noise dominated (total time) | Noise dominated (detector-on time) | Marked lightcurve |
|---|---|---|---|---|---|---|---|
| A | 7275 | 6260 | 1054 | 1054 | 14.49% | 16.84% | 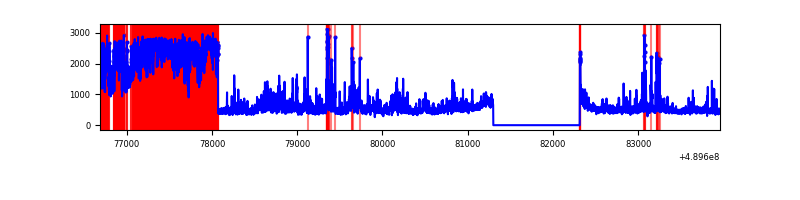 |
| B | 7276 | 6261 | 40 | 40 | 0.55% | 0.64% | 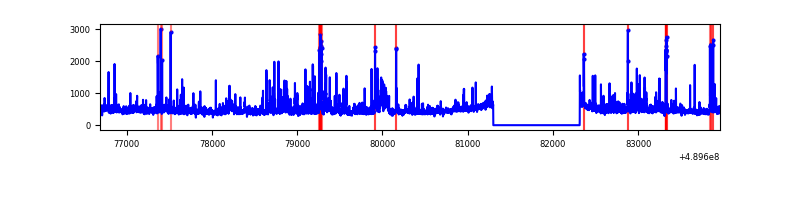 |
| C | 7276 | 6261 | 55 | 55 | 0.76% | 0.88% | 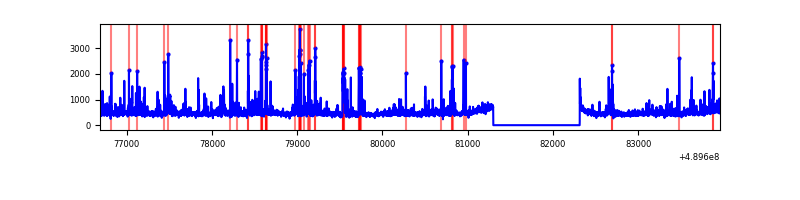 |
| D | 7275 | 6260 | 1068 | 1068 | 14.68% | 17.06% | 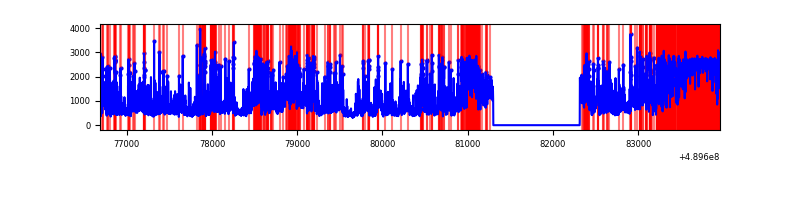 |
Top three noisy pixels from each quadrant. If the there are fewer than three noisy pixels in the level2.evt file, extra rows are filled as -1
| Pixel properties | Quadrant properties | ||||||
|---|---|---|---|---|---|---|---|
| Quadrant | DetID | PixID | Counts | Sigma | Mean | Median | Sigma |
| A | 9 | 191 | 2551344 | 16388.52 | 625 | 609 | 155.6 |
| A | 12 | 17 | 258871 | 1659.34 | 625 | 609 | 155.6 |
| A | 6 | 129 | 87108 | 555.76 | 625 | 609 | 155.6 |
| B | 0 | 213 | 146567 | 1058.61 | 653 | 630 | 137.9 |
| B | 10 | 254 | 128115 | 924.76 | 653 | 630 | 137.9 |
| B | 4 | 81 | 118884 | 857.8 | 653 | 630 | 137.9 |
| C | 15 | 224 | 149620 | 843.03 | 644 | 638 | 176.7 |
| C | 3 | 233 | 120304 | 677.14 | 644 | 638 | 176.7 |
| C | 14 | 254 | 81281 | 456.33 | 644 | 638 | 176.7 |
| D | 15 | 125 | 1297083 | 7474.19 | 595 | 567 | 173.5 |
| D | 8 | 176 | 1235244 | 7117.7 | 595 | 567 | 173.5 |
| D | 9 | 49 | 919571 | 5297.9 | 595 | 567 | 173.5 |
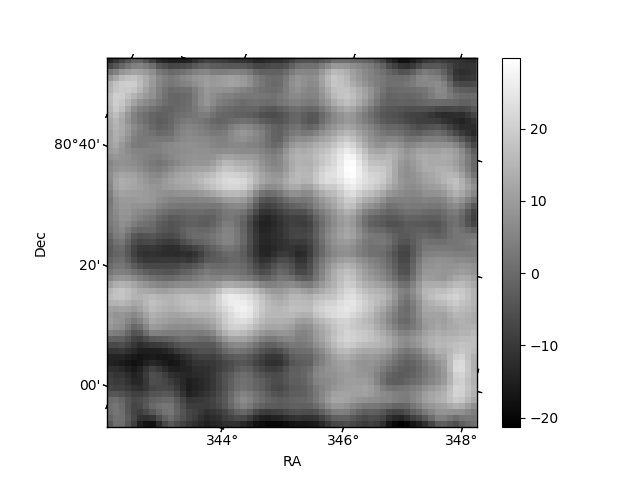
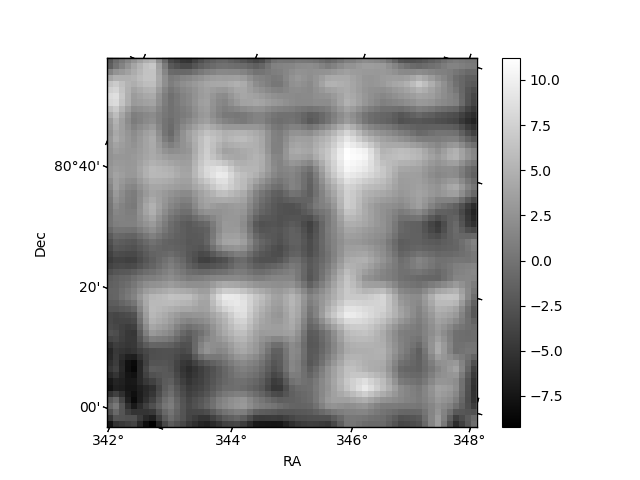
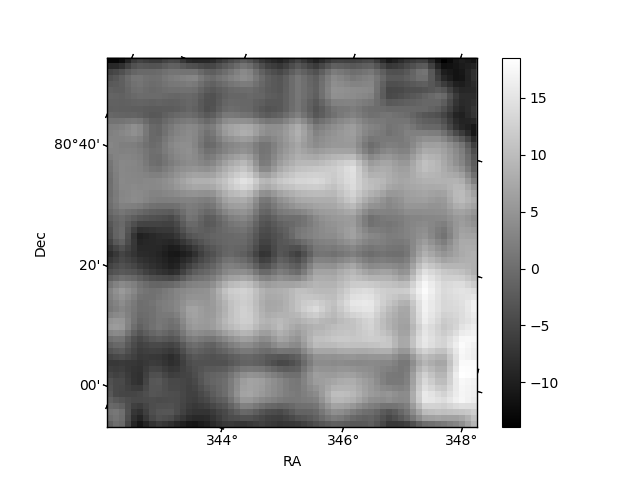
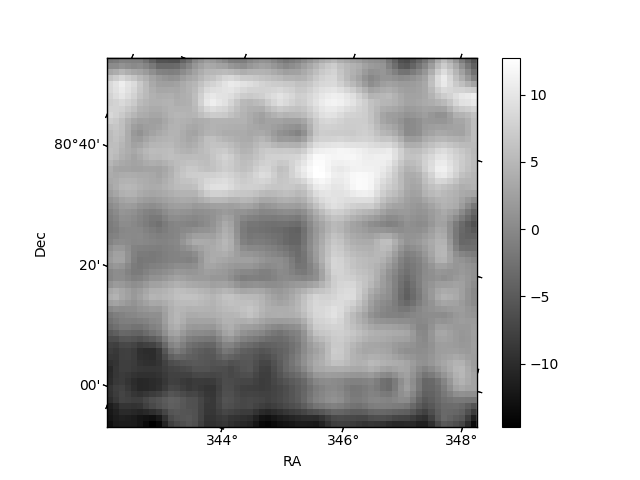
Histogram calculated using DETX and DETY for each event in the final _common_clean file
| Quadrant A | 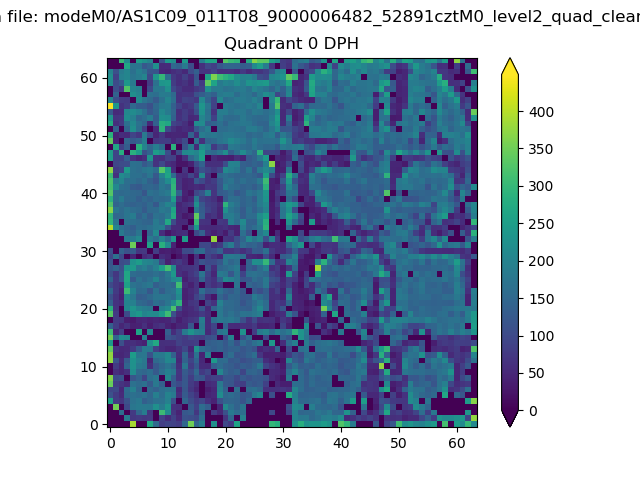 |
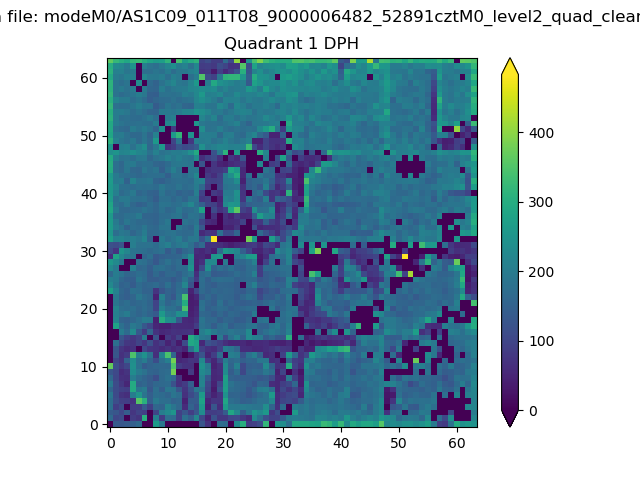 |
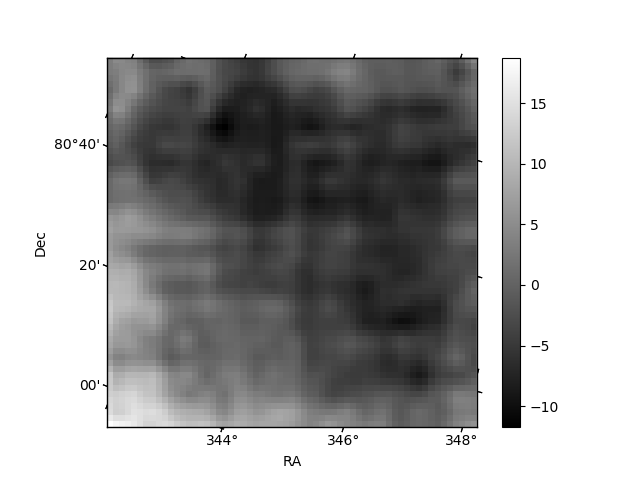
Quadrant B |
|---|---|---|---|
| Quadrant D | 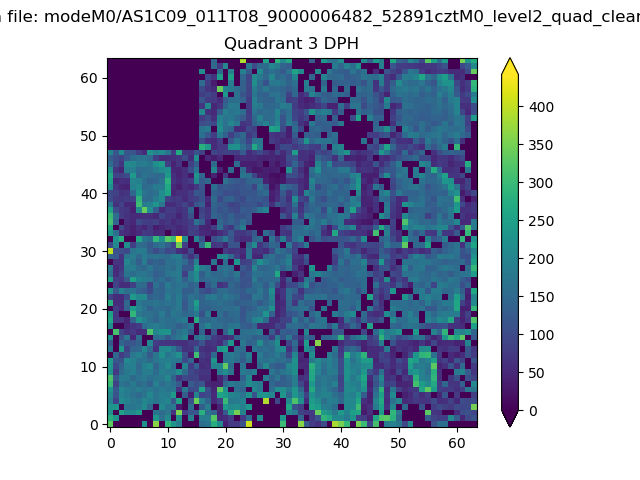 |
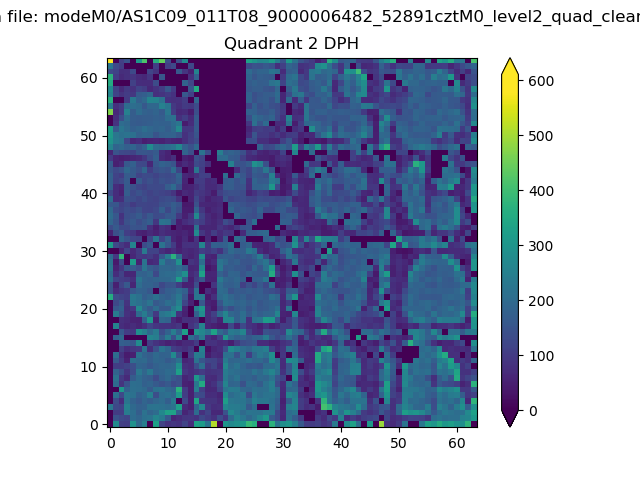 |
Quadrant C |
| Plot type | Count rate plots | Images |
|---|---|---|
| Comparison with Poisson distribution Blue bars denote a histogram of data divided into 1 sec bins. Red curve is a Poisson curve with rate = median count rate of data. |
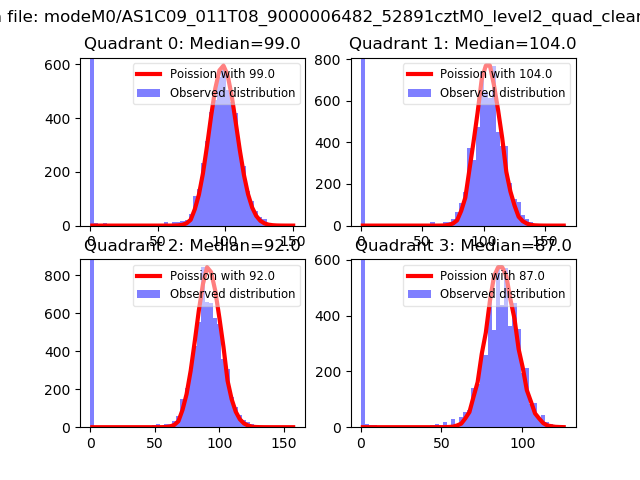 |
 |
| Quadrant-wise count rates Data is divided into 100 sec bins |
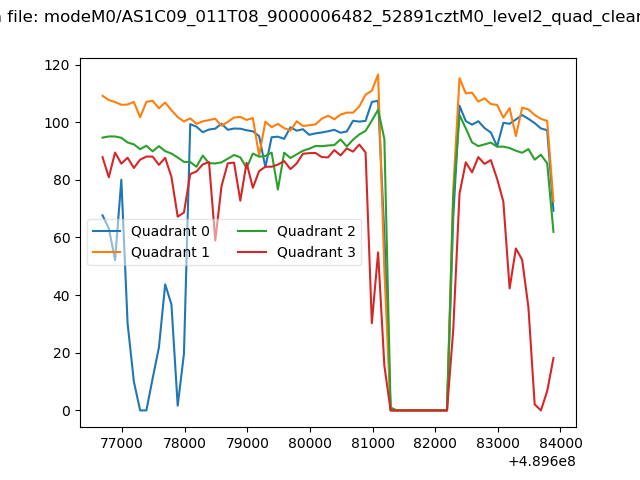 |
|
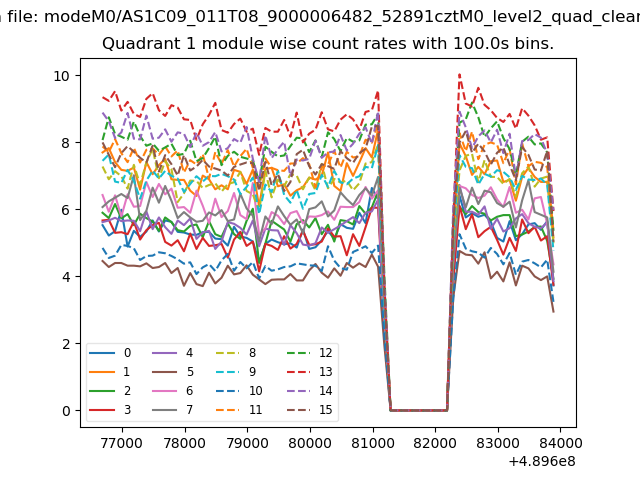
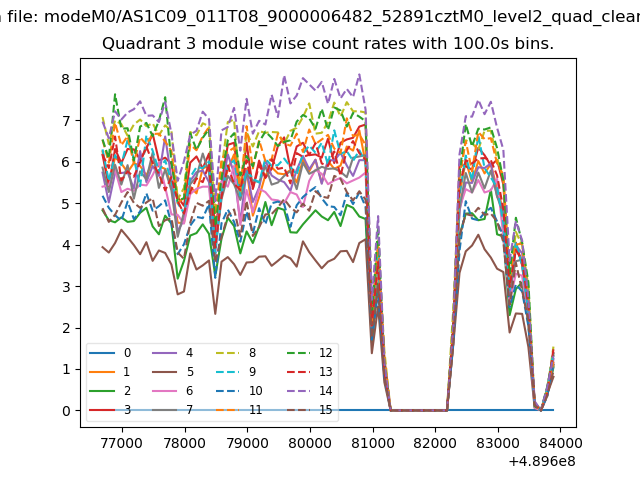
| Module-wise count rates for Quadrant A Data is divided into 100 sec bins |
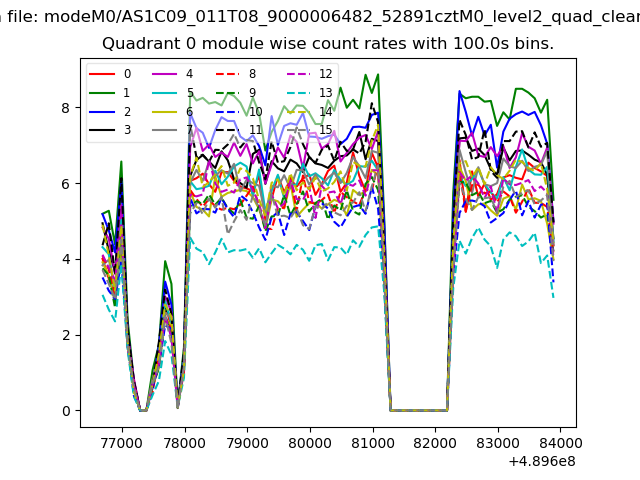 |
 |
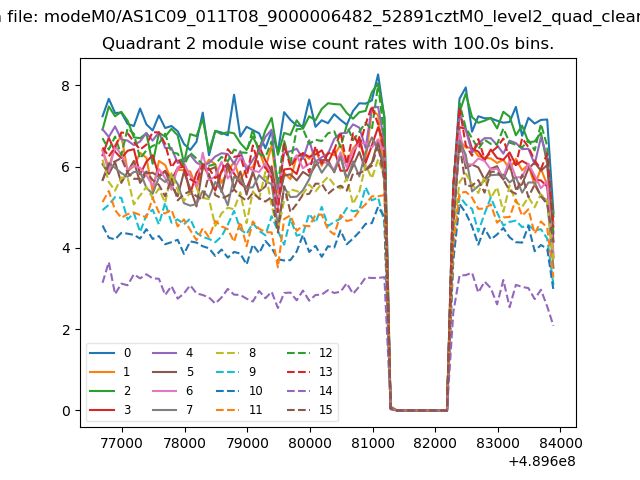
| Module-wise count rates for Quadrant B Data is divided into 100 sec bins |
 |
 |
| Module-wise count rates for Quadrant C Data is divided into 100 sec bins |
 |
 |
| Module-wise count rates for Quadrant D Data is divided into 100 sec bins |
 |
 |
| Parameter | Plot |
|---|---|
| CZT HV Monitor | 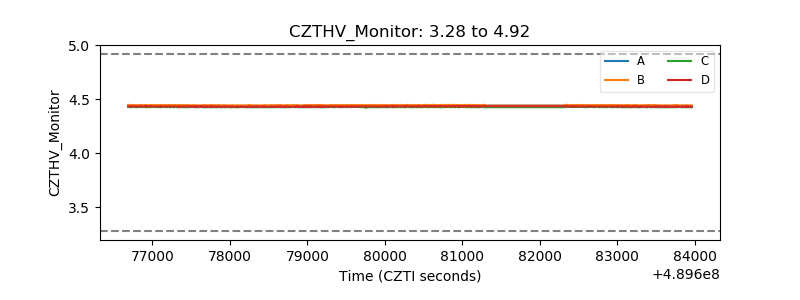 |
| D_VDD | 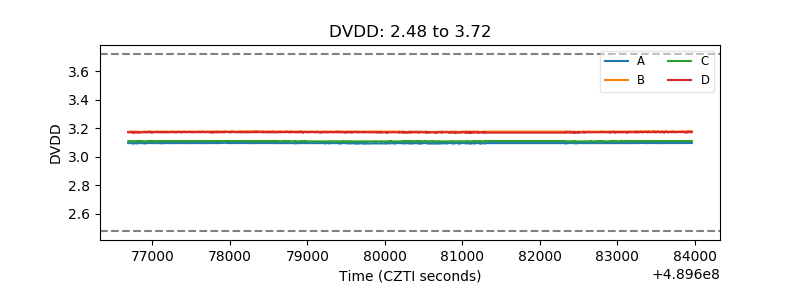 |
| Temperature 1 | 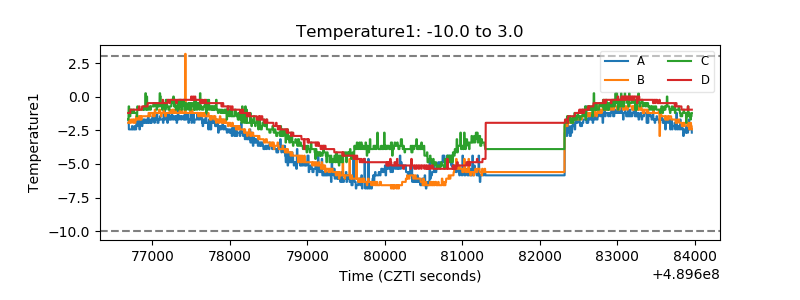 |
| Veto HV Monitor | 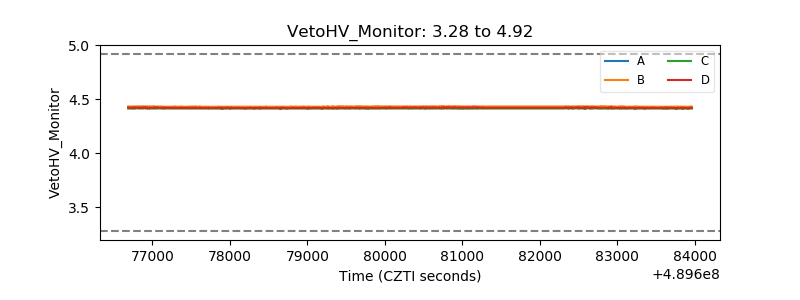 |
| Veto LLD | 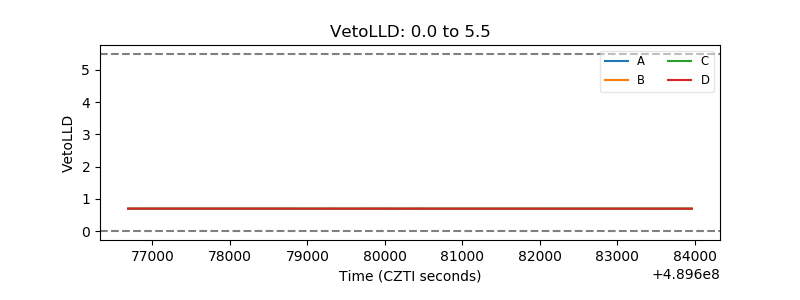 |
| Alpha Counter | 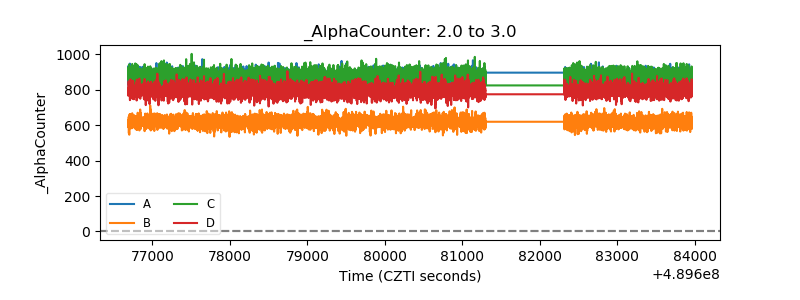 |
| _CPM_Rate | 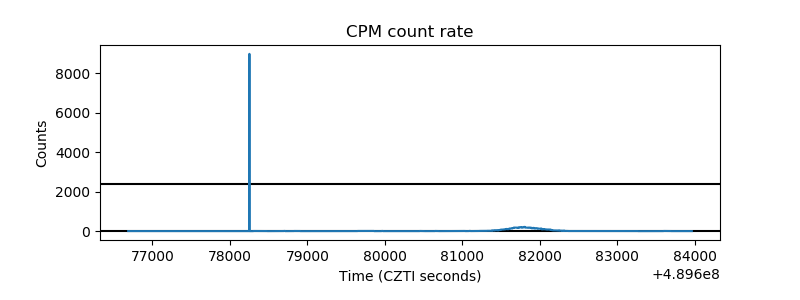 |
| CZT Counter | 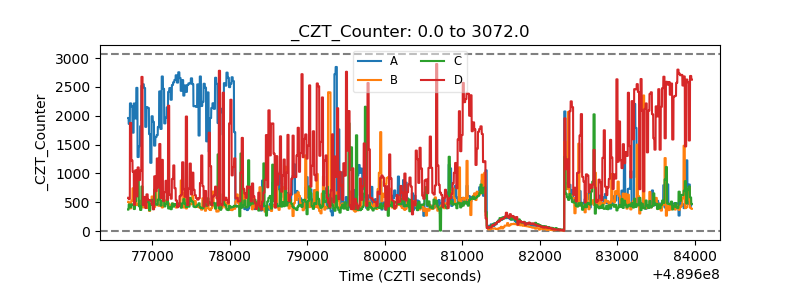 |
| +2.5 Volts monitor | 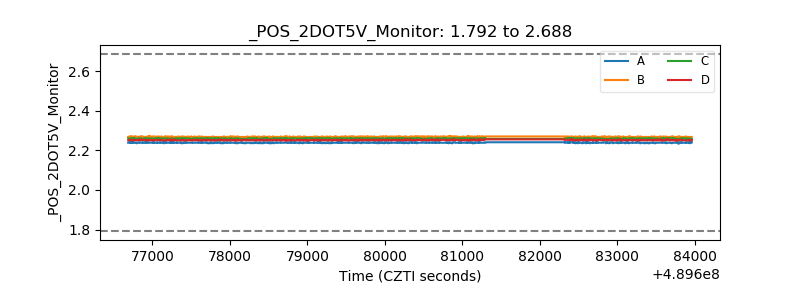 |
| +5 Volts monitor | 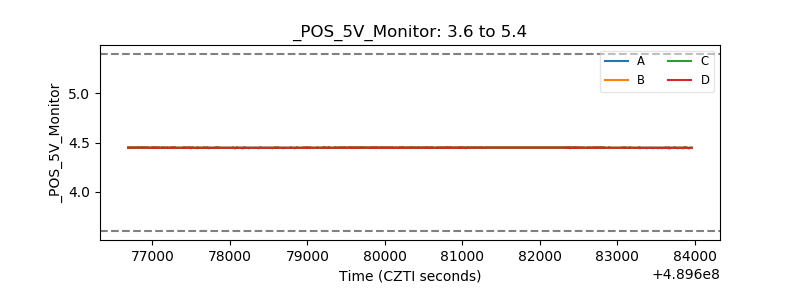 |
| _ROLL_ROT | 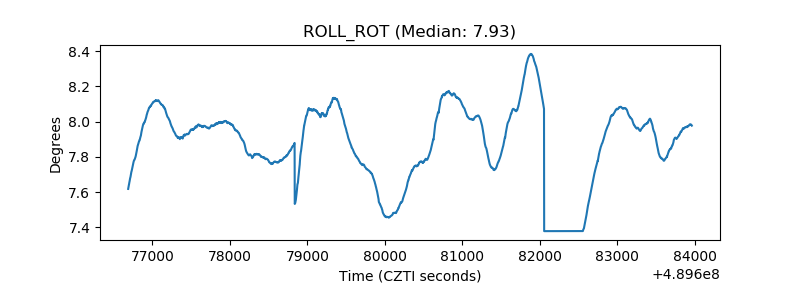 |
| _Roll_DEC | 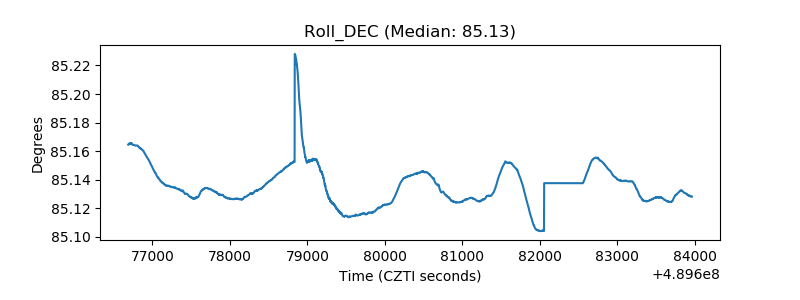 |
| _Roll_RA | 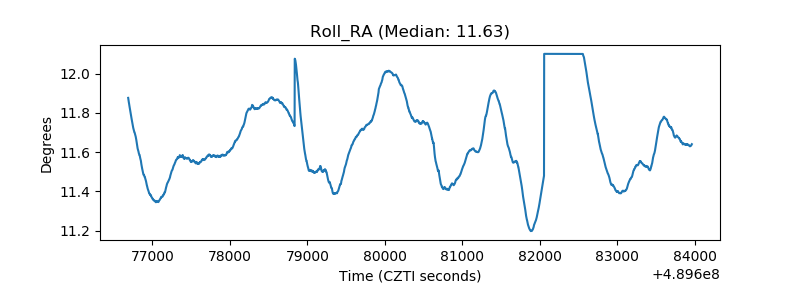 |
| Veto Counter | 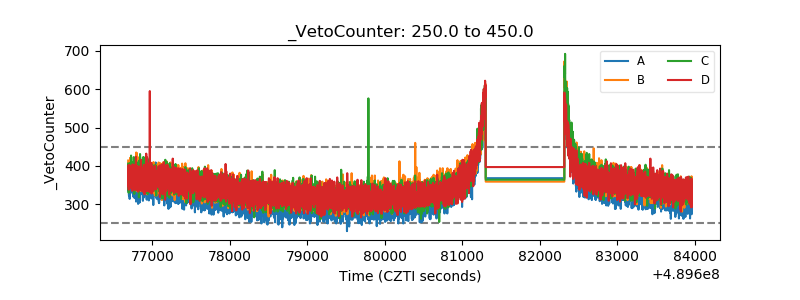 |