| Param | Original file | Final file |
|---|---|---|
| Filename | modeM0/AS1C09_011T08_9000006482_52892cztM0_level2.fits | modeM0/AS1C09_011T08_9000006482_52892cztM0_level2_quad_clean.evt |
| Size (bytes) | 662,071,680 | 92,655,360 |
| Size | 631.4 MB | 88.4 MB |
| Events in quadrant A | 4,190,202 | 677,655 |
| Events in quadrant B | 6,332,614 | 593,078 |
| Events in quadrant C | 4,261,440 | 627,879 |
| Events in quadrant D | 9,204,744 | 440,095 |
| Mode M0 | |||
|---|---|---|---|
| Quadrant | BADHDUFLAG | Total packets | Discarded packets |
| A | 0 | 17078 | 1 |
| B | 0 | 23365 | 1 |
| C | 0 | 17323 | 1 |
| D | 0 | 31989 | 5 |
| Mode M9 | |||
|---|---|---|---|
| Quadrant | BADHDUFLAG | Total packets | Discarded packets |
| A | 0 | 7 | 0 |
| B | 0 | 7 | 0 |
| C | 0 | 7 | 0 |
| D | 0 | 7 | 0 |
| Mode SS | |||
|---|---|---|---|
| Quadrant | BADHDUFLAG | Total packets | Discarded packets |
| A | 0 | 138 | 0 |
| B | 0 | 138 | 0 |
| C | 0 | 138 | 0 |
| D | 0 | 138 | 0 |
| Quadrant | Total seconds | Saturated seconds | Saturation percentage |
|---|---|---|---|
| A | 6687 | 185 | 2.766562% |
| B | 6688 | 1149 | 17.180024% |
| C | 6688 | 177 | 2.646531% |
| D | 6687 | 2165 | 32.376252% |
Noise dominated data is calculated using 1-second bins in cleaned event files. If a bin has >2000 counts, and if more than 50% of those come from <1% of pixels, then it is considered to be noise-dominated and hence unusable.
| Quadrant | # 1 sec bins | Bins with >0 counts | Bins with >2000 counts | High rate bins dominated by noise | Noise dominated (total time) | Noise dominated (detector-on time) | Marked lightcurve |
|---|---|---|---|---|---|---|---|
| A | 7462 | 6688 | 120 | 120 | 1.61% | 1.79% | 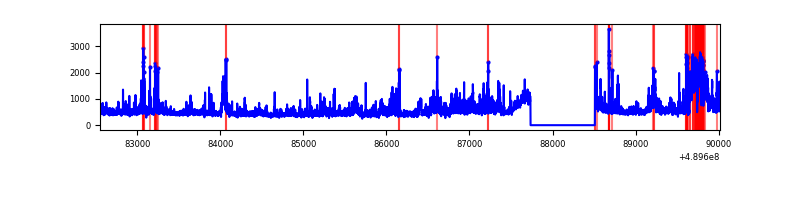 |
| B | 7463 | 6688 | 1006 | 1006 | 13.48% | 15.04% | 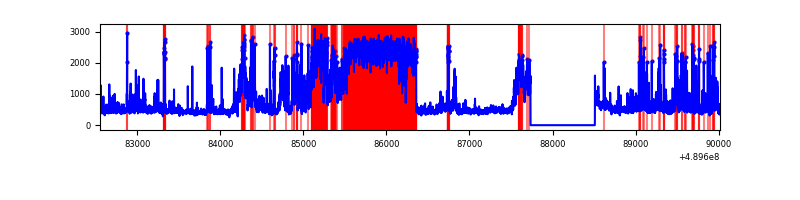 |
| C | 7463 | 6689 | 122 | 122 | 1.63% | 1.82% | 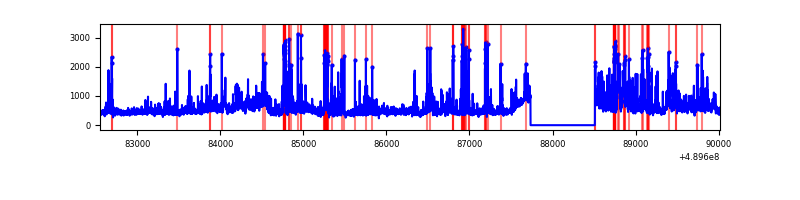 |
| D | 7461 | 6687 | 2051 | 2051 | 27.49% | 30.67% | 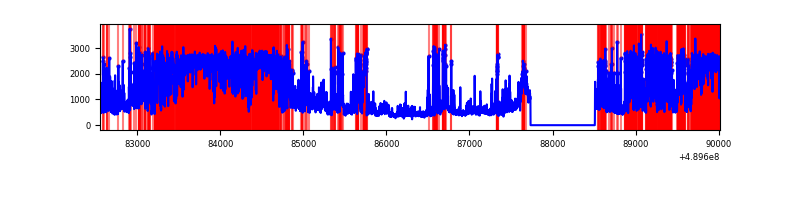 |
Top three noisy pixels from each quadrant. If the there are fewer than three noisy pixels in the level2.evt file, extra rows are filled as -1
| Pixel properties | Quadrant properties | ||||||
|---|---|---|---|---|---|---|---|
| Quadrant | DetID | PixID | Counts | Sigma | Mean | Median | Sigma |
| A | 12 | 17 | 419823 | 2329.82 | 717 | 700 | 179.9 |
| A | 12 | 80 | 318345 | 1765.73 | 717 | 700 | 179.9 |
| A | 15 | 174 | 93430 | 515.47 | 717 | 700 | 179.9 |
| B | 10 | 254 | 2769857 | 19408.71 | 669 | 646 | 142.7 |
| B | 1 | 223 | 199228 | 1391.81 | 669 | 646 | 142.7 |
| B | 0 | 213 | 111691 | 778.29 | 669 | 646 | 142.7 |
| C | 3 | 233 | 354591 | 1845.68 | 689 | 678 | 191.8 |
| C | 7 | 80 | 278184 | 1447.21 | 689 | 678 | 191.8 |
| C | 15 | 224 | 220980 | 1148.89 | 689 | 678 | 191.8 |
| D | 15 | 125 | 2863921 | 16612.86 | 598 | 571 | 172.4 |
| D | 8 | 176 | 1863342 | 10807.6 | 598 | 571 | 172.4 |
| D | 9 | 49 | 861853 | 4997.07 | 598 | 571 | 172.4 |
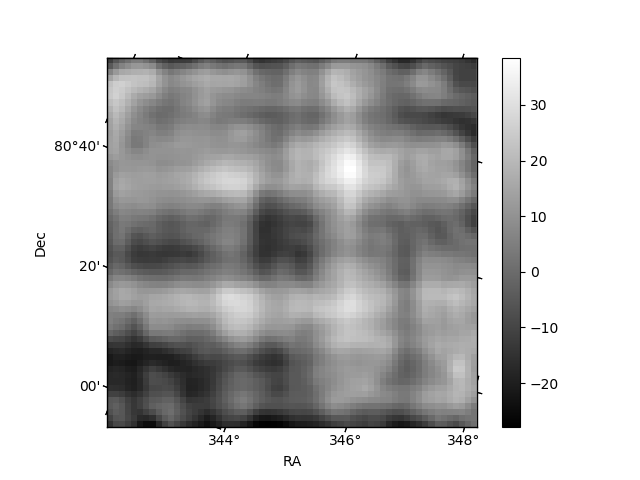
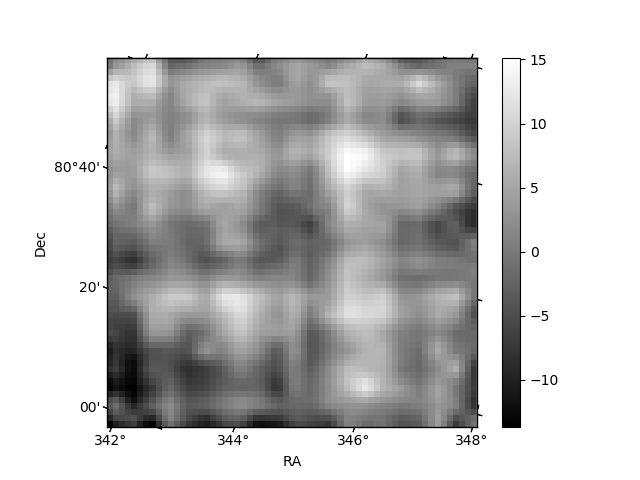
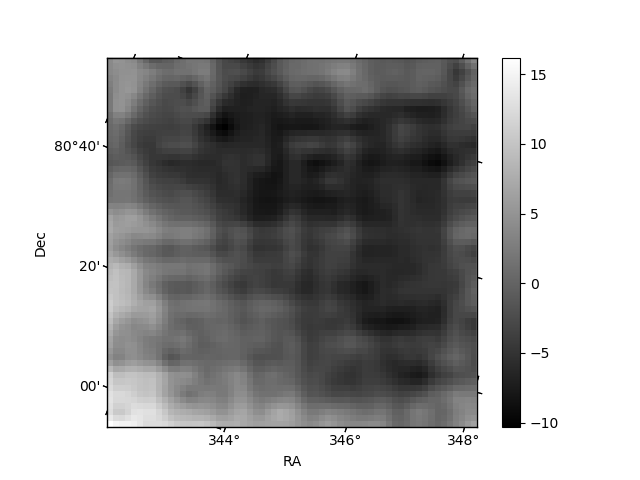
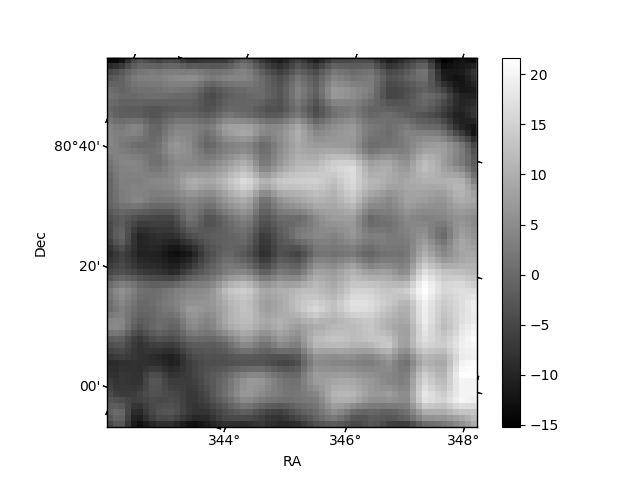
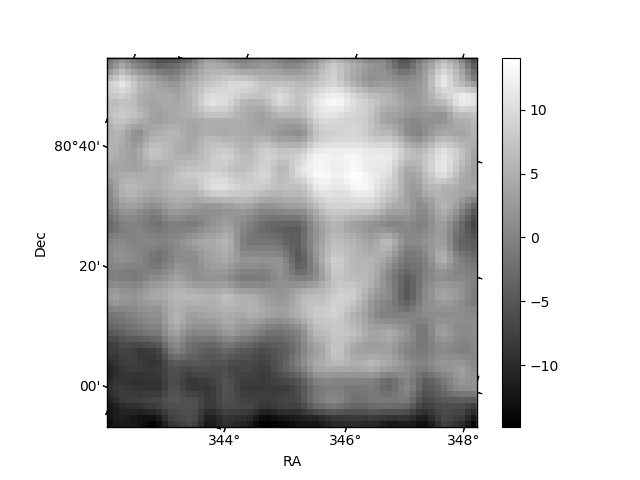
Histogram calculated using DETX and DETY for each event in the final _common_clean file
| Quadrant A | 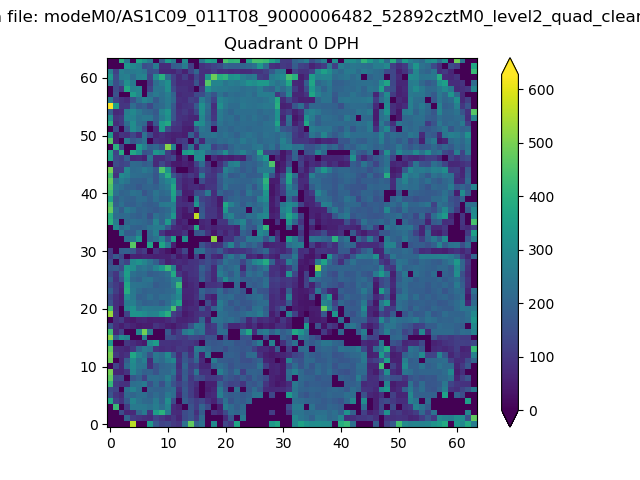 |
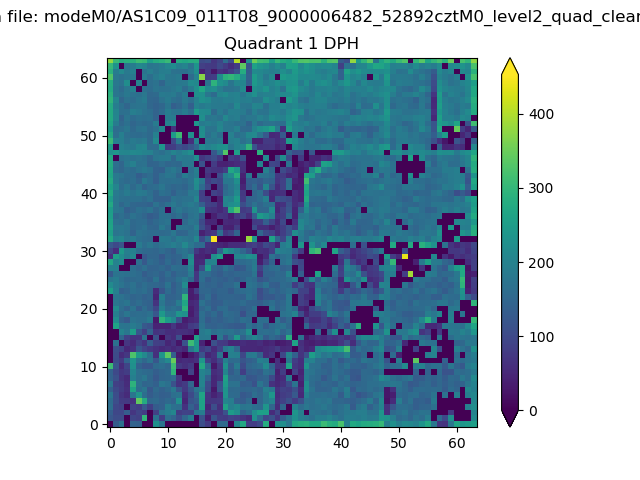 |
Quadrant B |
|---|---|---|---|
| Quadrant D | 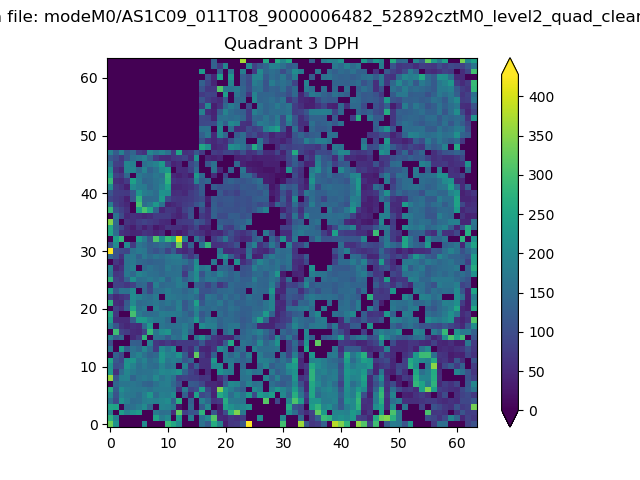 |
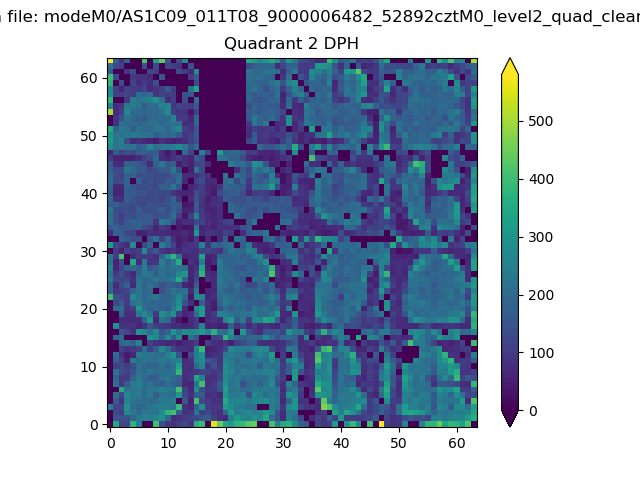 |
Quadrant C |
| Plot type | Count rate plots | Images |
|---|---|---|
| Comparison with Poisson distribution Blue bars denote a histogram of data divided into 1 sec bins. Red curve is a Poisson curve with rate = median count rate of data. |
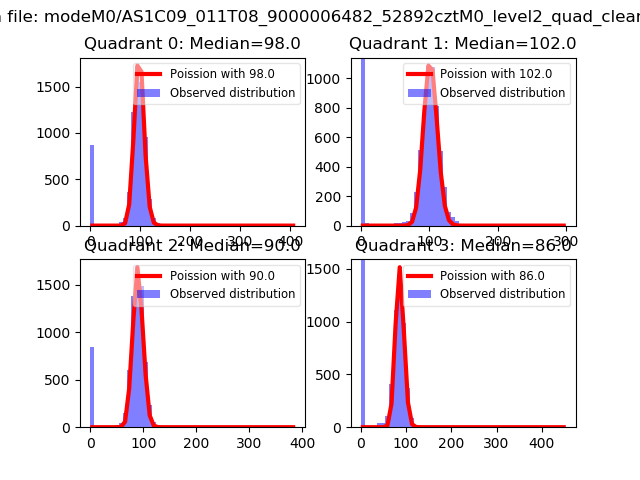 |
 |
| Quadrant-wise count rates Data is divided into 100 sec bins |
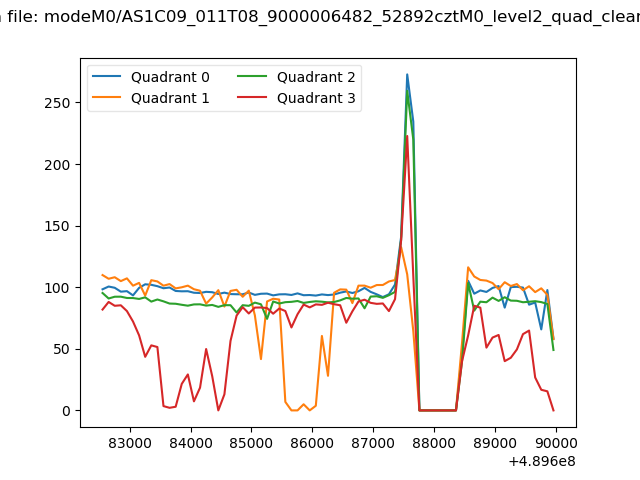 |
|
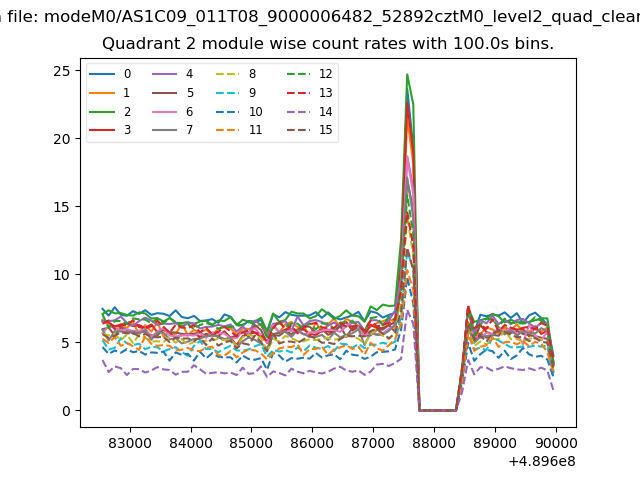
| Module-wise count rates for Quadrant A Data is divided into 100 sec bins |
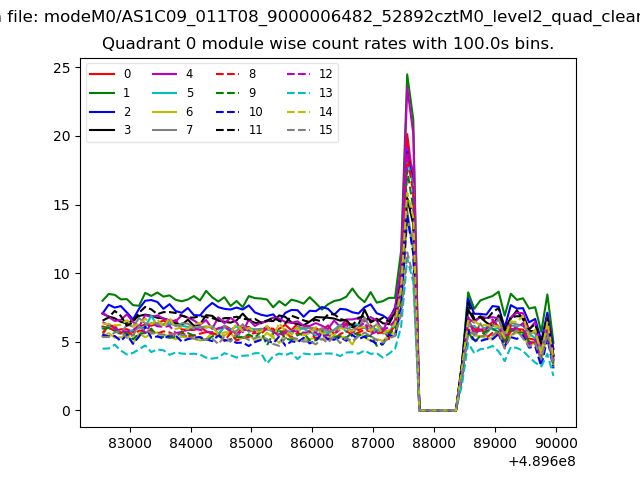 |
 |
| Module-wise count rates for Quadrant B Data is divided into 100 sec bins |
 |
 |
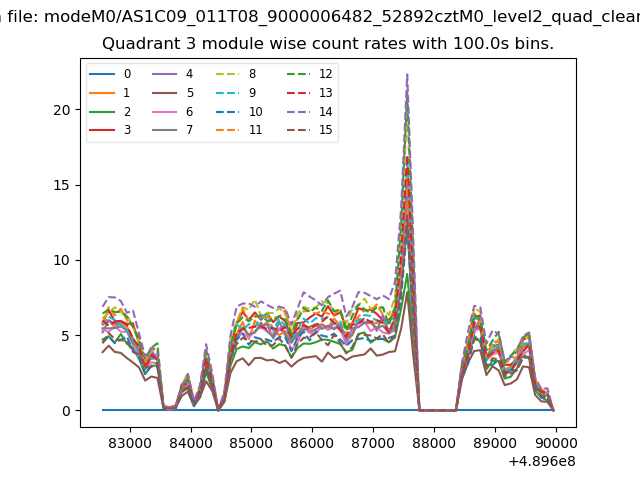
| Module-wise count rates for Quadrant C Data is divided into 100 sec bins |
 |
 |
| Module-wise count rates for Quadrant D Data is divided into 100 sec bins |
 |
 |
| Parameter | Plot |
|---|---|
| CZT HV Monitor | 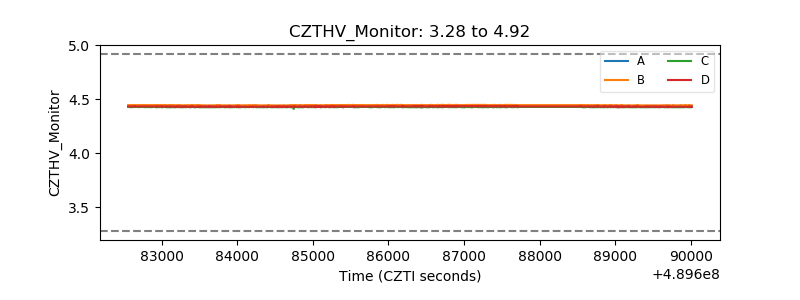 |
| D_VDD | 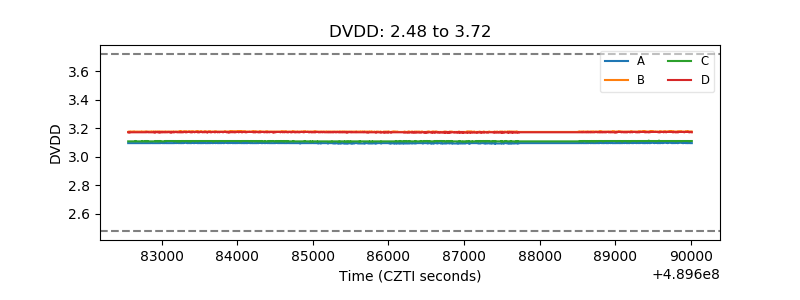 |
| Temperature 1 | 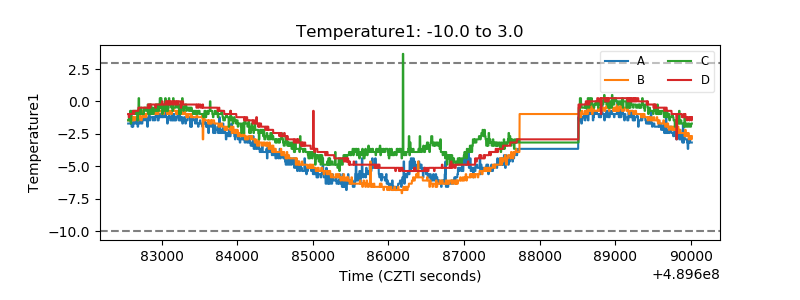 |
| Veto HV Monitor | 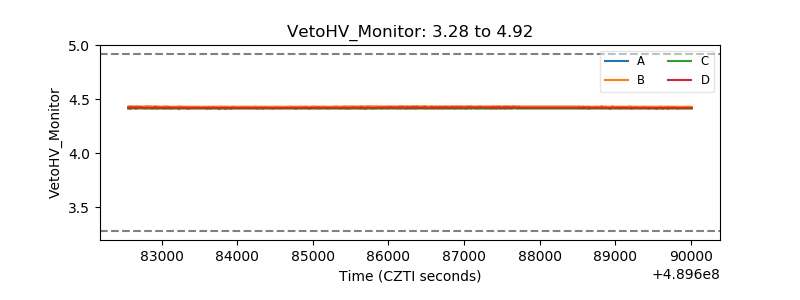 |
| Veto LLD | 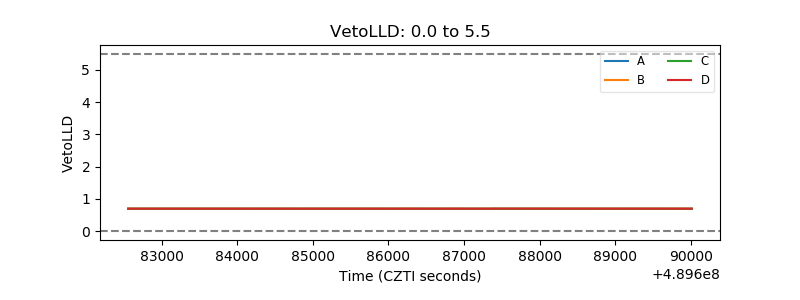 |
| Alpha Counter | 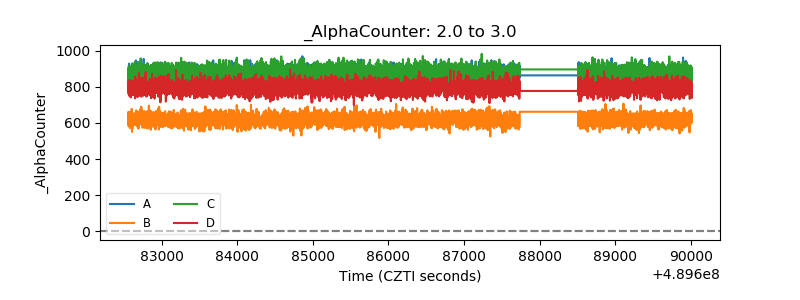 |
| _CPM_Rate | 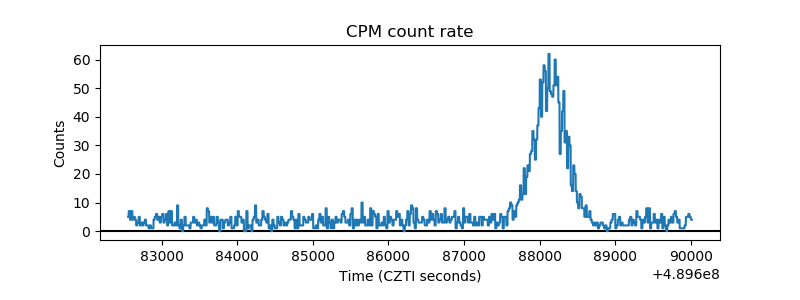 |
| CZT Counter | 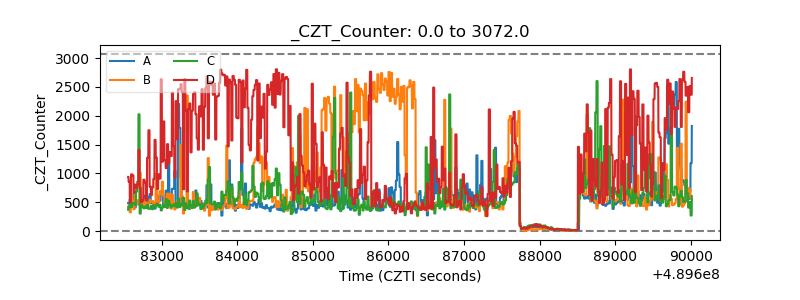 |
| +2.5 Volts monitor |  |
| +5 Volts monitor |  |
| _ROLL_ROT | 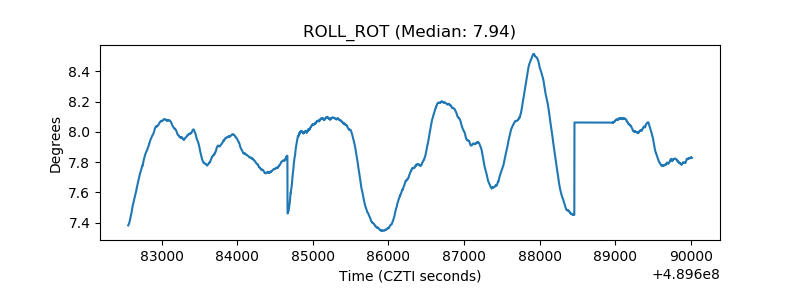 |
| _Roll_DEC | 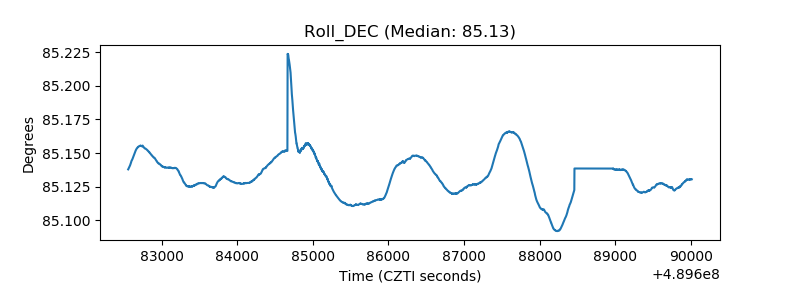 |
| _Roll_RA | 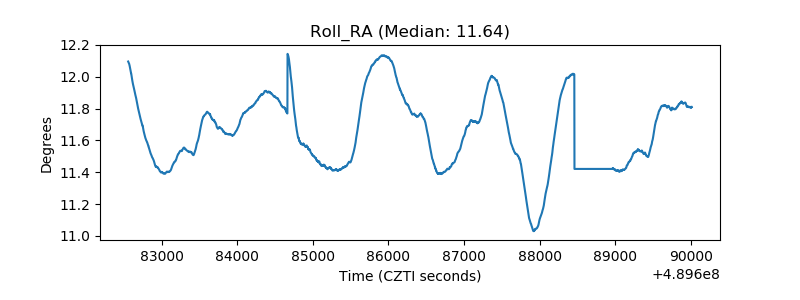 |
| Veto Counter | 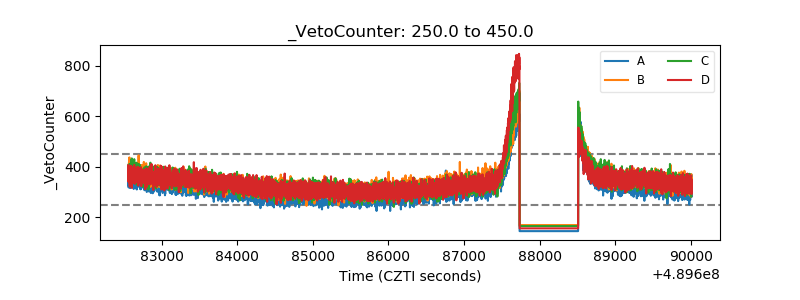 |