| Param | Original file | Final file |
|---|---|---|
| Filename | modeM0/AS1C09_011T08_9000006482_52893cztM0_level2.fits | modeM0/AS1C09_011T08_9000006482_52893cztM0_level2_quad_clean.evt |
| Size (bytes) | 734,774,400 | 97,413,120 |
| Size | 700.7 MB | 92.9 MB |
| Events in quadrant A | 8,015,480 | 544,486 |
| Events in quadrant B | 5,117,175 | 717,301 |
| Events in quadrant C | 4,859,205 | 652,421 |
| Events in quadrant D | 8,645,134 | 529,857 |
| Mode M0 | |||
|---|---|---|---|
| Quadrant | BADHDUFLAG | Total packets | Discarded packets |
| A | 0 | 28841 | 6 |
| B | 0 | 20348 | 1 |
| C | 0 | 19518 | 1 |
| D | 0 | 30768 | 1 |
| Mode M9 | |||
|---|---|---|---|
| Quadrant | BADHDUFLAG | Total packets | Discarded packets |
| A | 0 | 1 | 0 |
| B | 0 | 1 | 0 |
| C | 0 | 1 | 0 |
| D | 0 | 1 | 0 |
| Mode SS | |||
|---|---|---|---|
| Quadrant | BADHDUFLAG | Total packets | Discarded packets |
| A | 0 | 146 | 0 |
| B | 0 | 146 | 0 |
| C | 0 | 146 | 0 |
| D | 0 | 146 | 0 |
| Quadrant | Total seconds | Saturated seconds | Saturation percentage |
|---|---|---|---|
| A | 7257 | 1684 | 23.205181% |
| B | 7257 | 408 | 5.622158% |
| C | 7258 | 223 | 3.072472% |
| D | 7258 | 1463 | 20.157068% |
Noise dominated data is calculated using 1-second bins in cleaned event files. If a bin has >2000 counts, and if more than 50% of those come from <1% of pixels, then it is considered to be noise-dominated and hence unusable.
| Quadrant | # 1 sec bins | Bins with >0 counts | Bins with >2000 counts | High rate bins dominated by noise | Noise dominated (total time) | Noise dominated (detector-on time) | Marked lightcurve |
|---|---|---|---|---|---|---|---|
| A | 7307 | 7257 | 1477 | 1477 | 20.21% | 20.35% | 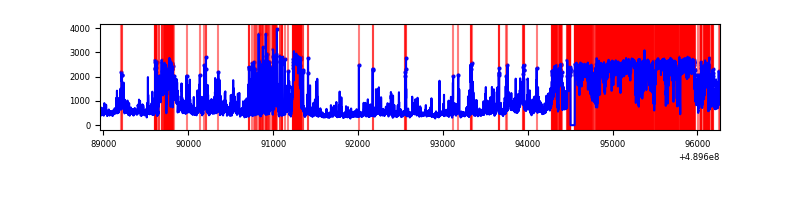 |
| B | 7306 | 7256 | 263 | 263 | 3.60% | 3.62% | 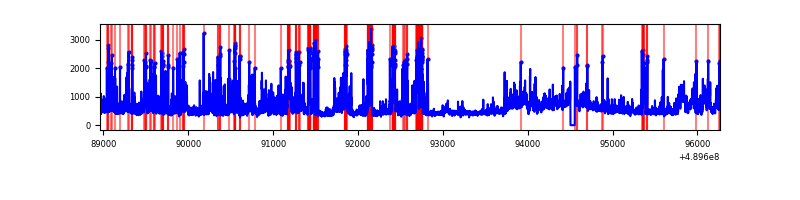 |
| C | 7308 | 7259 | 208 | 208 | 2.85% | 2.87% | 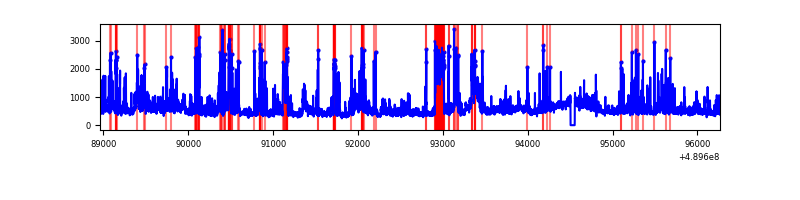 |
| D | 7307 | 7258 | 1323 | 1323 | 18.11% | 18.23% | 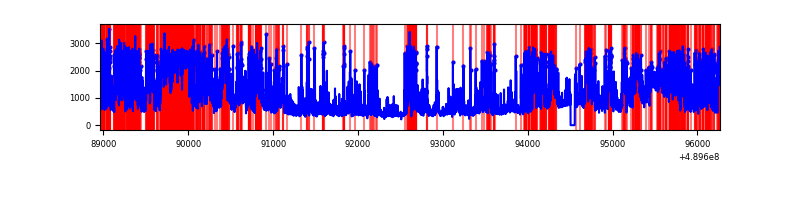 |
Top three noisy pixels from each quadrant. If the there are fewer than three noisy pixels in the level2.evt file, extra rows are filled as -1
| Pixel properties | Quadrant properties | ||||||
|---|---|---|---|---|---|---|---|
| Quadrant | DetID | PixID | Counts | Sigma | Mean | Median | Sigma |
| A | 9 | 191 | 3312838 | 19178.81 | 686 | 666 | 172.7 |
| A | 12 | 80 | 536595 | 3103.24 | 686 | 666 | 172.7 |
| A | 12 | 17 | 418923 | 2421.88 | 686 | 666 | 172.7 |
| B | 10 | 254 | 475798 | 2965.08 | 761 | 733 | 160.2 |
| B | 1 | 255 | 425408 | 2650.57 | 761 | 733 | 160.2 |
| B | 5 | 185 | 337438 | 2101.52 | 761 | 733 | 160.2 |
| C | 7 | 80 | 708908 | 3402.14 | 757 | 748 | 208.2 |
| C | 13 | 3 | 332855 | 1595.51 | 757 | 748 | 208.2 |
| C | 15 | 224 | 205500 | 983.67 | 757 | 748 | 208.2 |
| D | 8 | 176 | 2228415 | 10961.21 | 709 | 677 | 203.2 |
| D | 10 | 172 | 805897 | 3961.95 | 709 | 677 | 203.2 |
| D | 15 | 125 | 711069 | 3495.36 | 709 | 677 | 203.2 |
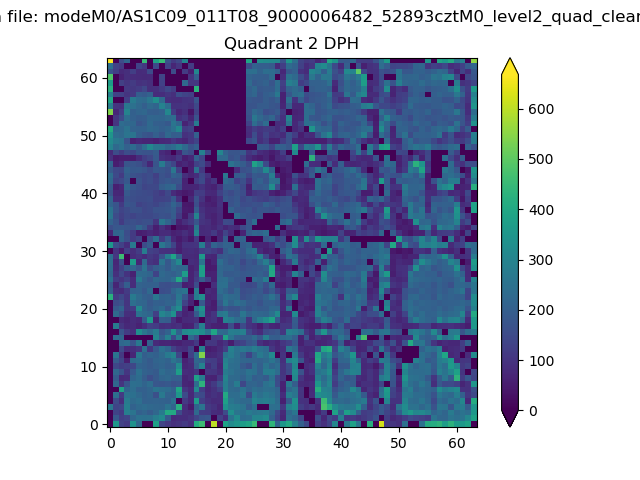
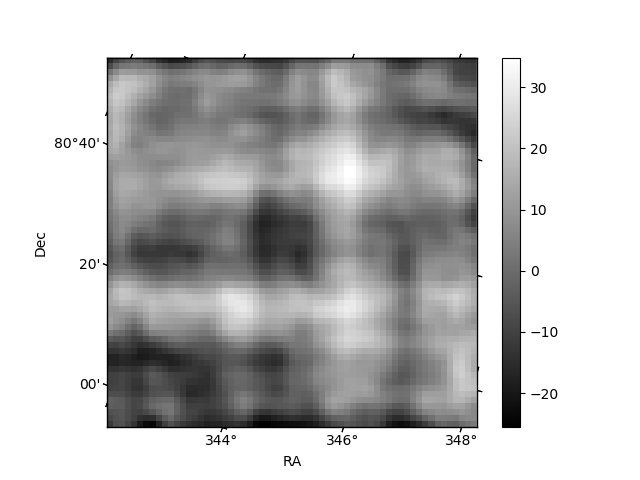
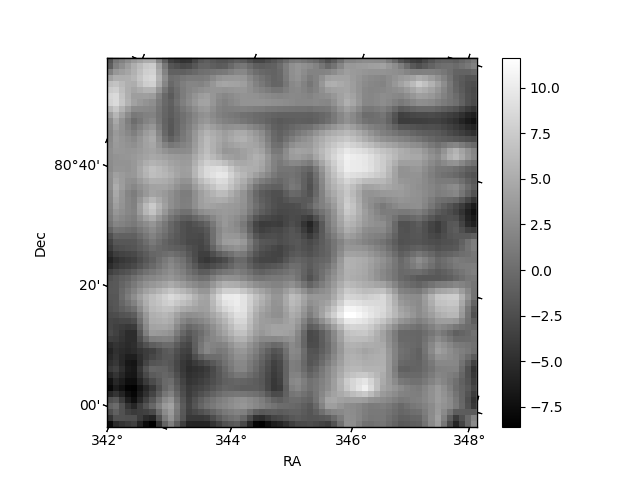
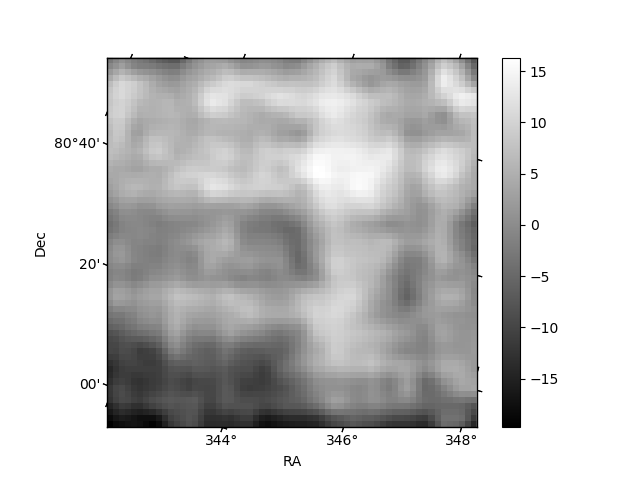
Histogram calculated using DETX and DETY for each event in the final _common_clean file
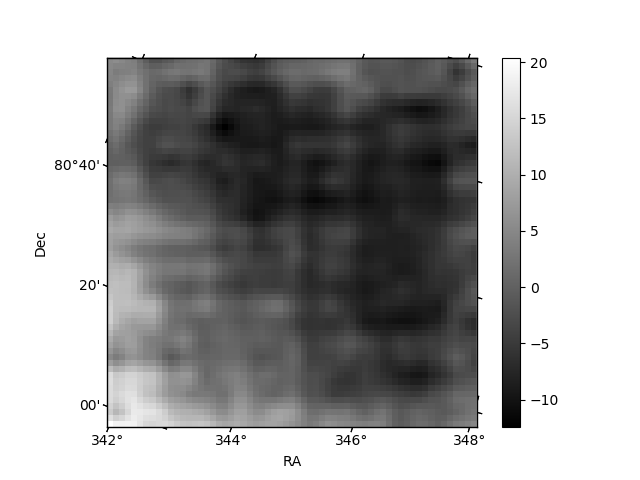
| Quadrant A | 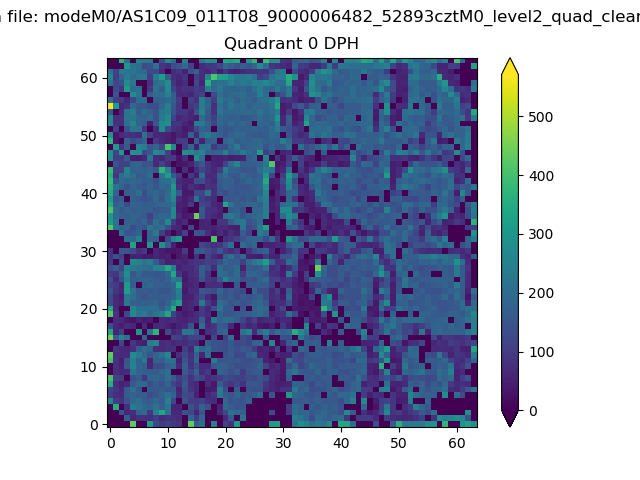 |
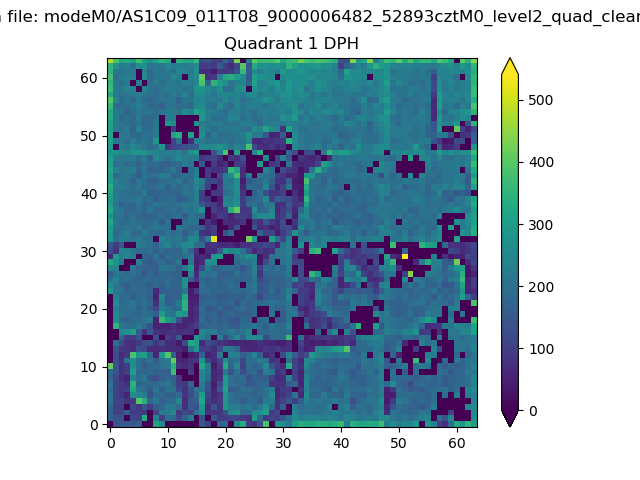 |
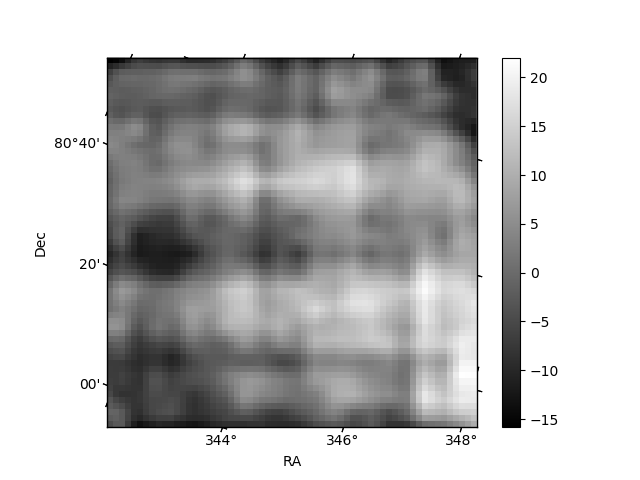
Quadrant B |
|---|---|---|---|
| Quadrant D | 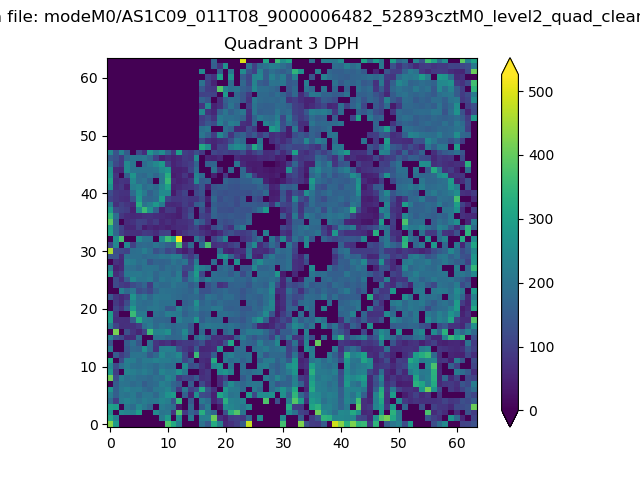 |
 |
Quadrant C |
| Plot type | Count rate plots | Images |
|---|---|---|
| Comparison with Poisson distribution Blue bars denote a histogram of data divided into 1 sec bins. Red curve is a Poisson curve with rate = median count rate of data. |
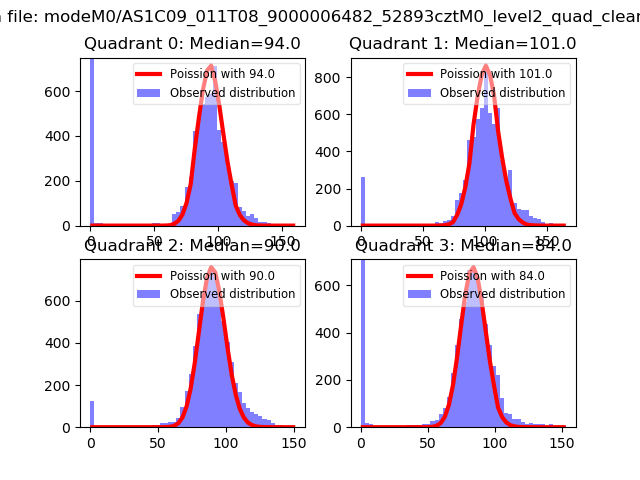 |
 |
| Quadrant-wise count rates Data is divided into 100 sec bins |
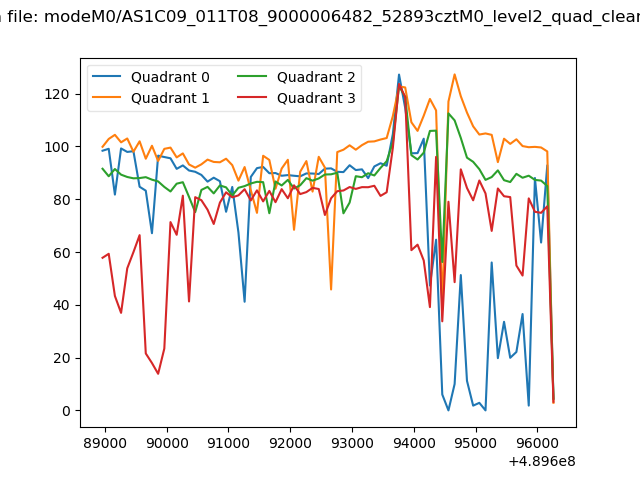 |
|
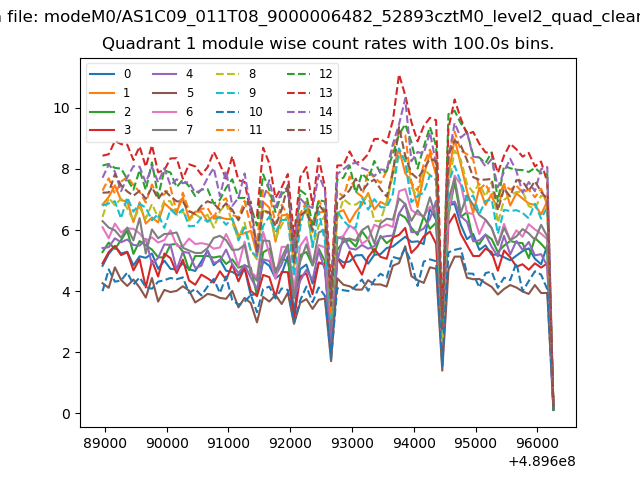
| Module-wise count rates for Quadrant A Data is divided into 100 sec bins |
 |
 |
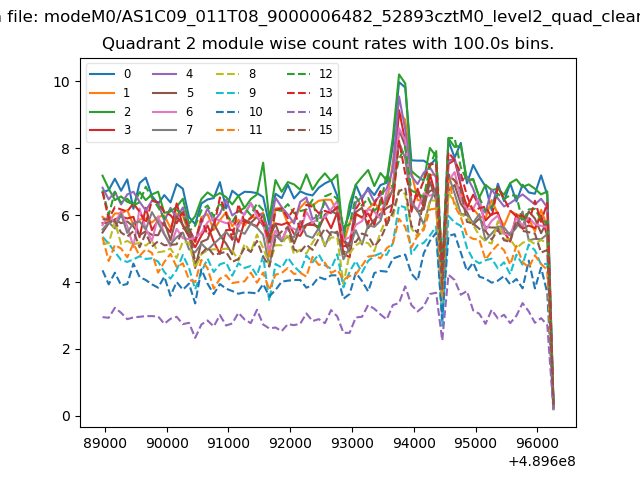
| Module-wise count rates for Quadrant B Data is divided into 100 sec bins |
 |
 |
| Module-wise count rates for Quadrant C Data is divided into 100 sec bins |
 |
 |
| Module-wise count rates for Quadrant D Data is divided into 100 sec bins |
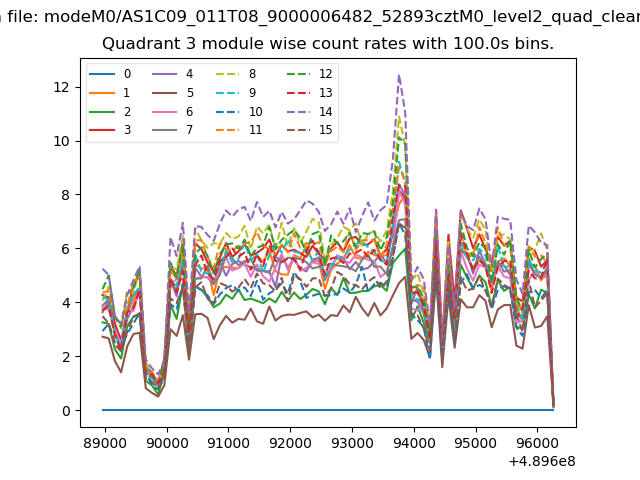 |
 |
| Parameter | Plot |
|---|---|
| CZT HV Monitor | 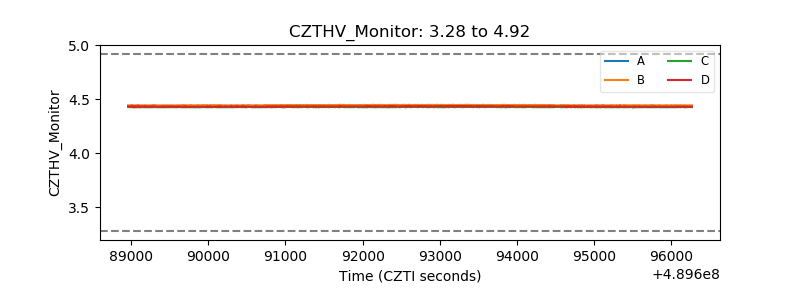 |
| D_VDD | 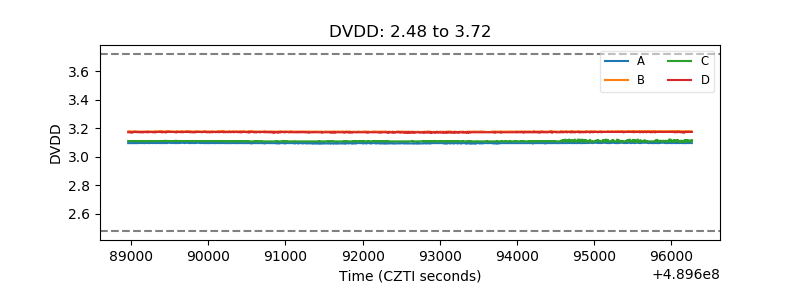 |
| Temperature 1 | 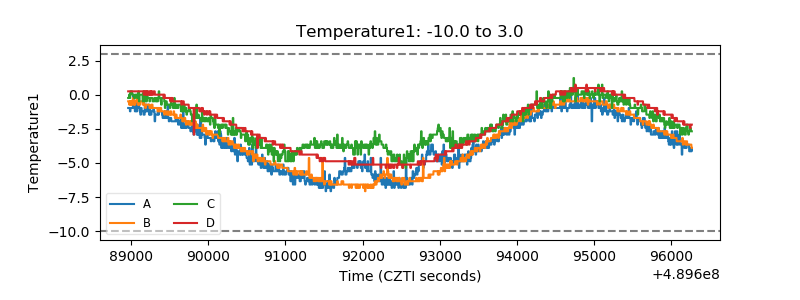 |
| Veto HV Monitor | 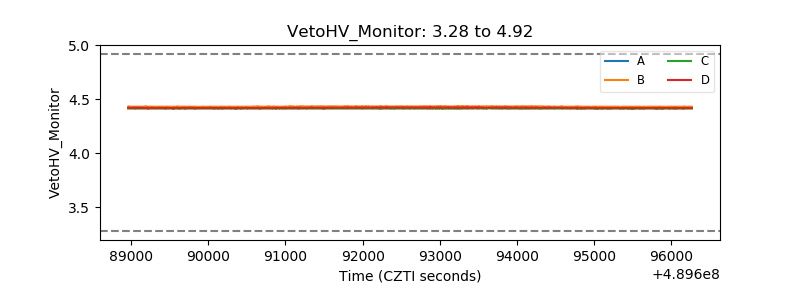 |
| Veto LLD | 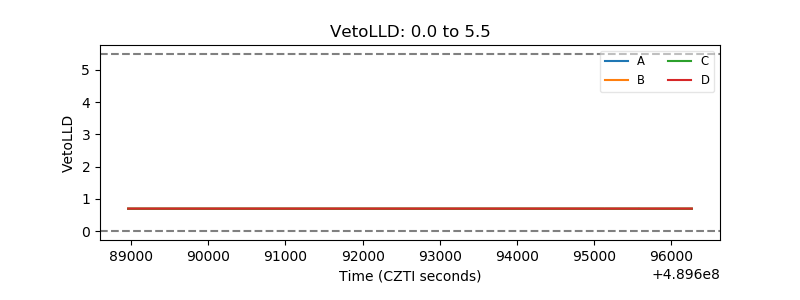 |
| Alpha Counter | 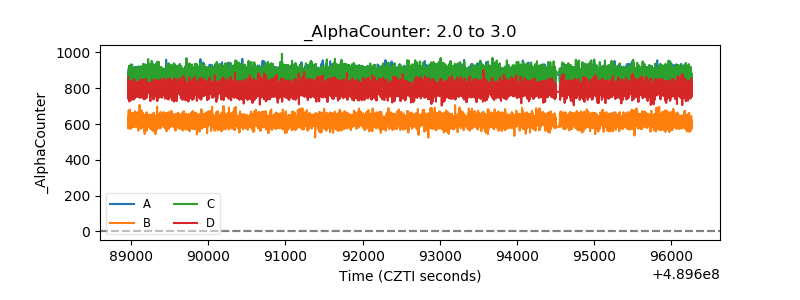 |
| _CPM_Rate | 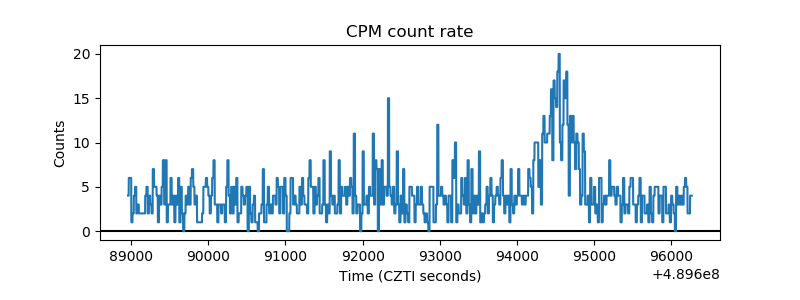 |
| CZT Counter | 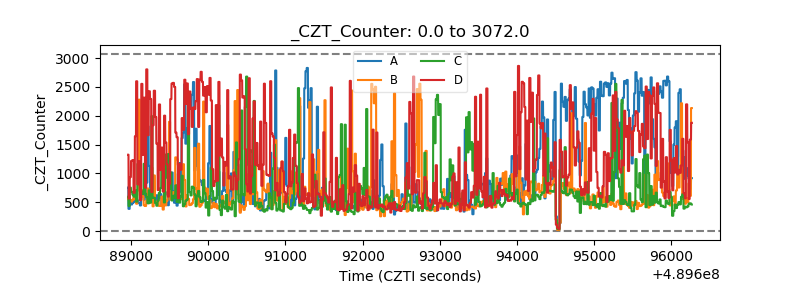 |
| +2.5 Volts monitor |  |
| +5 Volts monitor | 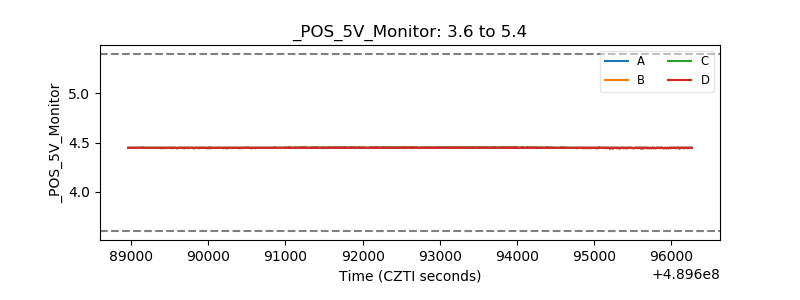 |
| _ROLL_ROT | 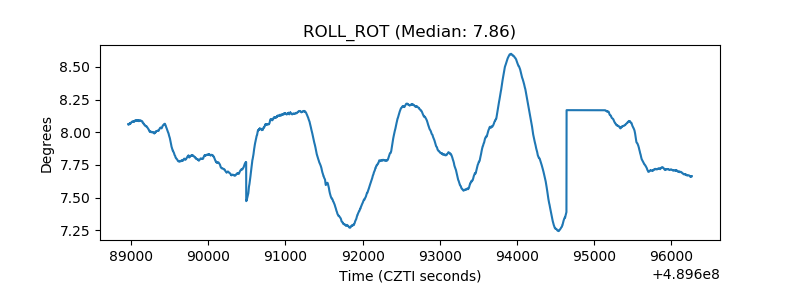 |
| _Roll_DEC | 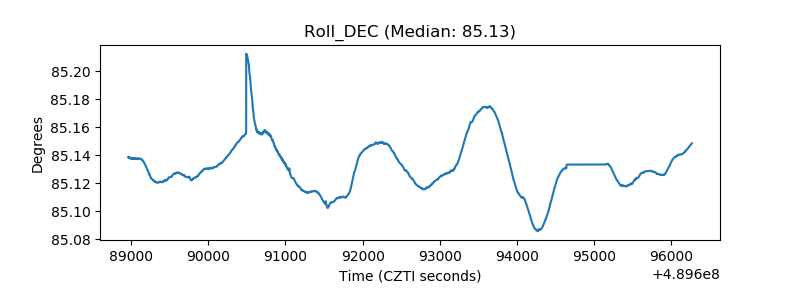 |
| _Roll_RA | 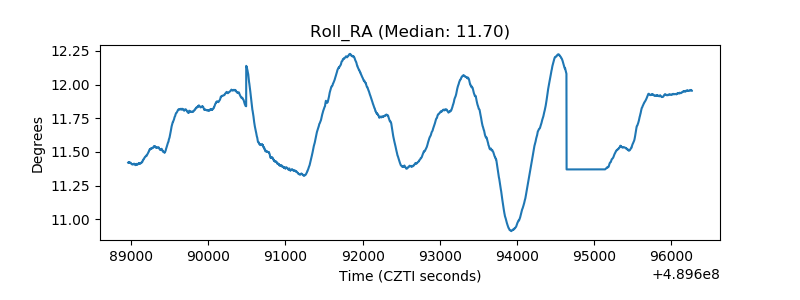 |
| Veto Counter | 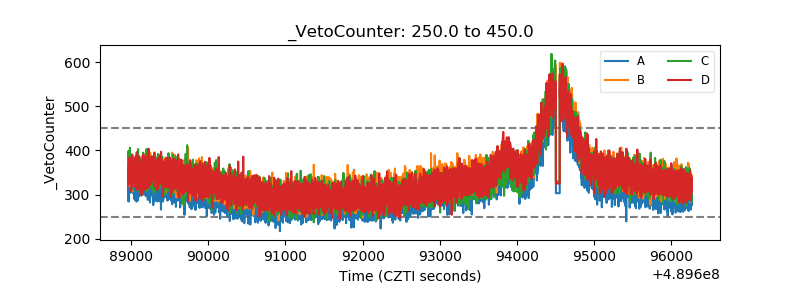 |