| Param | Original file | Final file |
|---|---|---|
| Filename | modeM0/AS1C09_011T08_9000006482_52894cztM0_level2.fits | modeM0/AS1C09_011T08_9000006482_52894cztM0_level2_quad_clean.evt |
| Size (bytes) | 955,226,880 | 90,423,360 |
| Size | 911.0 MB | 86.2 MB |
| Events in quadrant A | 12,946,200 | 355,282 |
| Events in quadrant B | 9,422,476 | 616,638 |
| Events in quadrant C | 5,102,289 | 658,595 |
| Events in quadrant D | 7,310,386 | 585,979 |
| Mode M0 | |||
|---|---|---|---|
| Quadrant | BADHDUFLAG | Total packets | Discarded packets |
| A | 0 | 43560 | 0 |
| B | 0 | 33150 | 0 |
| C | 0 | 20300 | 0 |
| D | 0 | 27006 | 0 |
| Mode SS | |||
|---|---|---|---|
| Quadrant | BADHDUFLAG | Total packets | Discarded packets |
| A | 0 | 150 | 0 |
| B | 0 | 150 | 0 |
| C | 0 | 150 | 0 |
| D | 0 | 150 | 0 |
| Quadrant | Total seconds | Saturated seconds | Saturation percentage |
|---|---|---|---|
| A | 7483 | 3973 | 53.093679% |
| B | 7484 | 1706 | 22.795297% |
| C | 7484 | 190 | 2.538749% |
| D | 7484 | 897 | 11.985569% |
Noise dominated data is calculated using 1-second bins in cleaned event files. If a bin has >2000 counts, and if more than 50% of those come from <1% of pixels, then it is considered to be noise-dominated and hence unusable.
| Quadrant | # 1 sec bins | Bins with >0 counts | Bins with >2000 counts | High rate bins dominated by noise | Noise dominated (total time) | Noise dominated (detector-on time) | Marked lightcurve |
|---|---|---|---|---|---|---|---|
| A | 7482 | 7482 | 3699 | 3699 | 49.44% | 49.44% | 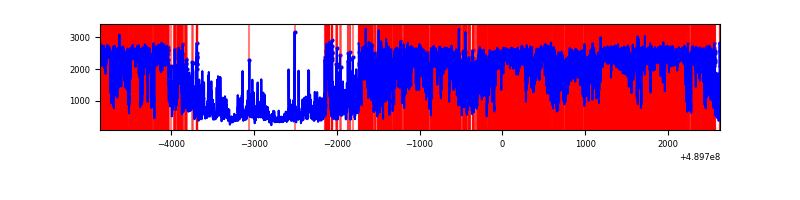 |
| B | 7484 | 7484 | 1554 | 1554 | 20.76% | 20.76% | 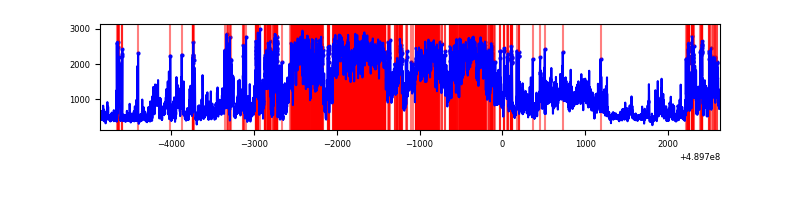 |
| C | 7484 | 7484 | 163 | 163 | 2.18% | 2.18% | 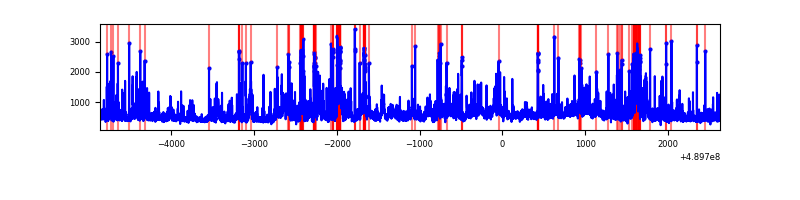 |
| D | 7484 | 7484 | 836 | 836 | 11.17% | 11.17% | 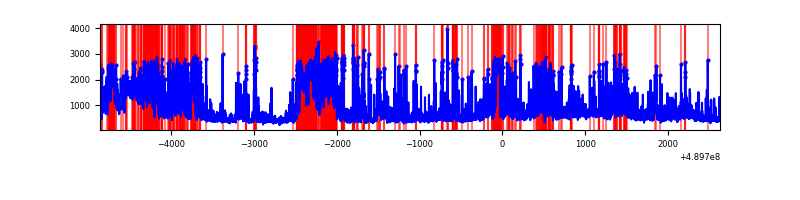 |
Top three noisy pixels from each quadrant. If the there are fewer than three noisy pixels in the level2.evt file, extra rows are filled as -1
| Pixel properties | Quadrant properties | ||||||
|---|---|---|---|---|---|---|---|
| Quadrant | DetID | PixID | Counts | Sigma | Mean | Median | Sigma |
| A | 9 | 191 | 9930951 | 67769.89 | 580 | 566 | 146.5 |
| A | 15 | 174 | 128333 | 871.95 | 580 | 566 | 146.5 |
| A | 12 | 80 | 105799 | 718.16 | 580 | 566 | 146.5 |
| B | 10 | 254 | 4485020 | 28801.07 | 735 | 711 | 155.7 |
| B | 1 | 255 | 1492476 | 9581.06 | 735 | 711 | 155.7 |
| B | 4 | 81 | 82507 | 525.35 | 735 | 711 | 155.7 |
| C | 7 | 80 | 641523 | 3042.22 | 762 | 753 | 210.6 |
| C | 15 | 224 | 320288 | 1517.07 | 762 | 753 | 210.6 |
| C | 12 | 2 | 199358 | 942.93 | 762 | 753 | 210.6 |
| D | 8 | 176 | 2108246 | 9915.94 | 737 | 703 | 212.5 |
| D | 10 | 172 | 574631 | 2700.32 | 737 | 703 | 212.5 |
| D | 2 | 249 | 334582 | 1570.89 | 737 | 703 | 212.5 |
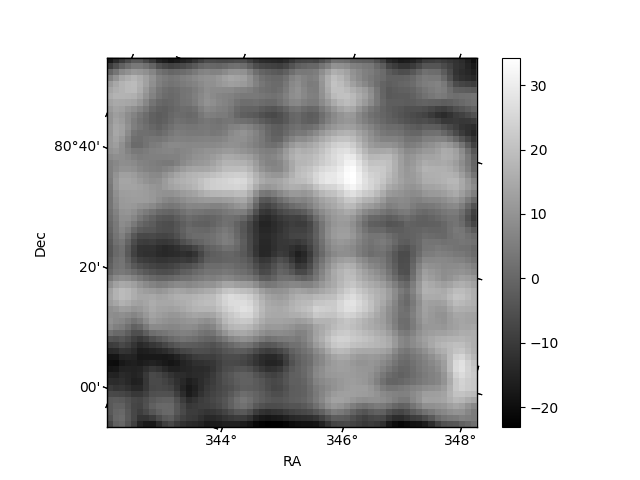
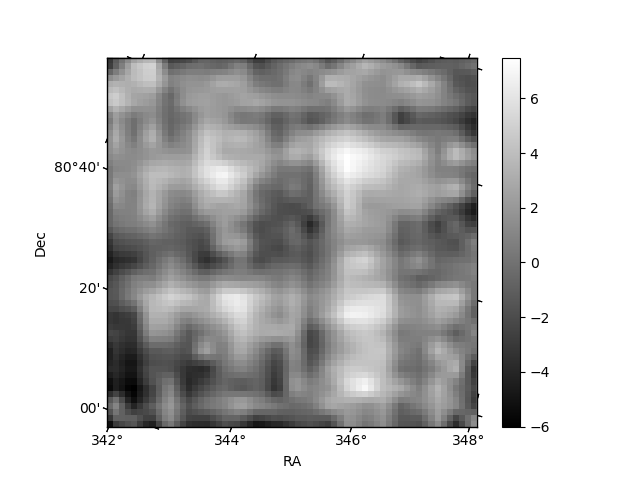
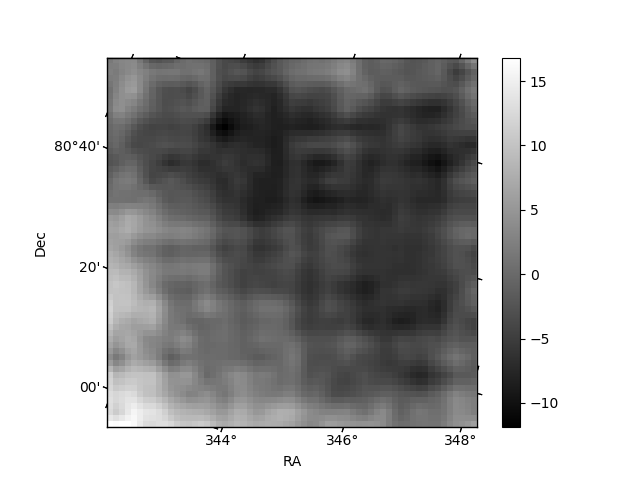
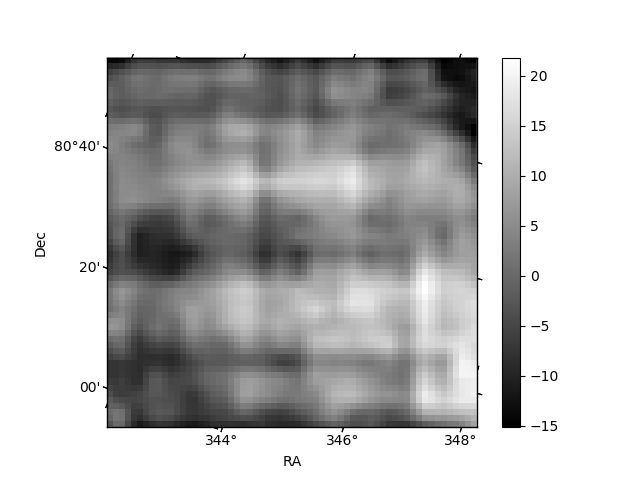
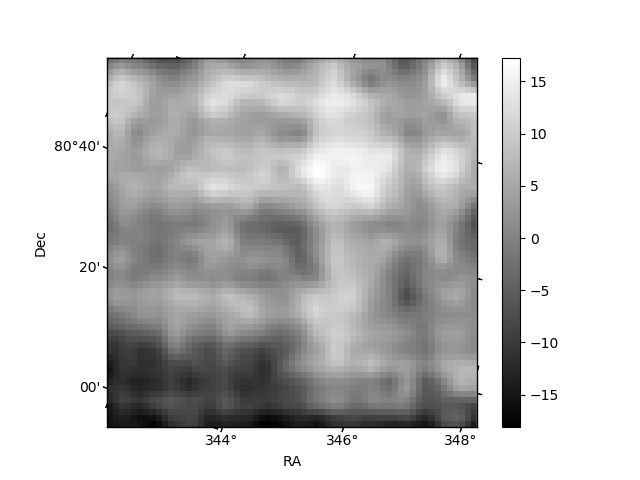
Histogram calculated using DETX and DETY for each event in the final _common_clean file
| Quadrant A | 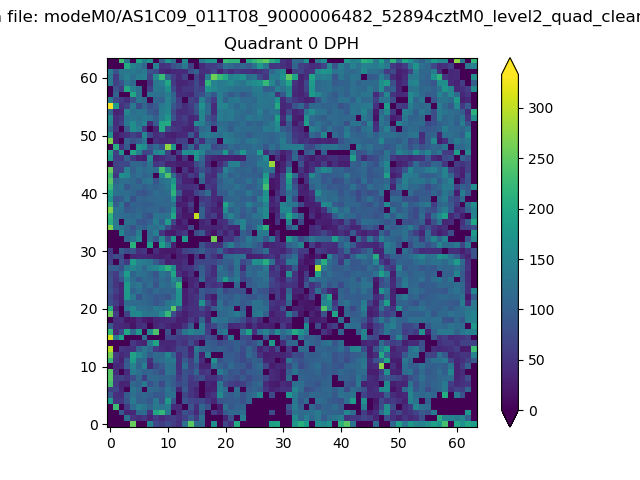 |
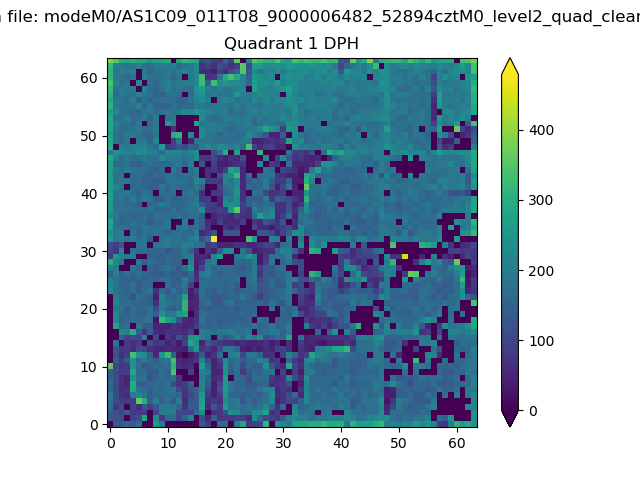 |
Quadrant B |
|---|---|---|---|
| Quadrant D | 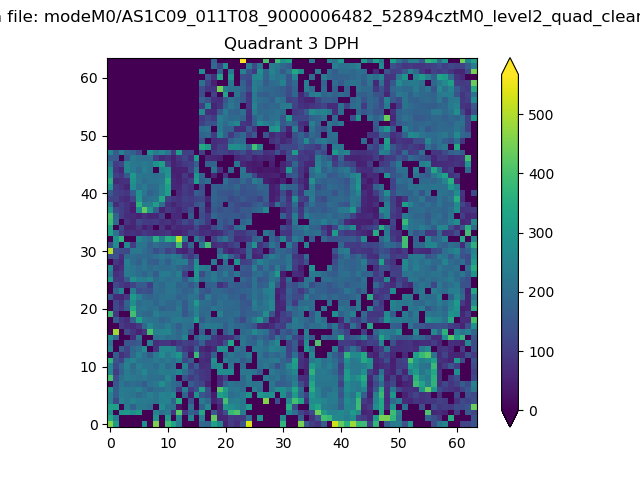 |
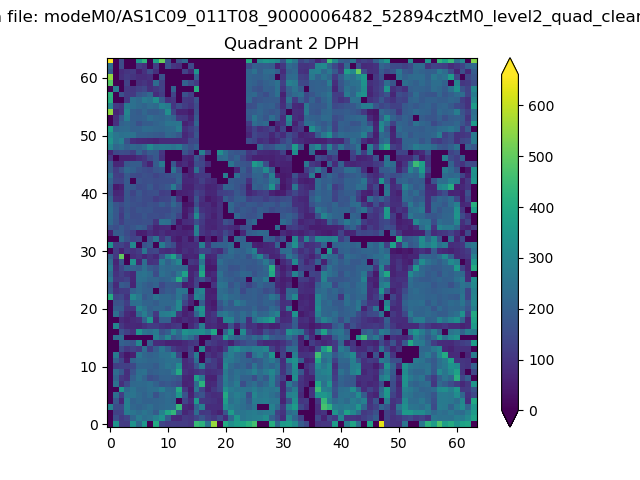 |
Quadrant C |
| Plot type | Count rate plots | Images |
|---|---|---|
| Comparison with Poisson distribution Blue bars denote a histogram of data divided into 1 sec bins. Red curve is a Poisson curve with rate = median count rate of data. |
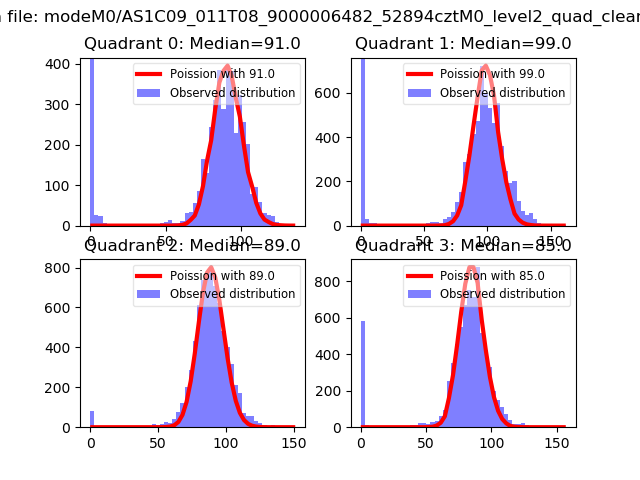 |
 |
| Quadrant-wise count rates Data is divided into 100 sec bins |
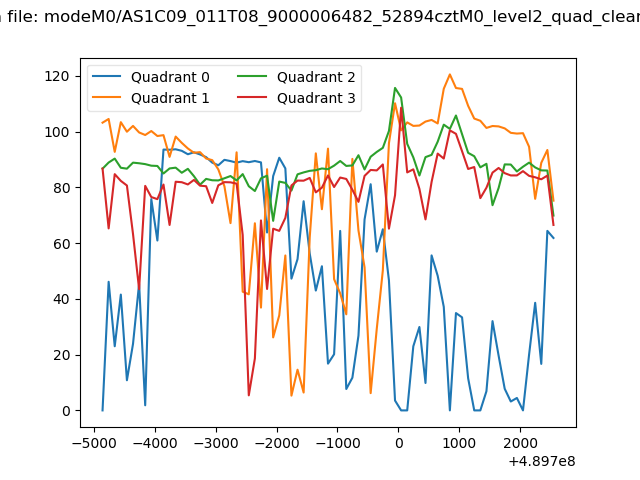 |
|
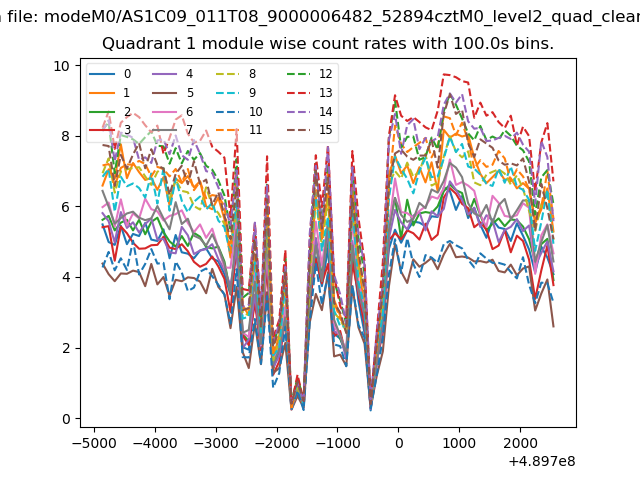
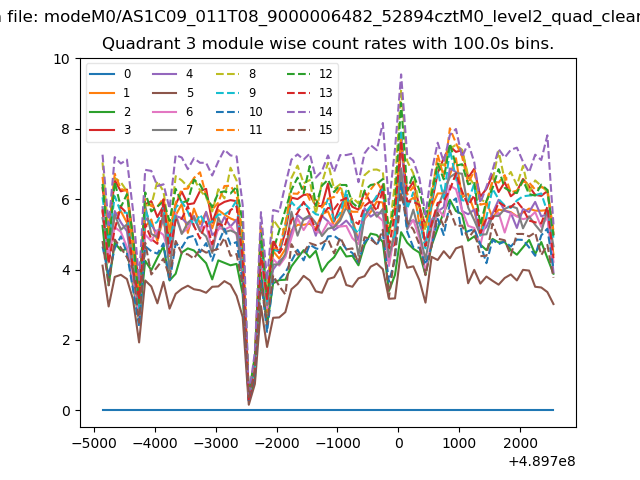
| Module-wise count rates for Quadrant A Data is divided into 100 sec bins |
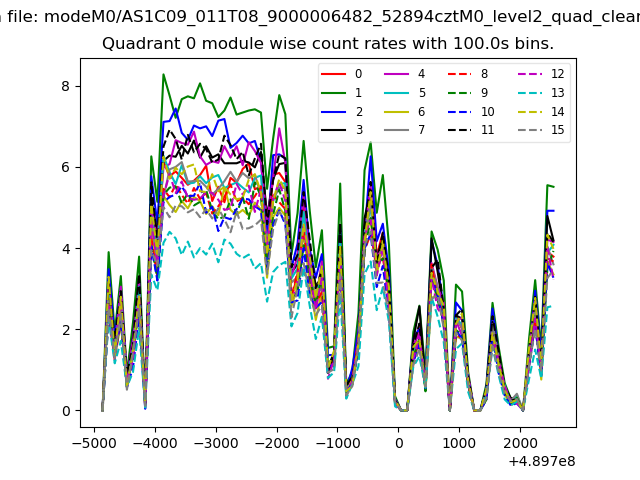 |
 |
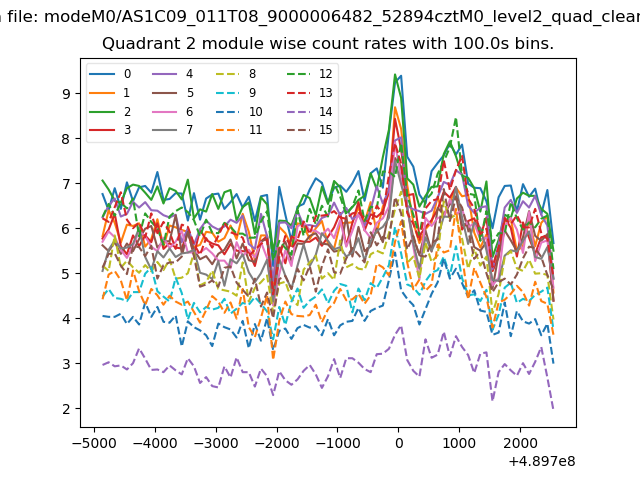
| Module-wise count rates for Quadrant B Data is divided into 100 sec bins |
 |
 |
| Module-wise count rates for Quadrant C Data is divided into 100 sec bins |
 |
 |
| Module-wise count rates for Quadrant D Data is divided into 100 sec bins |
 |
 |
| Parameter | Plot |
|---|---|
| CZT HV Monitor |  |
| D_VDD | 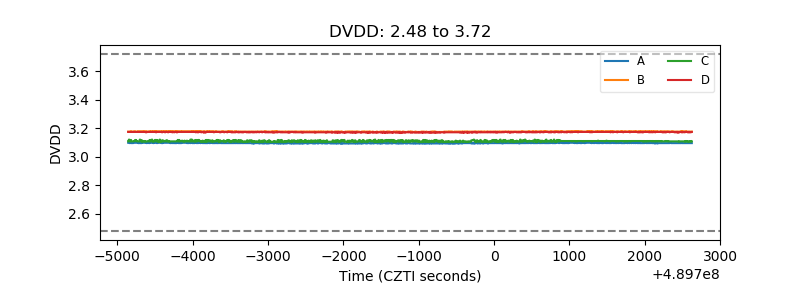 |
| Temperature 1 | 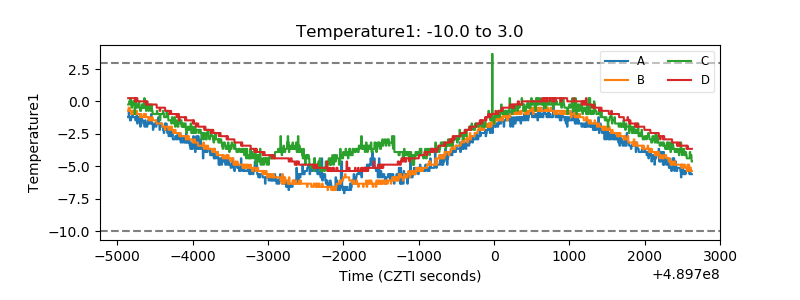 |
| Veto HV Monitor | 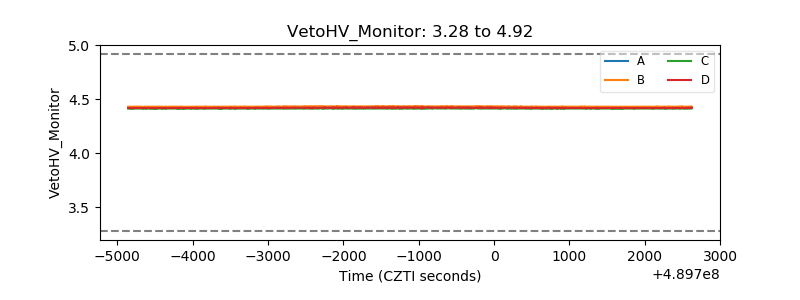 |
| Veto LLD | 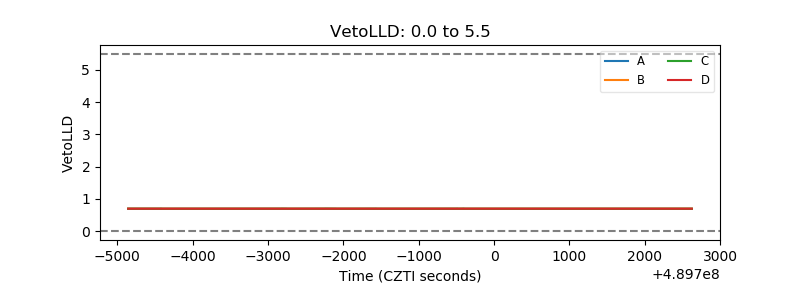 |
| Alpha Counter | 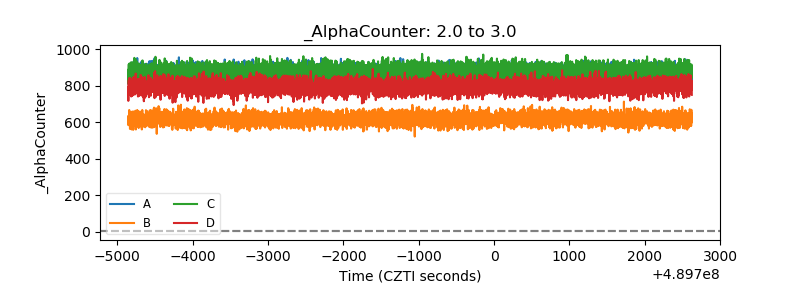 |
| _CPM_Rate | 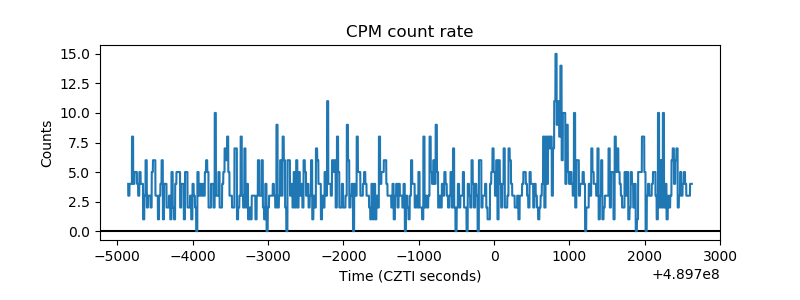 |
| CZT Counter | 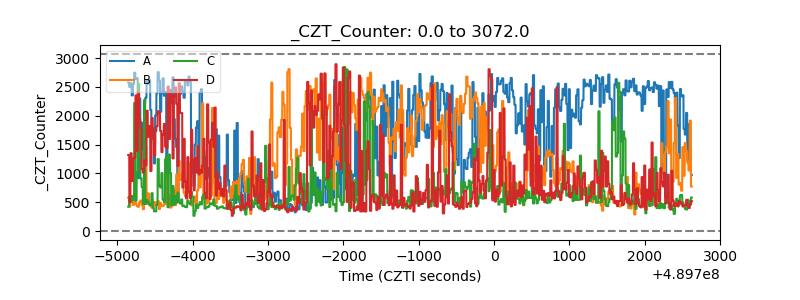 |
| +2.5 Volts monitor | 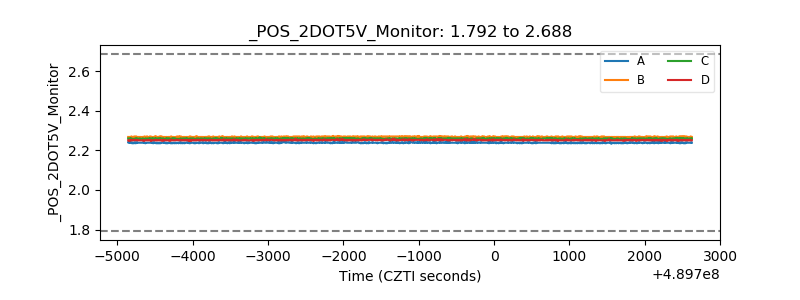 |
| +5 Volts monitor |  |
| _ROLL_ROT | 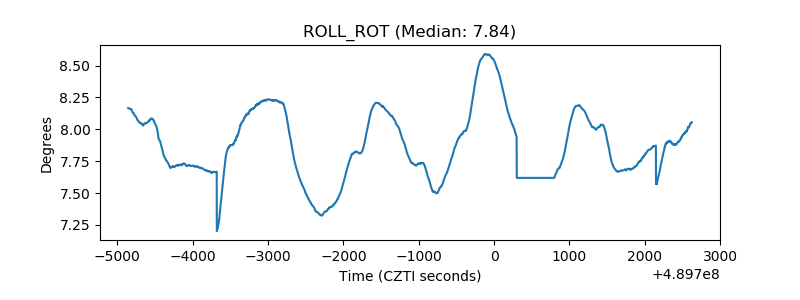 |
| _Roll_DEC | 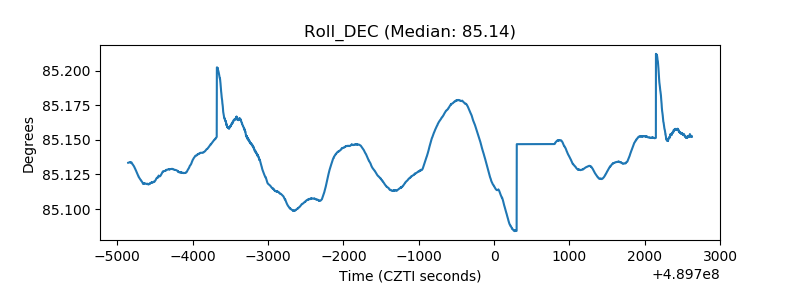 |
| _Roll_RA | 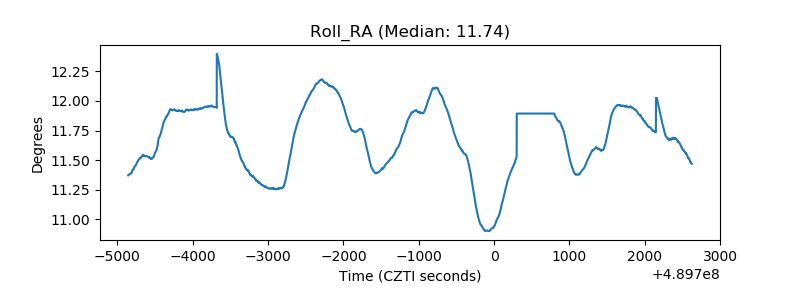 |
| Veto Counter | 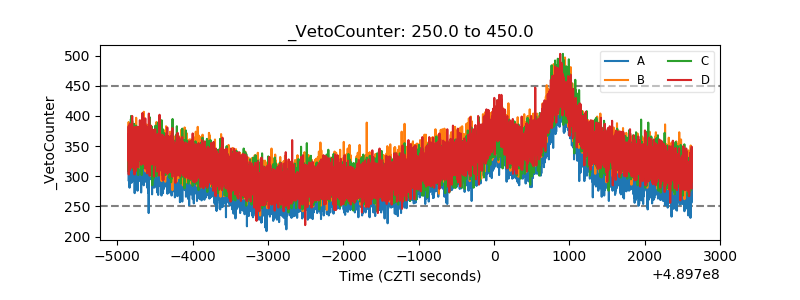 |