| Param | Original file | Final file |
|---|---|---|
| Filename | modeM0/AS1C09_011T08_9000006482_52895cztM0_level2.fits | modeM0/AS1C09_011T08_9000006482_52895cztM0_level2_quad_clean.evt |
| Size (bytes) | 973,339,200 | 99,331,200 |
| Size | 928.2 MB | 94.7 MB |
| Events in quadrant A | 15,927,624 | 295,493 |
| Events in quadrant B | 5,729,116 | 813,111 |
| Events in quadrant C | 6,615,472 | 681,015 |
| Events in quadrant D | 7,129,405 | 652,835 |
| Mode M0 | |||
|---|---|---|---|
| Quadrant | BADHDUFLAG | Total packets | Discarded packets |
| A | 0 | 52767 | 3 |
| B | 0 | 22690 | 0 |
| C | 0 | 25358 | 0 |
| D | 0 | 26850 | 0 |
| Mode SS | |||
|---|---|---|---|
| Quadrant | BADHDUFLAG | Total packets | Discarded packets |
| A | 0 | 164 | 0 |
| B | 0 | 164 | 0 |
| C | 0 | 164 | 0 |
| D | 0 | 164 | 0 |
| Quadrant | Total seconds | Saturated seconds | Saturation percentage |
|---|---|---|---|
| A | 8122 | 5209 | 64.134450% |
| B | 8122 | 272 | 3.348929% |
| C | 8122 | 689 | 8.483132% |
| D | 8122 | 788 | 9.702044% |
Noise dominated data is calculated using 1-second bins in cleaned event files. If a bin has >2000 counts, and if more than 50% of those come from <1% of pixels, then it is considered to be noise-dominated and hence unusable.
| Quadrant | # 1 sec bins | Bins with >0 counts | Bins with >2000 counts | High rate bins dominated by noise | Noise dominated (total time) | Noise dominated (detector-on time) | Marked lightcurve |
|---|---|---|---|---|---|---|---|
| A | 8122 | 8122 | 5035 | 5035 | 61.99% | 61.99% | 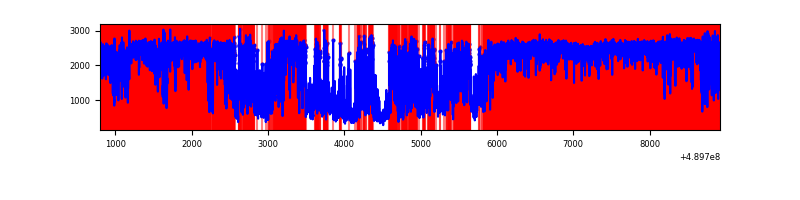 |
| B | 8122 | 8122 | 223 | 223 | 2.75% | 2.75% | 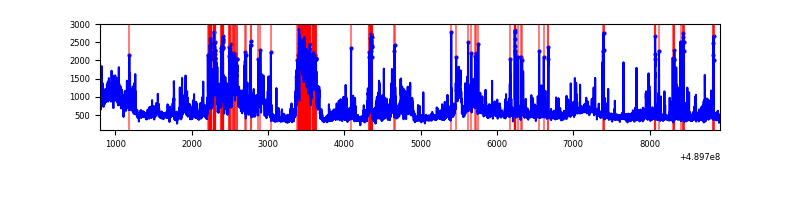 |
| C | 8122 | 8122 | 526 | 526 | 6.48% | 6.48% | 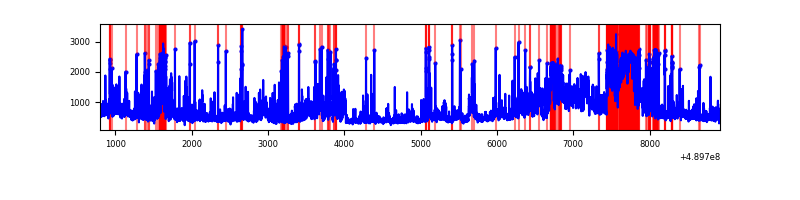 |
| D | 8122 | 8122 | 781 | 781 | 9.62% | 9.62% | 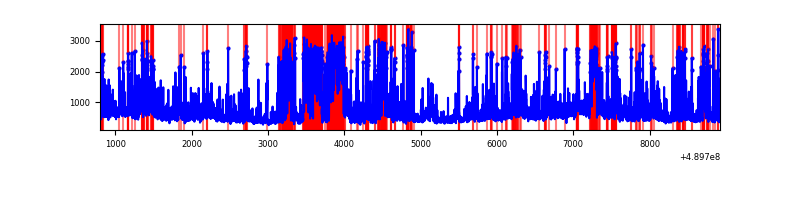 |
Top three noisy pixels from each quadrant. If the there are fewer than three noisy pixels in the level2.evt file, extra rows are filled as -1
| Pixel properties | Quadrant properties | ||||||
|---|---|---|---|---|---|---|---|
| Quadrant | DetID | PixID | Counts | Sigma | Mean | Median | Sigma |
| A | 9 | 191 | 12913812 | 93803.77 | 545 | 529 | 137.7 |
| A | 3 | 78 | 164011 | 1187.55 | 545 | 529 | 137.7 |
| A | 15 | 174 | 155929 | 1128.85 | 545 | 529 | 137.7 |
| B | 10 | 254 | 1429640 | 7775.44 | 860 | 830 | 183.8 |
| B | 1 | 255 | 236302 | 1281.42 | 860 | 830 | 183.8 |
| B | 5 | 185 | 160500 | 868.91 | 860 | 830 | 183.8 |
| C | 7 | 80 | 998244 | 4490.03 | 816 | 807 | 222.1 |
| C | 15 | 147 | 627049 | 2819.07 | 816 | 807 | 222.1 |
| C | 15 | 224 | 328522 | 1475.23 | 816 | 807 | 222.1 |
| D | 8 | 176 | 1765405 | 7502.05 | 823 | 785 | 235.2 |
| D | 2 | 120 | 332163 | 1408.81 | 823 | 785 | 235.2 |
| D | 15 | 125 | 330663 | 1402.43 | 823 | 785 | 235.2 |
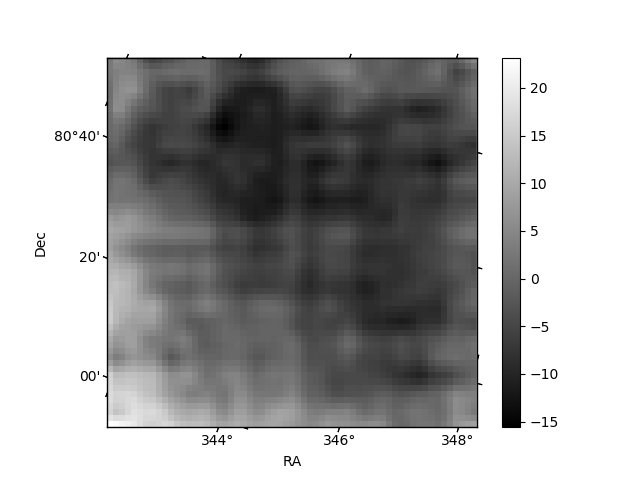
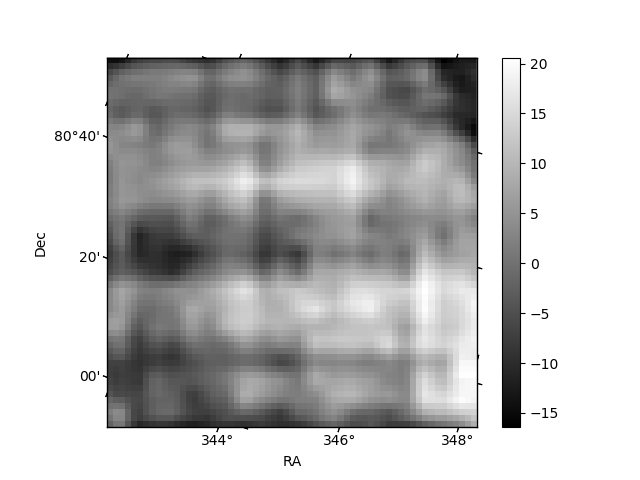
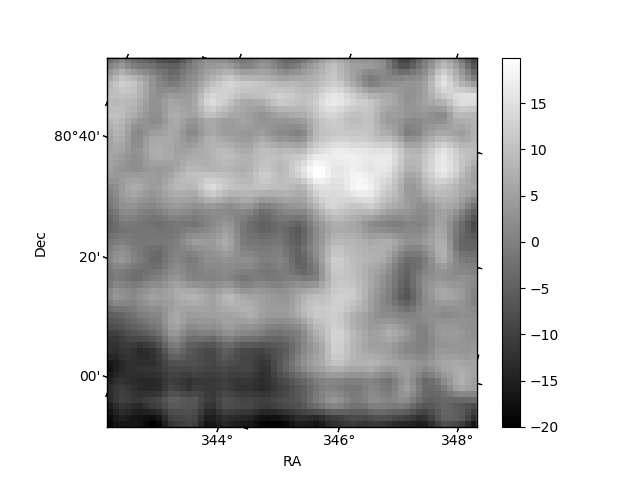
Histogram calculated using DETX and DETY for each event in the final _common_clean file
| Quadrant A | 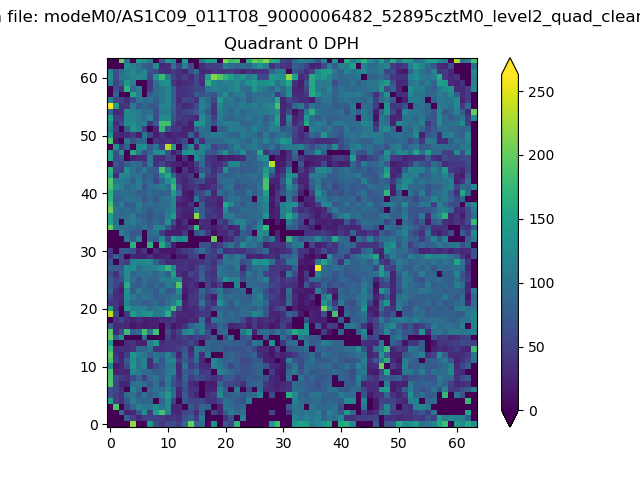 |
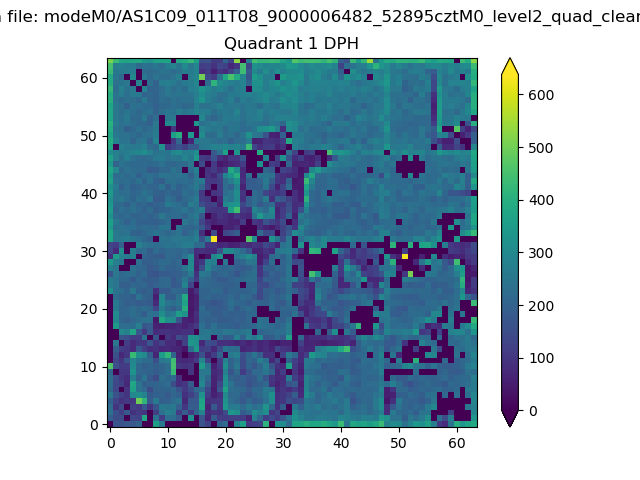 |
Quadrant B |
|---|---|---|---|
| Quadrant D | 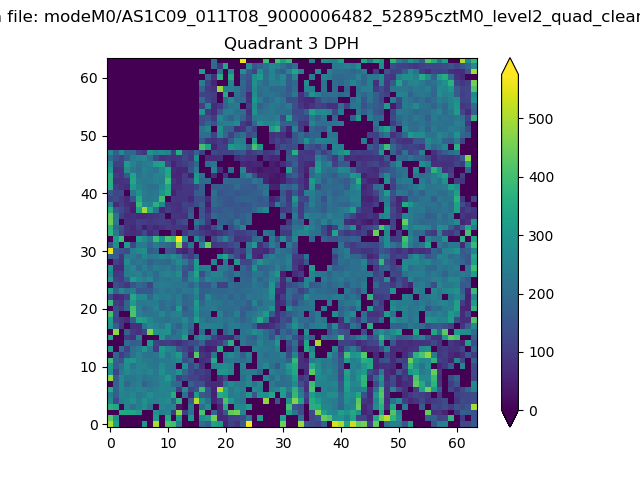 |
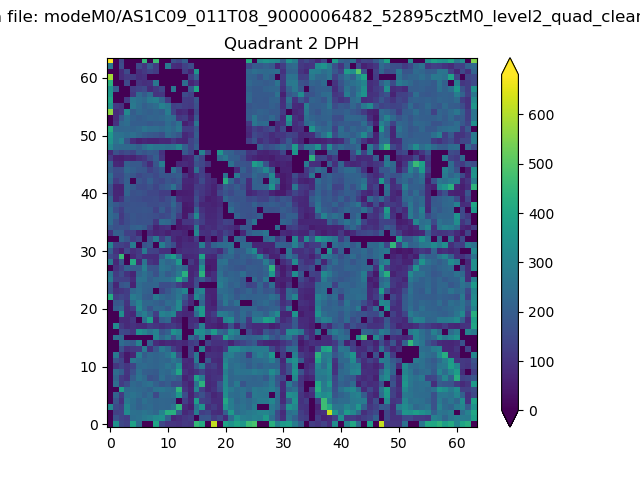 |
Quadrant C |
| Plot type | Count rate plots | Images |
|---|---|---|
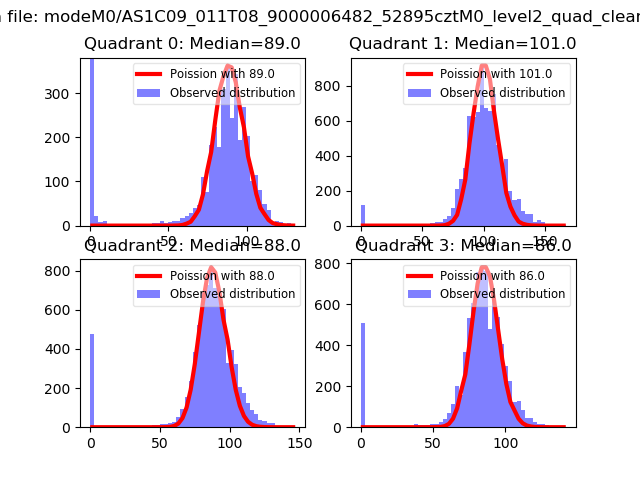
| Comparison with Poisson distribution Blue bars denote a histogram of data divided into 1 sec bins. Red curve is a Poisson curve with rate = median count rate of data. |
 |
 |
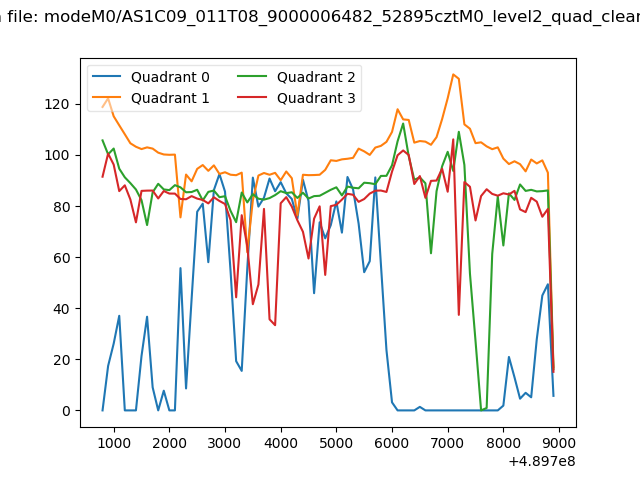
| Quadrant-wise count rates Data is divided into 100 sec bins |
 |
|
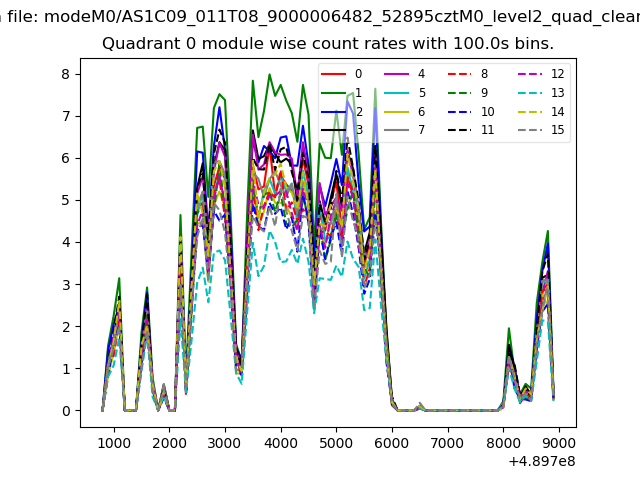
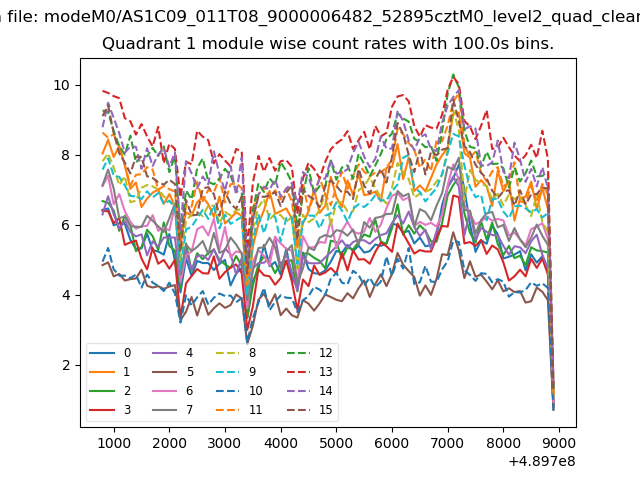
| Module-wise count rates for Quadrant A Data is divided into 100 sec bins |
 |
 |
| Module-wise count rates for Quadrant B Data is divided into 100 sec bins |
 |
 |
| Module-wise count rates for Quadrant C Data is divided into 100 sec bins |
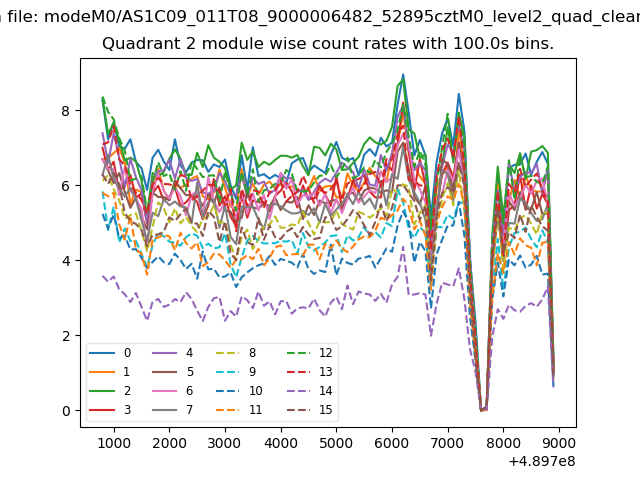 |
 |
| Module-wise count rates for Quadrant D Data is divided into 100 sec bins |
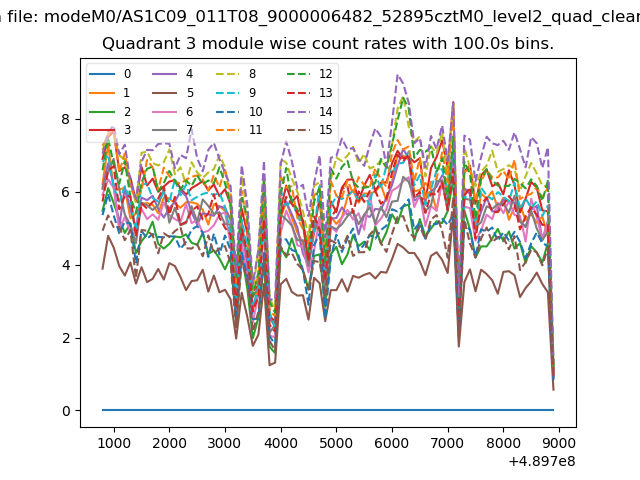 |
 |
| Parameter | Plot |
|---|---|
| CZT HV Monitor | 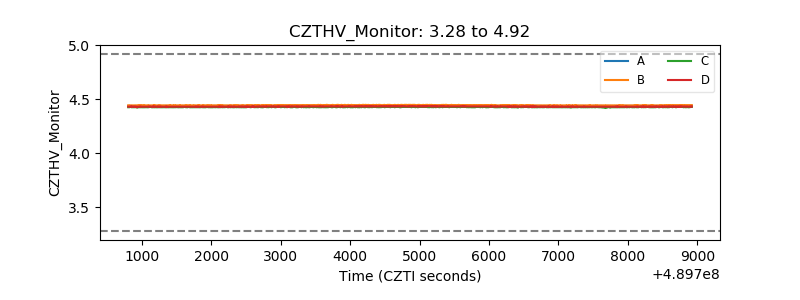 |
| D_VDD | 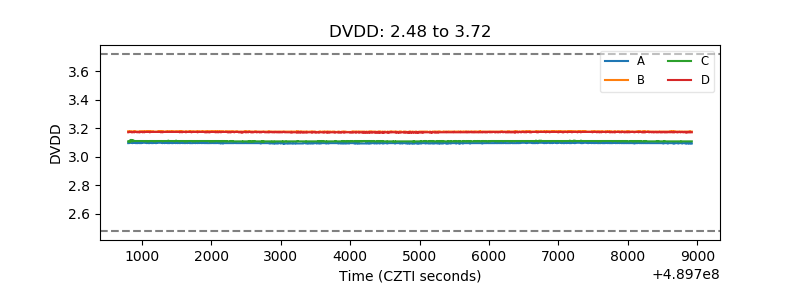 |
| Temperature 1 | 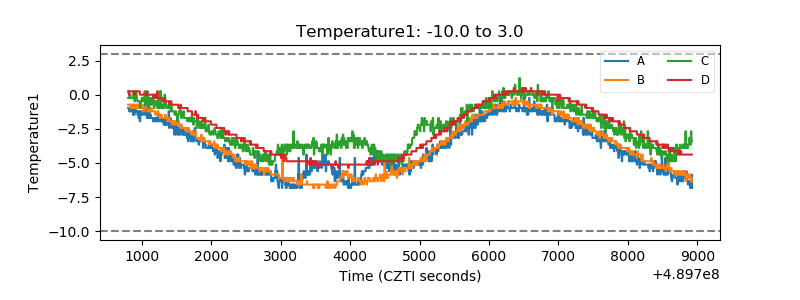 |
| Veto HV Monitor | 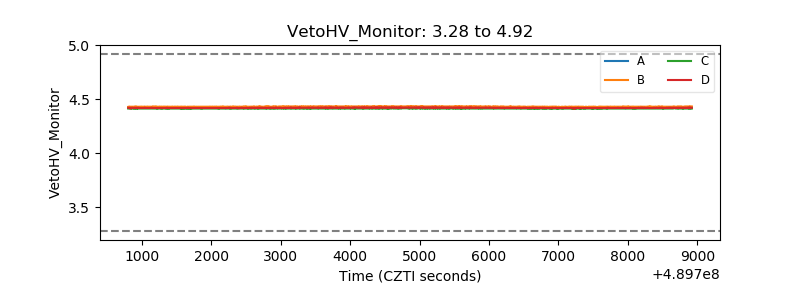 |
| Veto LLD | 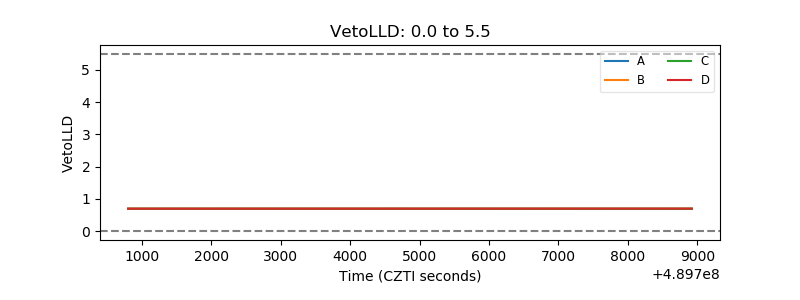 |
| Alpha Counter |  |
| _CPM_Rate | 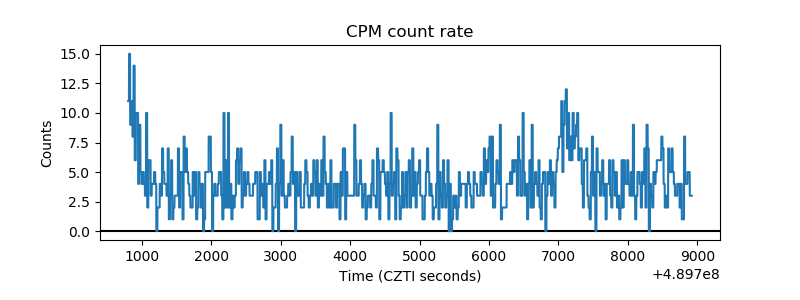 |
| CZT Counter | 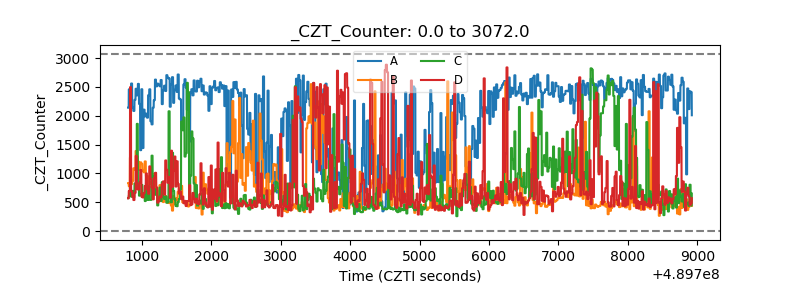 |
| +2.5 Volts monitor | 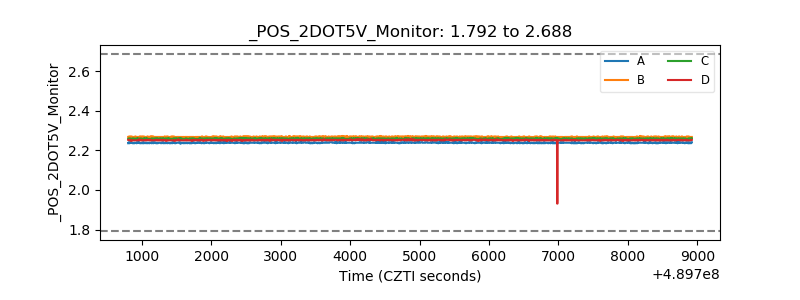 |
| +5 Volts monitor | 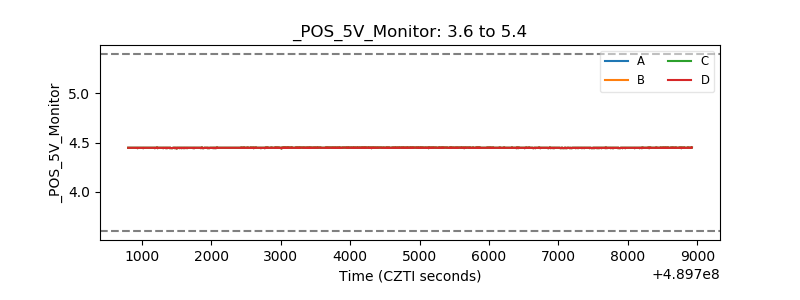 |
| _ROLL_ROT |  |
| _Roll_DEC | 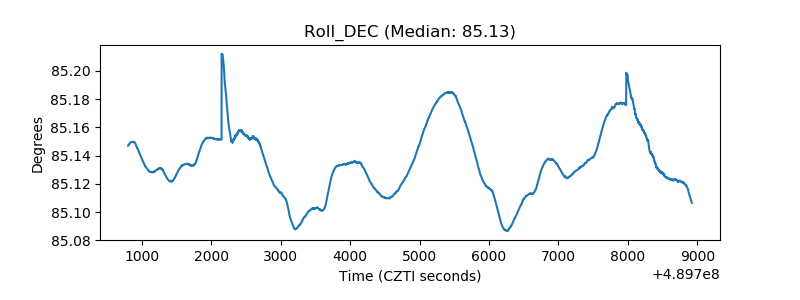 |
| _Roll_RA | 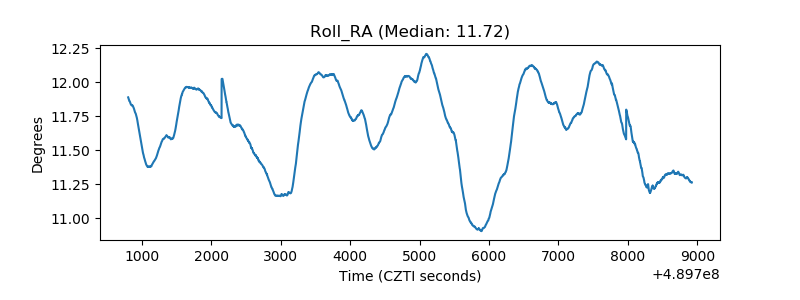 |
| Veto Counter | 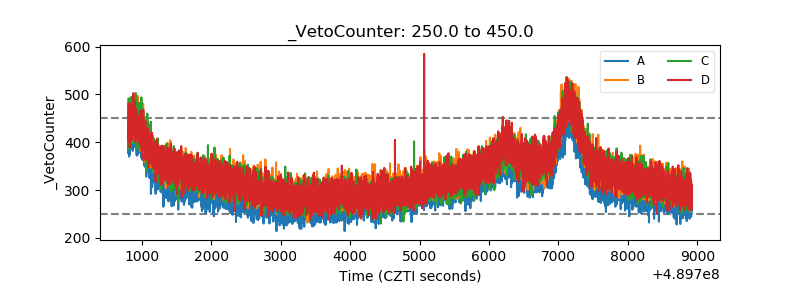 |