| Param | Original file | Final file |
|---|---|---|
| Filename | modeM0/AS1C09_011T06_9000006484_52899cztM0_level2.fits | modeM0/AS1C09_011T06_9000006484_52899cztM0_level2_quad_clean.evt |
| Size (bytes) | 913,752,000 | 62,988,480 |
| Size | 871.4 MB | 60.1 MB |
| Events in quadrant A | 15,024,230 | 181,796 |
| Events in quadrant B | 4,969,542 | 663,708 |
| Events in quadrant C | 6,514,915 | 30,135 |
| Events in quadrant D | 6,769,162 | 542,605 |
| Mode M9 | |||
|---|---|---|---|
| Quadrant | BADHDUFLAG | Total packets | Discarded packets |
| A | 0 | 8 | 0 |
| B | 0 | 8 | 0 |
| C | 0 | 8 | 0 |
| D | 0 | 8 | 0 |
| Mode M0 | |||
|---|---|---|---|
| Quadrant | BADHDUFLAG | Total packets | Discarded packets |
| A | 0 | 49311 | 2 |
| B | 0 | 19830 | 4 |
| C | 0 | 24380 | 2 |
| D | 0 | 25166 | 2 |
| Mode SS | |||
|---|---|---|---|
| Quadrant | BADHDUFLAG | Total packets | Discarded packets |
| A | 0 | 144 | 0 |
| B | 0 | 144 | 0 |
| C | 0 | 144 | 0 |
| D | 0 | 144 | 0 |
| Quadrant | Total seconds | Saturated seconds | Saturation percentage |
|---|---|---|---|
| A | 7007 | 5283 | 75.396033% |
| B | 7006 | 474 | 6.765629% |
| C | 7006 | 6710 | 95.775050% |
| D | 7006 | 986 | 14.073651% |
Noise dominated data is calculated using 1-second bins in cleaned event files. If a bin has >2000 counts, and if more than 50% of those come from <1% of pixels, then it is considered to be noise-dominated and hence unusable.
| Quadrant | # 1 sec bins | Bins with >0 counts | Bins with >2000 counts | High rate bins dominated by noise | Noise dominated (total time) | Noise dominated (detector-on time) | Marked lightcurve |
|---|---|---|---|---|---|---|---|
| A | 7831 | 7006 | 5161 | 5161 | 65.90% | 73.67% | 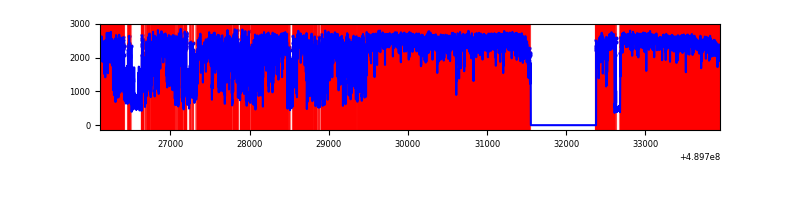 |
| B | 7831 | 7006 | 336 | 336 | 4.29% | 4.80% | 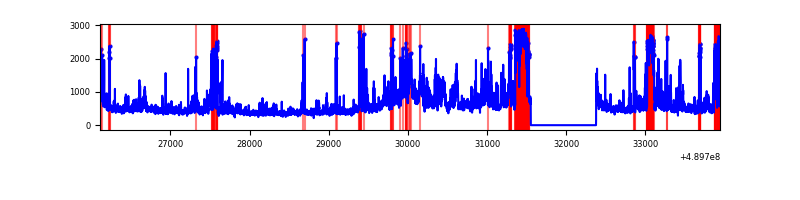 |
| C | 7830 | 7005 | 1007 | 1007 | 12.86% | 14.38% | 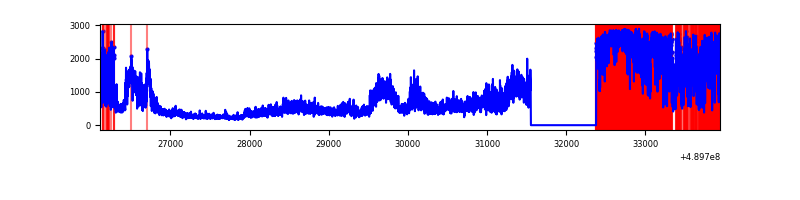 |
| D | 7831 | 7007 | 992 | 992 | 12.67% | 14.16% | 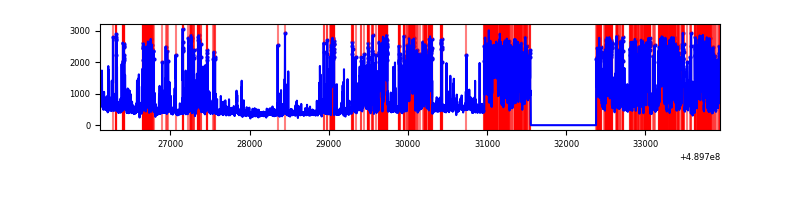 |
Top three noisy pixels from each quadrant. If the there are fewer than three noisy pixels in the level2.evt file, extra rows are filled as -1
| Pixel properties | Quadrant properties | ||||||
|---|---|---|---|---|---|---|---|
| Quadrant | DetID | PixID | Counts | Sigma | Mean | Median | Sigma |
| A | 9 | 191 | 12434874 | 121111.56 | 400 | 390 | 102.7 |
| A | 7 | 250 | 358832 | 3491.22 | 400 | 390 | 102.7 |
| A | 0 | 8 | 182231 | 1771.13 | 400 | 390 | 102.7 |
| B | 10 | 254 | 584526 | 3892.12 | 706 | 681 | 150.0 |
| B | 5 | 172 | 418720 | 2786.8 | 706 | 681 | 150.0 |
| B | 1 | 255 | 316069 | 2102.49 | 706 | 681 | 150.0 |
| C | 15 | 198 | 5861363 | 316710.2 | 61 | 61 | 18.5 |
| C | 7 | 80 | 179144 | 9676.59 | 61 | 61 | 18.5 |
| C | 2 | 12 | 67414 | 3639.36 | 61 | 61 | 18.5 |
| D | 8 | 176 | 2817943 | 14529.93 | 673 | 644 | 193.9 |
| D | 15 | 94 | 349806 | 1800.77 | 673 | 644 | 193.9 |
| D | 7 | 96 | 277723 | 1429.01 | 673 | 644 | 193.9 |
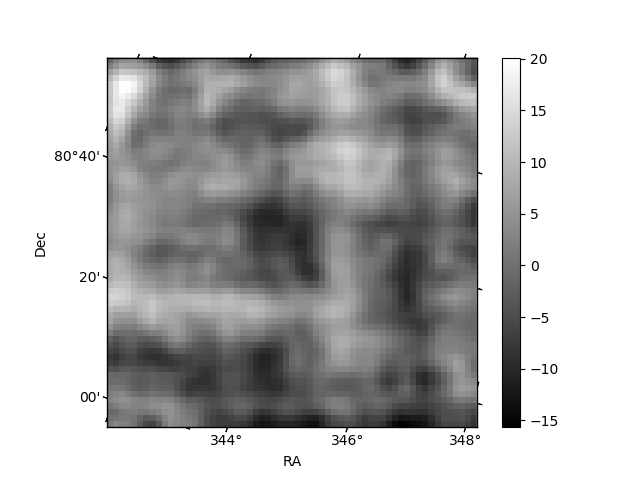
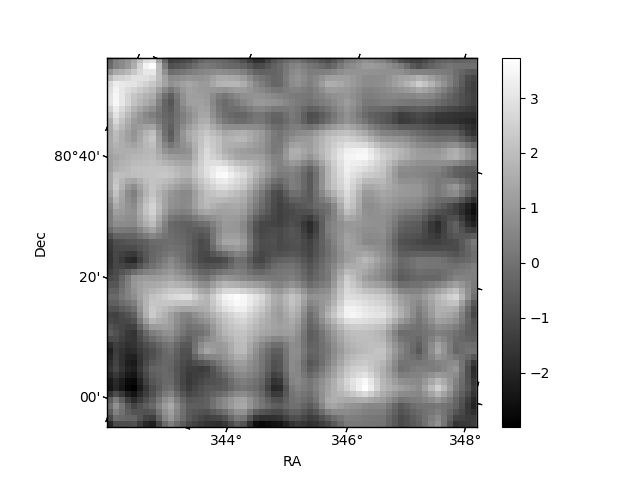
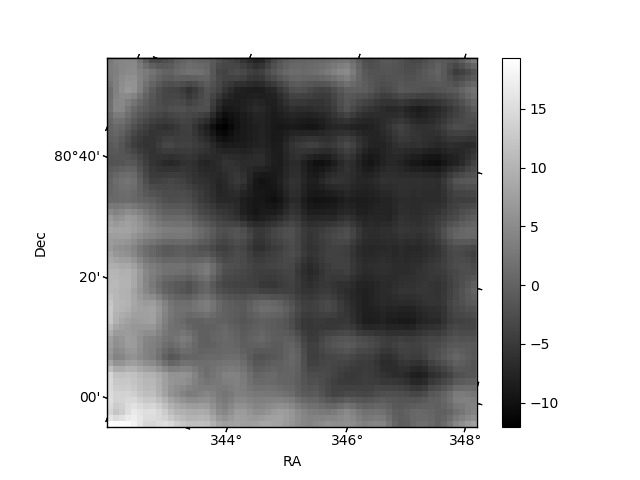
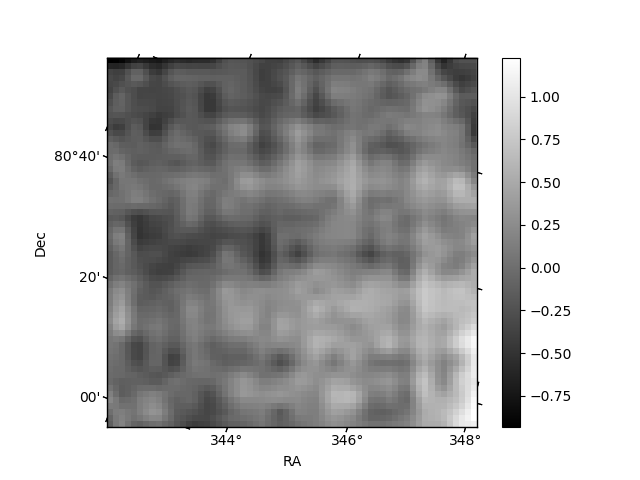
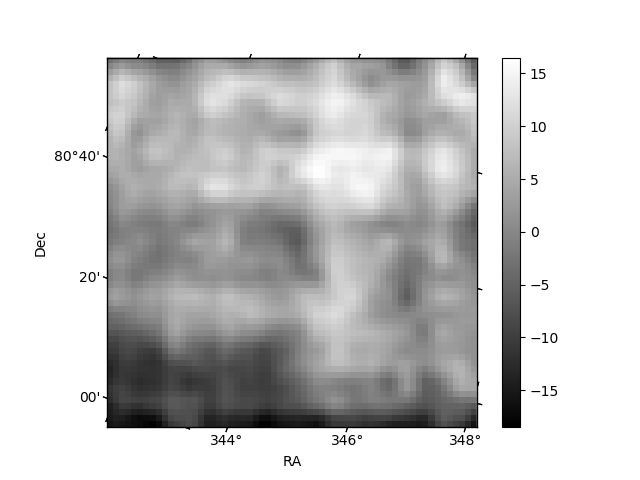
Histogram calculated using DETX and DETY for each event in the final _common_clean file
| Quadrant A | 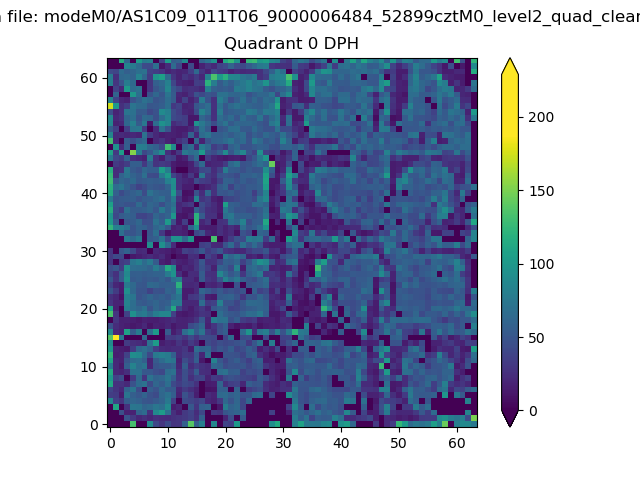 |
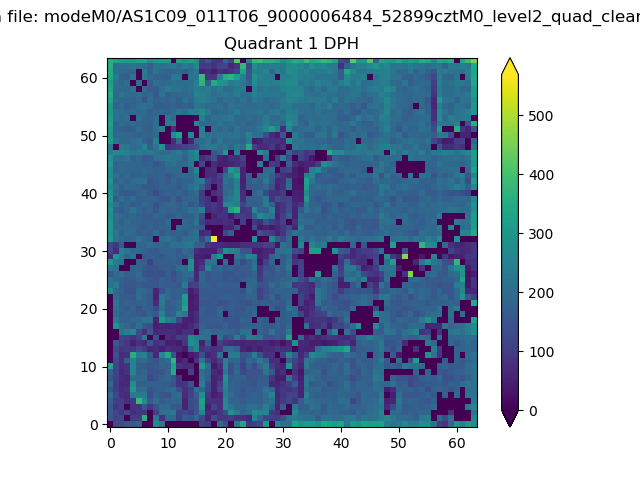 |
Quadrant B |
|---|---|---|---|
| Quadrant D | 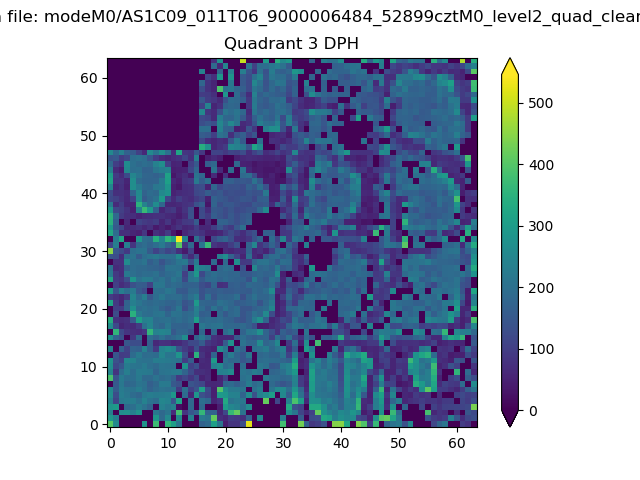 |
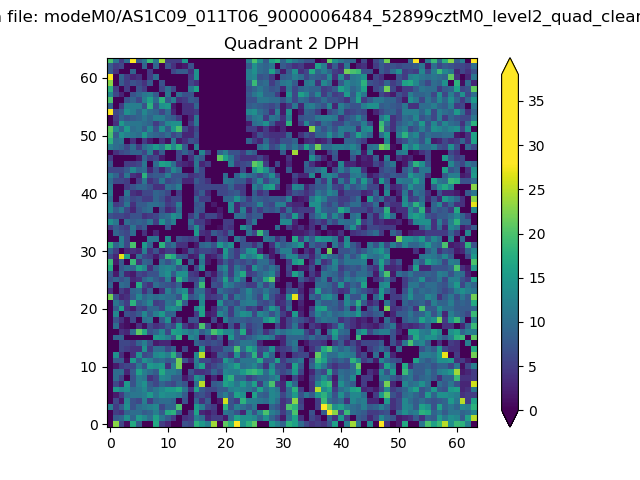 |
Quadrant C |
| Plot type | Count rate plots | Images |
|---|---|---|
| Comparison with Poisson distribution Blue bars denote a histogram of data divided into 1 sec bins. Red curve is a Poisson curve with rate = median count rate of data. |
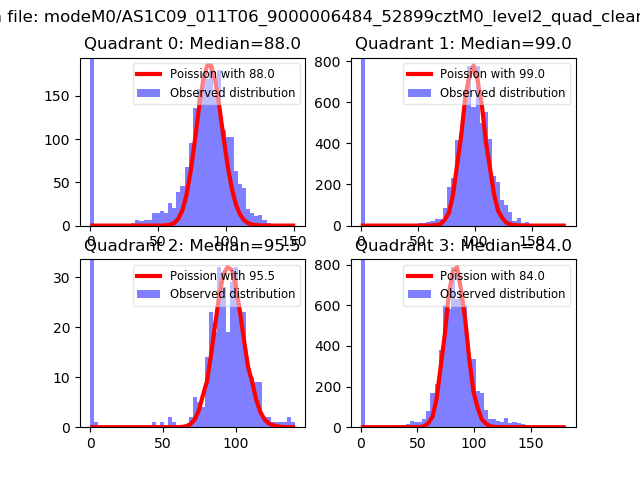 |
 |
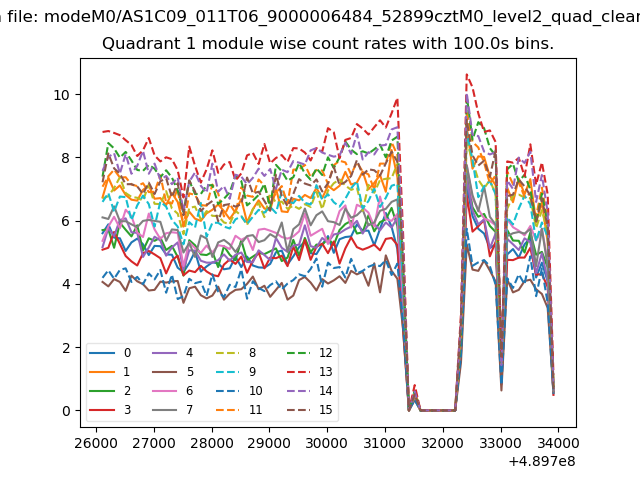
| Quadrant-wise count rates Data is divided into 100 sec bins |
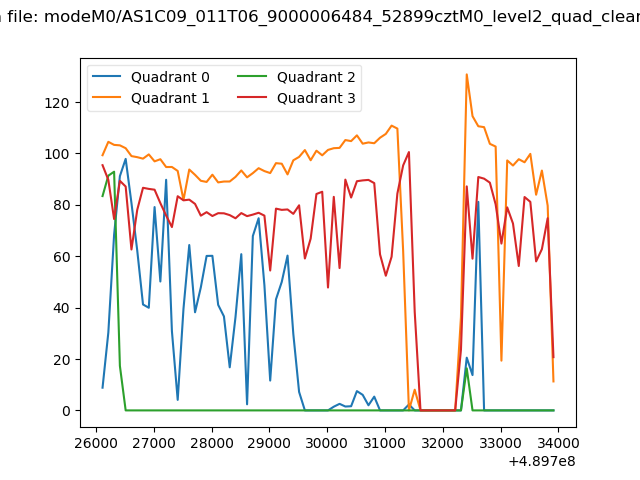 |
|
| Module-wise count rates for Quadrant A Data is divided into 100 sec bins |
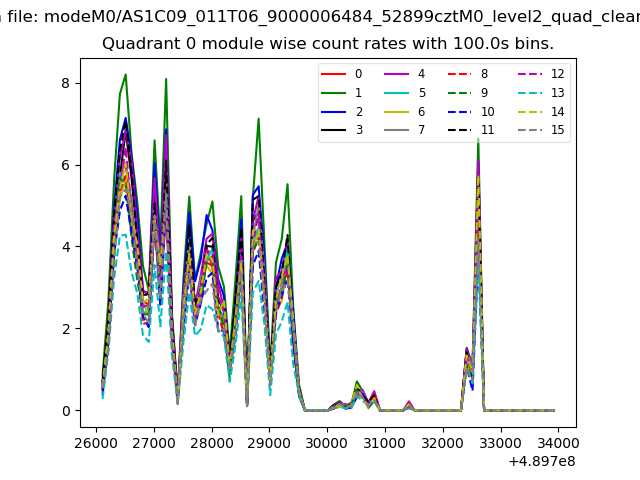 |
 |
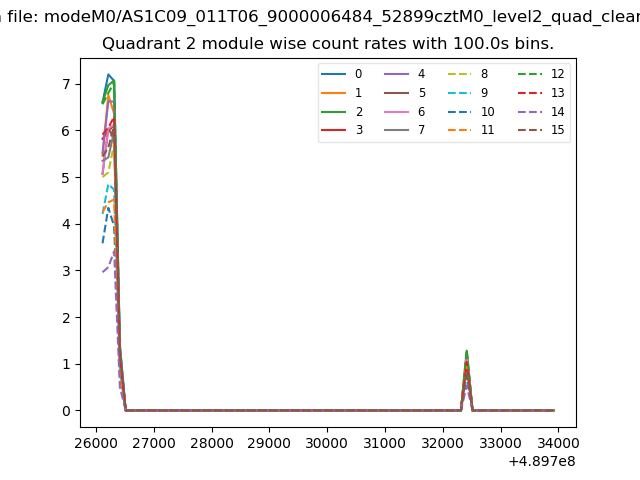
| Module-wise count rates for Quadrant B Data is divided into 100 sec bins |
 |
 |
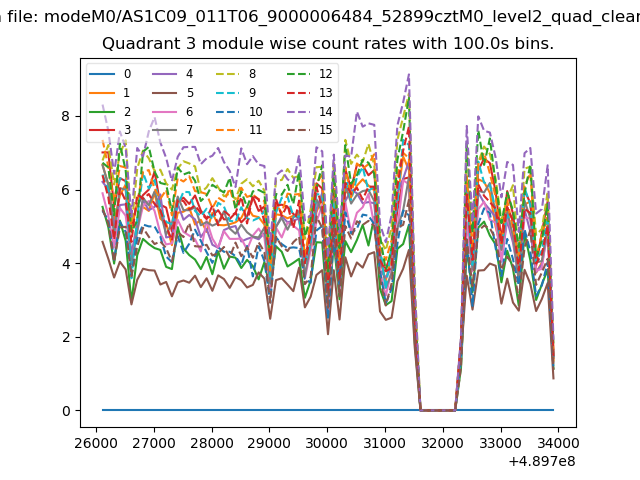
| Module-wise count rates for Quadrant C Data is divided into 100 sec bins |
 |
 |
| Module-wise count rates for Quadrant D Data is divided into 100 sec bins |
 |
 |
| Parameter | Plot |
|---|---|
| CZT HV Monitor | 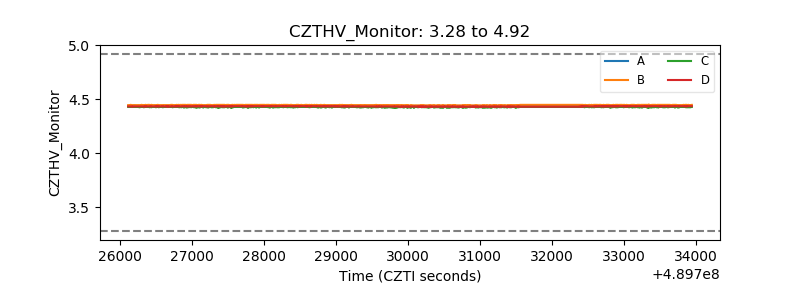 |
| D_VDD | 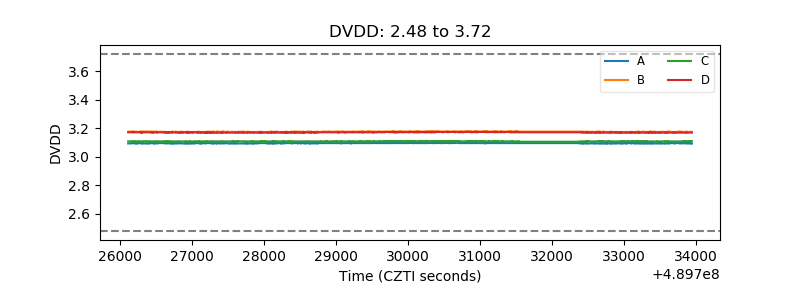 |
| Temperature 1 | 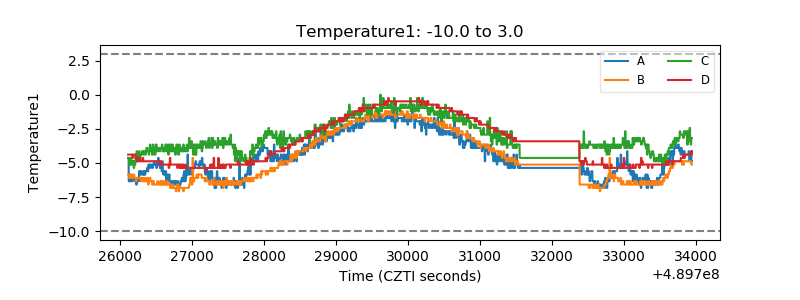 |
| Veto HV Monitor | 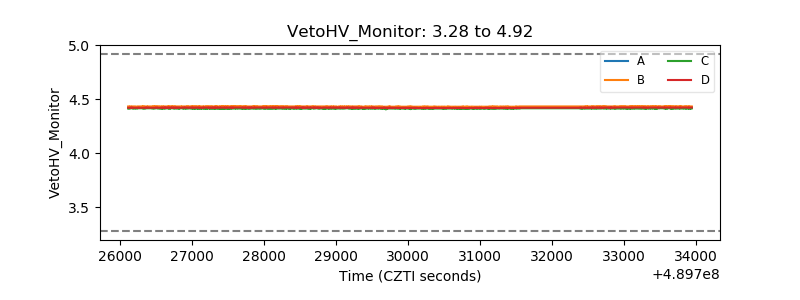 |
| Veto LLD | 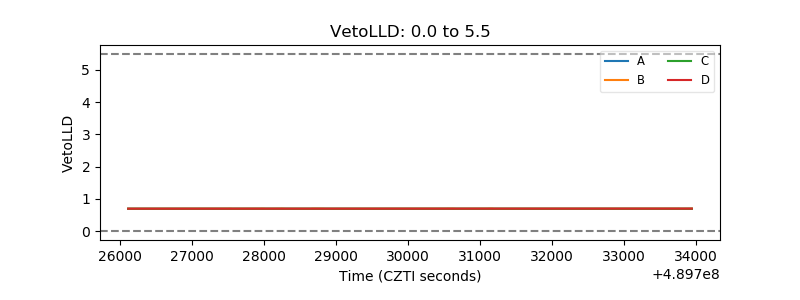 |
| Alpha Counter | 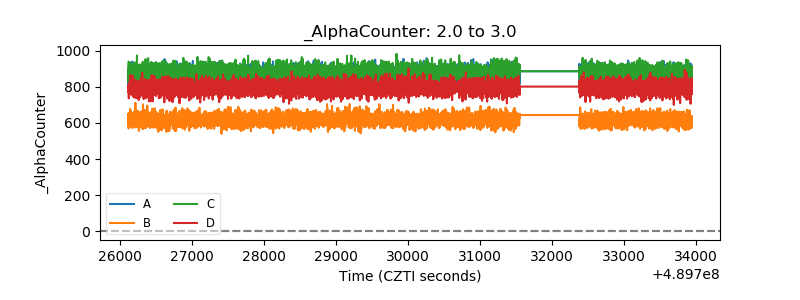 |
| _CPM_Rate | 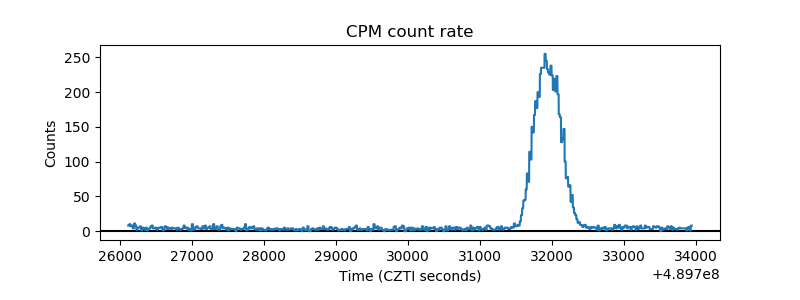 |
| CZT Counter | 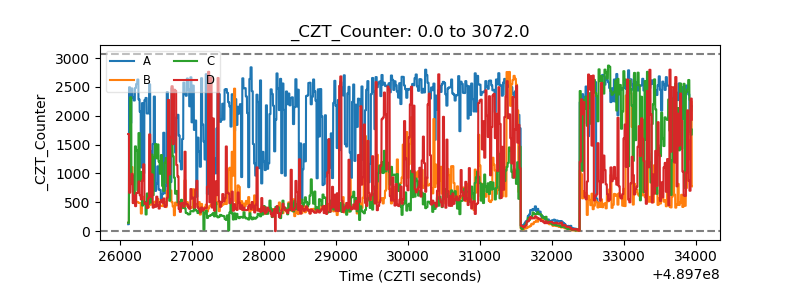 |
| +2.5 Volts monitor | 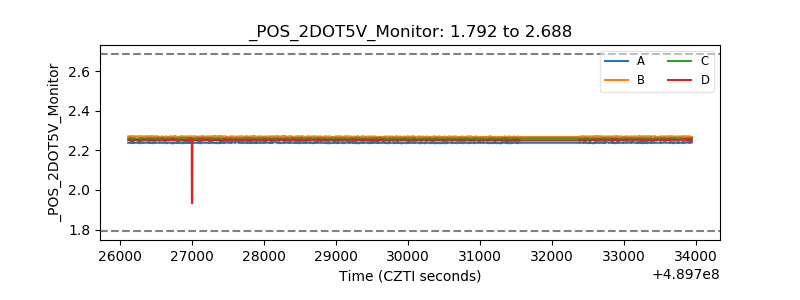 |
| +5 Volts monitor |  |
| _ROLL_ROT | 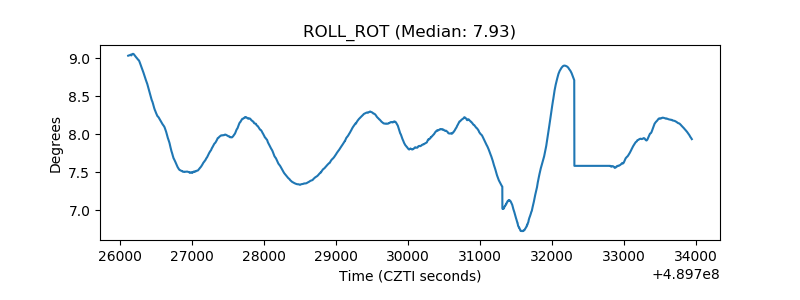 |
| _Roll_DEC | 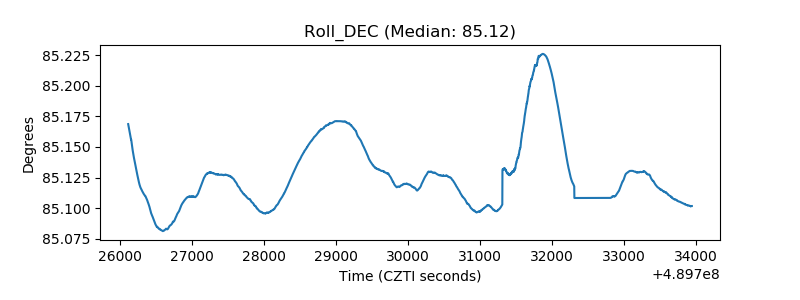 |
| _Roll_RA | 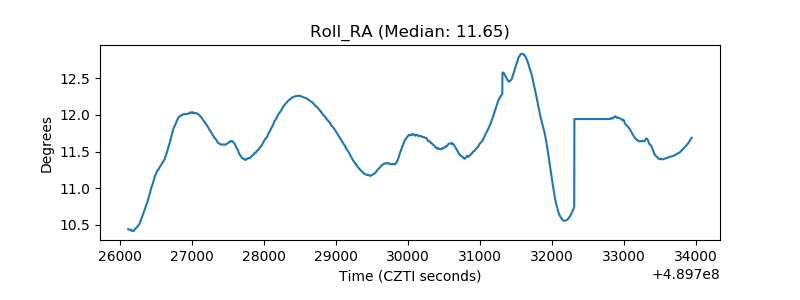 |
| Veto Counter | 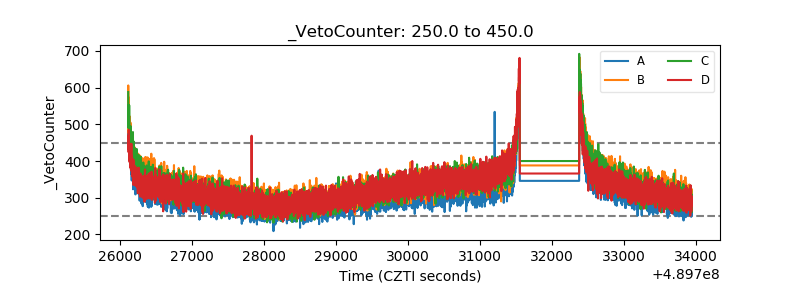 |