| Param | Original file | Final file |
|---|---|---|
| Filename | modeM0/AS1C09_011T06_9000006484_52901cztM0_level2.fits | modeM0/AS1C09_011T06_9000006484_52901cztM0_level2_quad_clean.evt |
| Size (bytes) | 1,116,866,880 | 43,876,800 |
| Size | 1.0 GB | 41.8 MB |
| Events in quadrant A | 15,098,787 | 584 |
| Events in quadrant B | 7,787,915 | 437,458 |
| Events in quadrant C | 10,463,812 | 4,773 |
| Events in quadrant D | 7,502,117 | 444,095 |
| Mode M9 | |||
|---|---|---|---|
| Quadrant | BADHDUFLAG | Total packets | Discarded packets |
| A | 0 | 10 | 0 |
| B | 0 | 10 | 0 |
| C | 0 | 10 | 0 |
| D | 0 | 10 | 0 |
| Mode M0 | |||
|---|---|---|---|
| Quadrant | BADHDUFLAG | Total packets | Discarded packets |
| A | 0 | 49105 | 1 |
| B | 0 | 27518 | 1 |
| C | 0 | 35519 | 1 |
| D | 0 | 26667 | 1 |
| Mode SS | |||
|---|---|---|---|
| Quadrant | BADHDUFLAG | Total packets | Discarded packets |
| A | 0 | 128 | 0 |
| B | 0 | 128 | 0 |
| C | 0 | 128 | 0 |
| D | 0 | 128 | 0 |
| Quadrant | Total seconds | Saturated seconds | Saturation percentage |
|---|---|---|---|
| A | 6325 | 6320 | 99.920949% |
| B | 6324 | 2314 | 36.590765% |
| C | 6324 | 6299 | 99.604681% |
| D | 6324 | 1386 | 21.916509% |
Noise dominated data is calculated using 1-second bins in cleaned event files. If a bin has >2000 counts, and if more than 50% of those come from <1% of pixels, then it is considered to be noise-dominated and hence unusable.
| Quadrant | # 1 sec bins | Bins with >0 counts | Bins with >2000 counts | High rate bins dominated by noise | Noise dominated (total time) | Noise dominated (detector-on time) | Marked lightcurve |
|---|---|---|---|---|---|---|---|
| A | 7299 | 6324 | 6156 | 6156 | 84.34% | 97.34% | 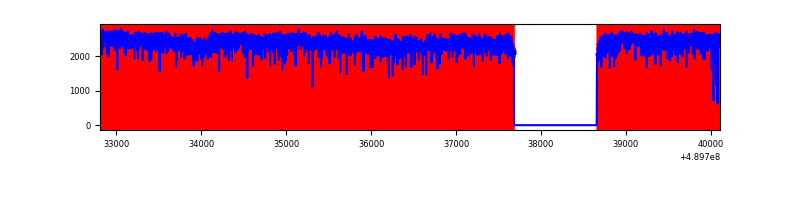 |
| B | 7298 | 6323 | 1751 | 1751 | 23.99% | 27.69% | 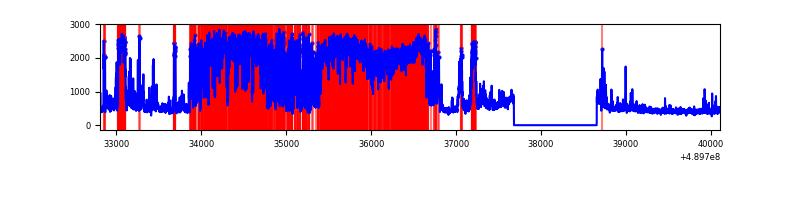 |
| C | 7298 | 6323 | 2647 | 2647 | 36.27% | 41.86% | 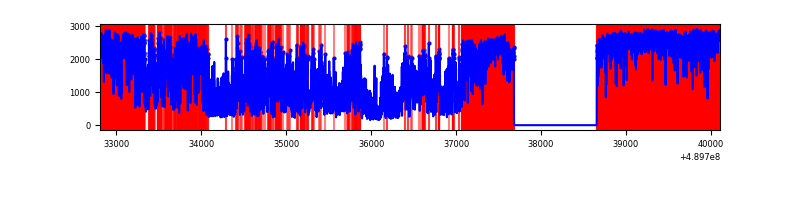 |
| D | 7298 | 6323 | 1260 | 1260 | 17.27% | 19.93% | 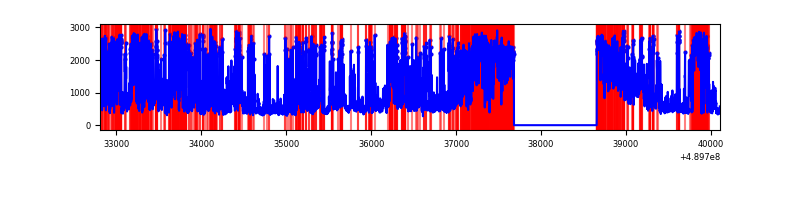 |
Top three noisy pixels from each quadrant. If the there are fewer than three noisy pixels in the level2.evt file, extra rows are filled as -1
| Pixel properties | Quadrant properties | ||||||
|---|---|---|---|---|---|---|---|
| Quadrant | DetID | PixID | Counts | Sigma | Mean | Median | Sigma |
| A | 9 | 191 | 14587298 | 531653.79 | 100 | 97 | 27.4 |
| A | 0 | 29 | 23957 | 869.6 | 100 | 97 | 27.4 |
| A | 12 | 17 | 11548 | 417.33 | 100 | 97 | 27.4 |
| B | 12 | 32 | 4998684 | 43779.93 | 529 | 511 | 114.2 |
| B | 10 | 254 | 200007 | 1747.42 | 529 | 511 | 114.2 |
| B | 10 | 44 | 190015 | 1659.9 | 529 | 511 | 114.2 |
| C | 15 | 198 | 9935909 | 542910.92 | 58 | 57 | 18.3 |
| C | 7 | 80 | 184535 | 10080.17 | 58 | 57 | 18.3 |
| C | 2 | 12 | 43912 | 2396.31 | 58 | 57 | 18.3 |
| D | 8 | 176 | 3461541 | 21461.84 | 560 | 535 | 161.3 |
| D | 15 | 94 | 514323 | 3186.02 | 560 | 535 | 161.3 |
| D | 15 | 174 | 346760 | 2146.96 | 560 | 535 | 161.3 |
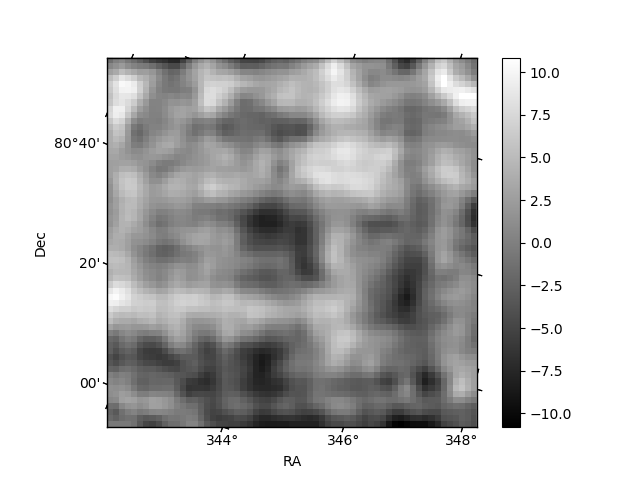
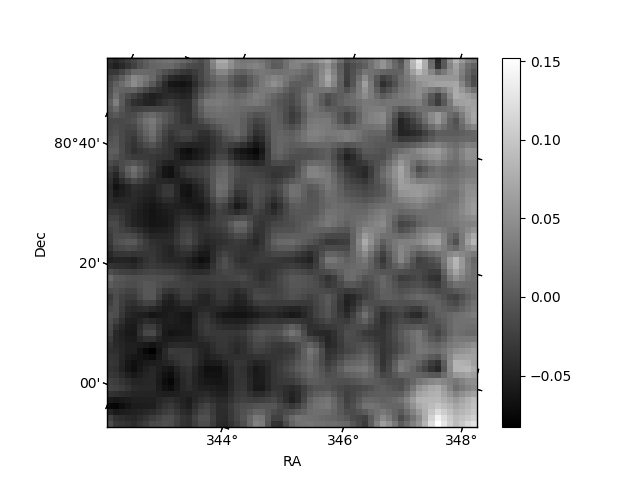
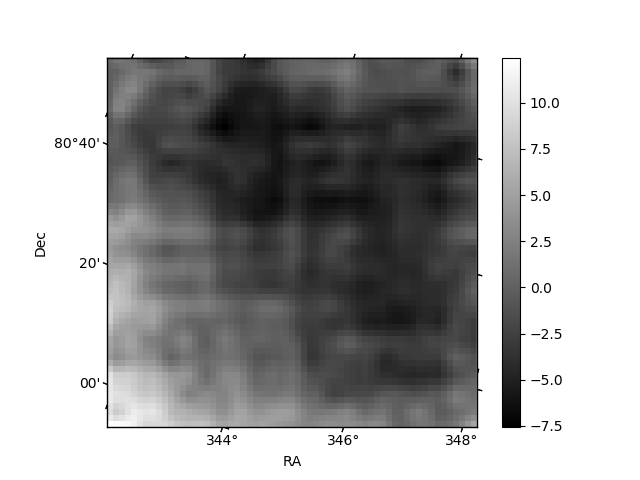
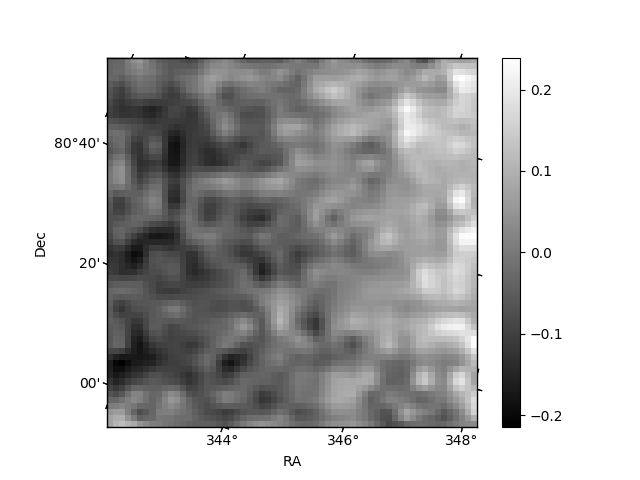
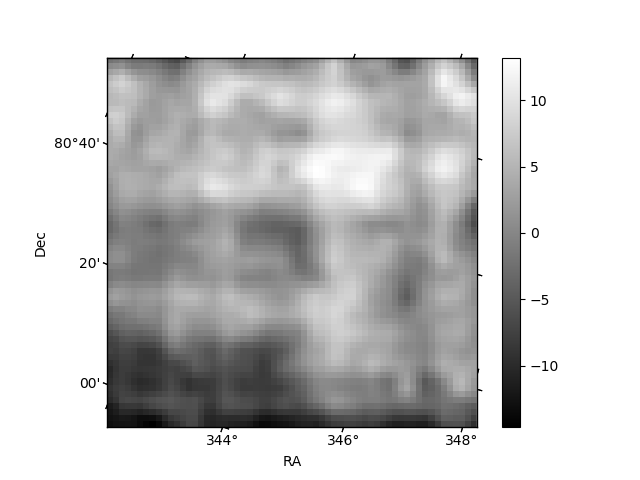
Histogram calculated using DETX and DETY for each event in the final _common_clean file
| Quadrant A | 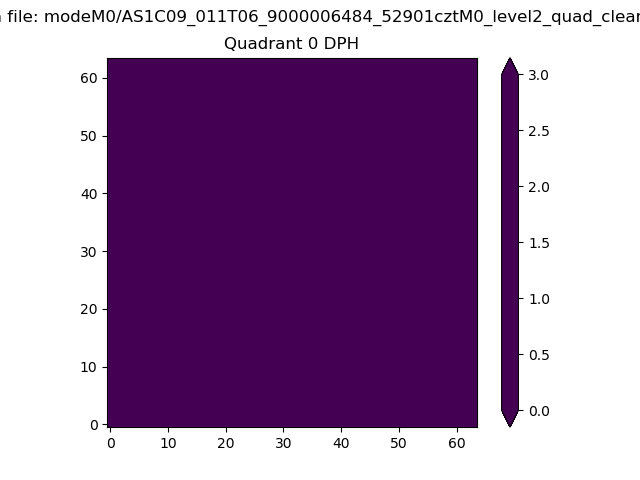 |
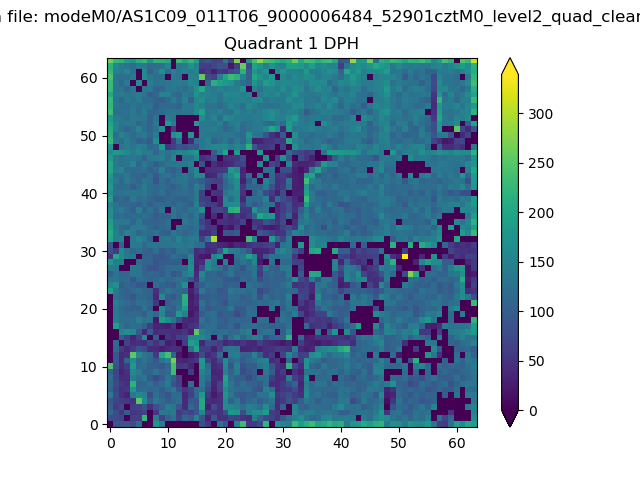 |
Quadrant B |
|---|---|---|---|
| Quadrant D | 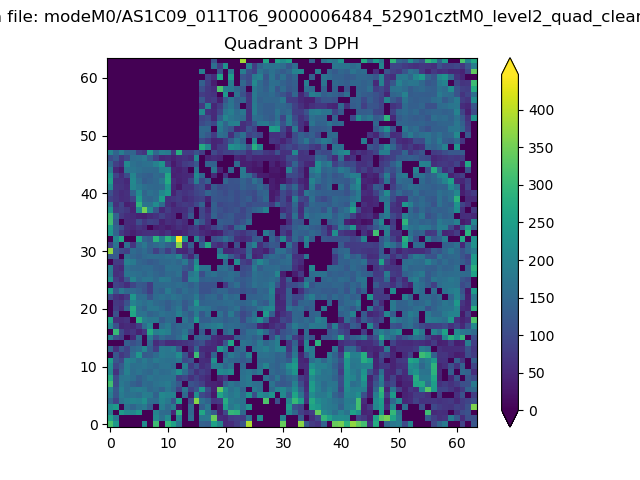 |
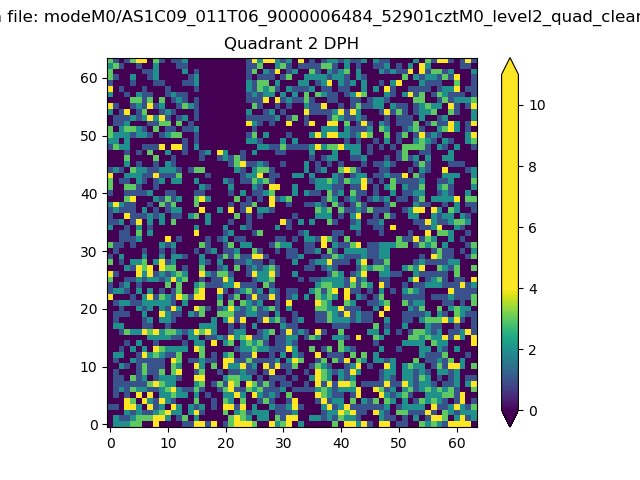 |
Quadrant C |
| Plot type | Count rate plots | Images |
|---|---|---|
| Comparison with Poisson distribution Blue bars denote a histogram of data divided into 1 sec bins. Red curve is a Poisson curve with rate = median count rate of data. |
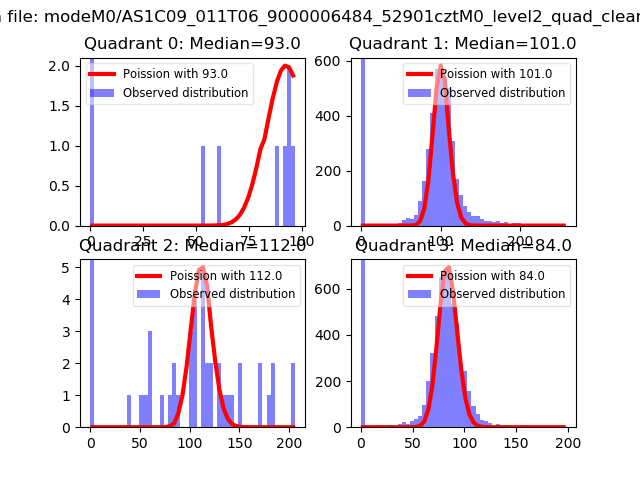 |
 |
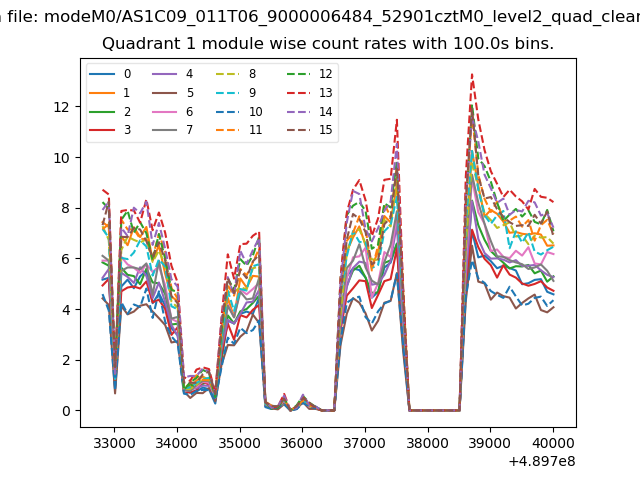
| Quadrant-wise count rates Data is divided into 100 sec bins |
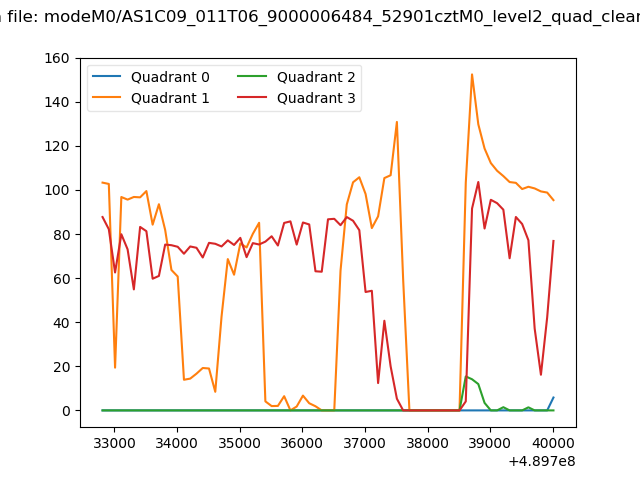 |
|
| Module-wise count rates for Quadrant A Data is divided into 100 sec bins |
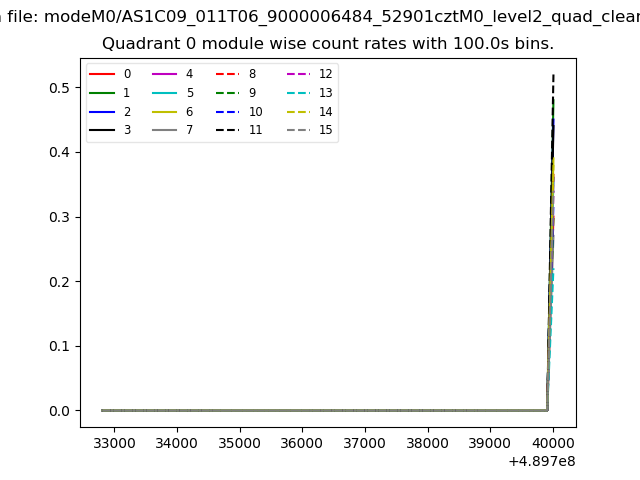 |
 |
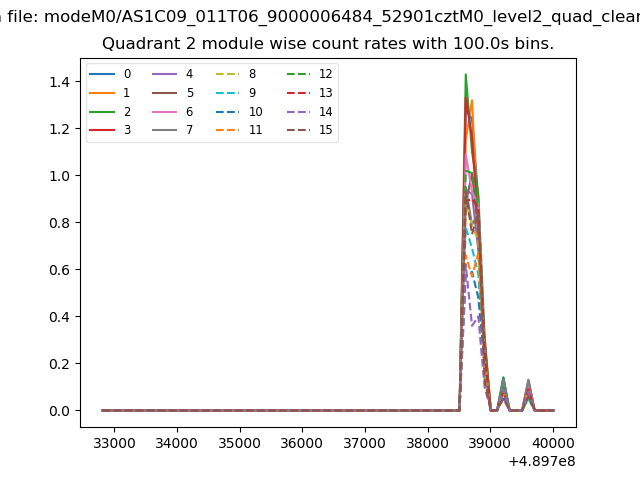
| Module-wise count rates for Quadrant B Data is divided into 100 sec bins |
 |
 |
| Module-wise count rates for Quadrant C Data is divided into 100 sec bins |
 |
 |
| Module-wise count rates for Quadrant D Data is divided into 100 sec bins |
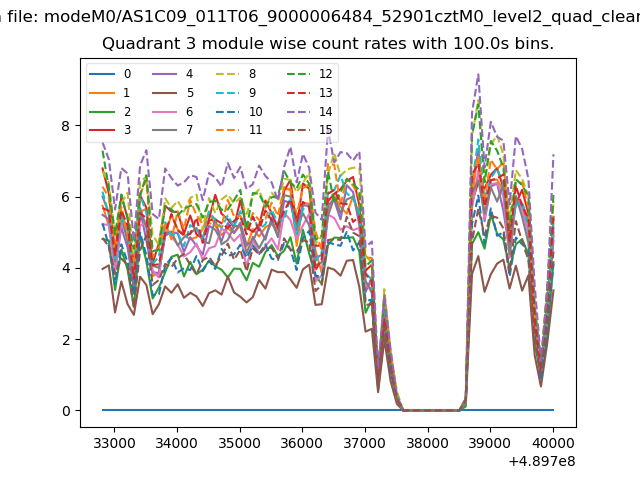 |
 |
| Parameter | Plot |
|---|---|
| CZT HV Monitor | 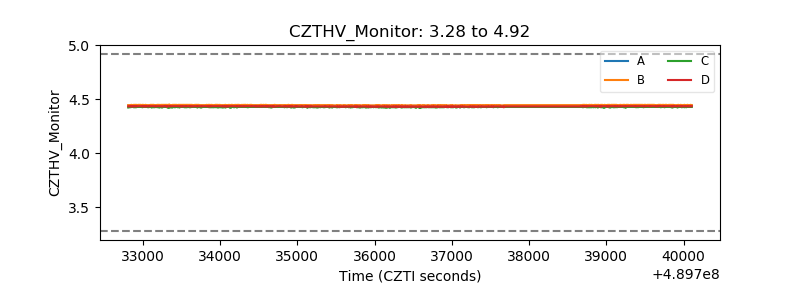 |
| D_VDD | 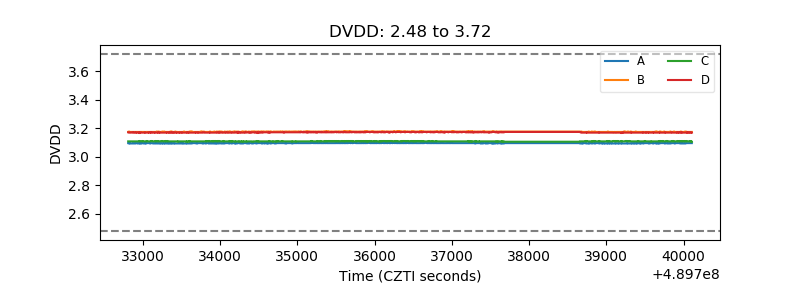 |
| Temperature 1 | 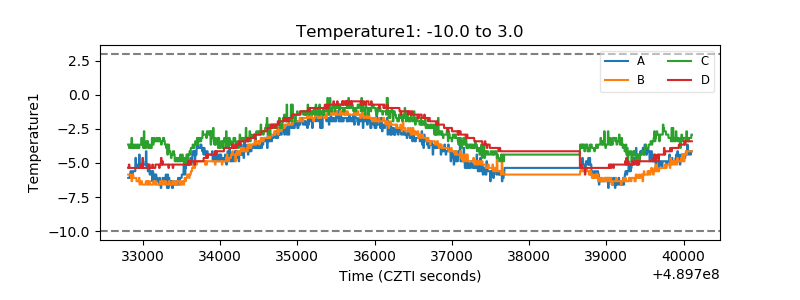 |
| Veto HV Monitor | 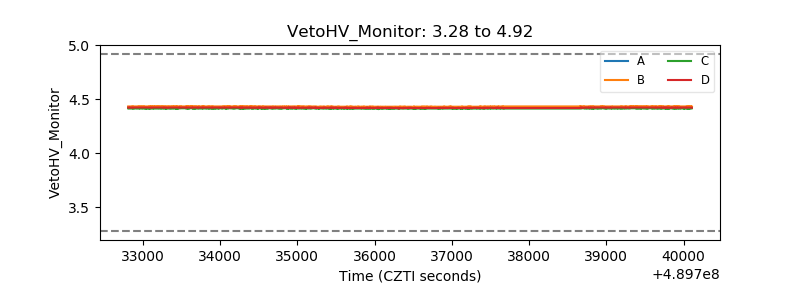 |
| Veto LLD | 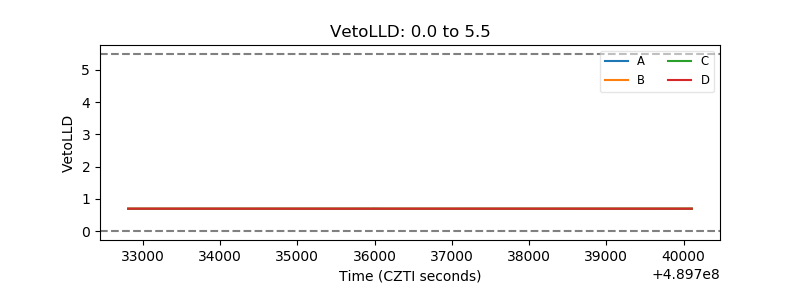 |
| Alpha Counter | 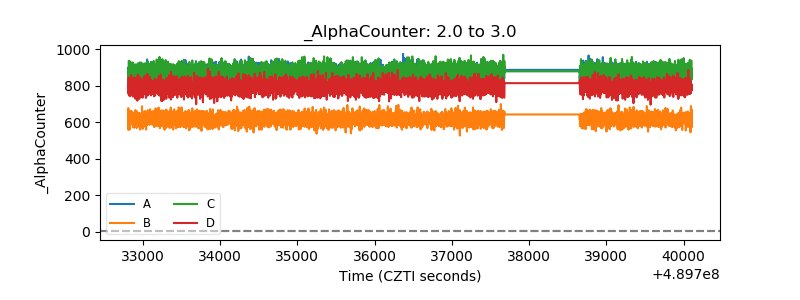 |
| _CPM_Rate | 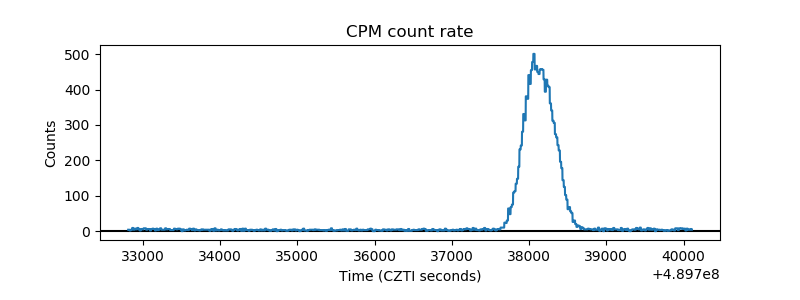 |
| CZT Counter | 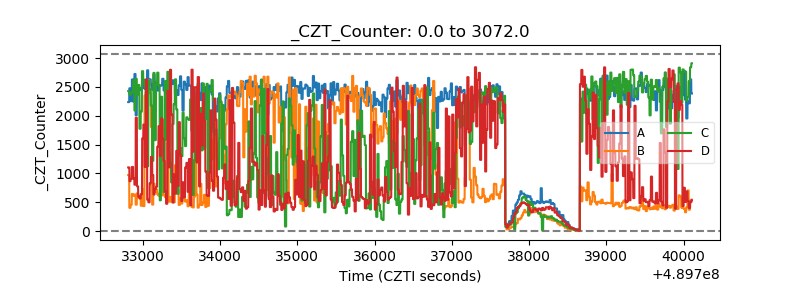 |
| +2.5 Volts monitor |  |
| +5 Volts monitor |  |
| _ROLL_ROT | 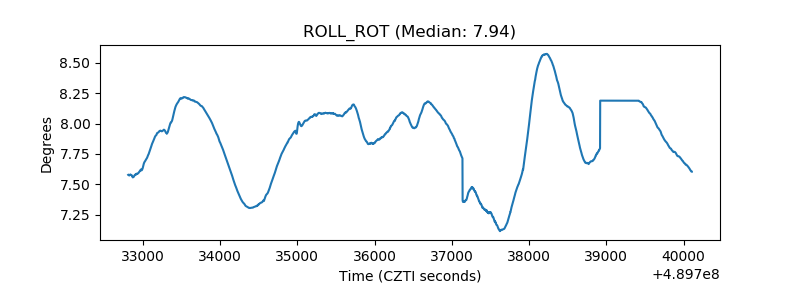 |
| _Roll_DEC | 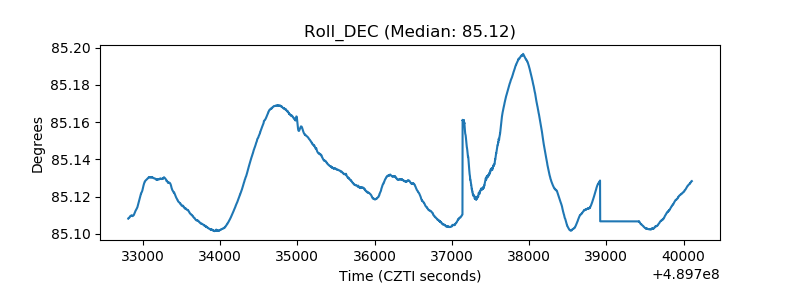 |
| _Roll_RA | 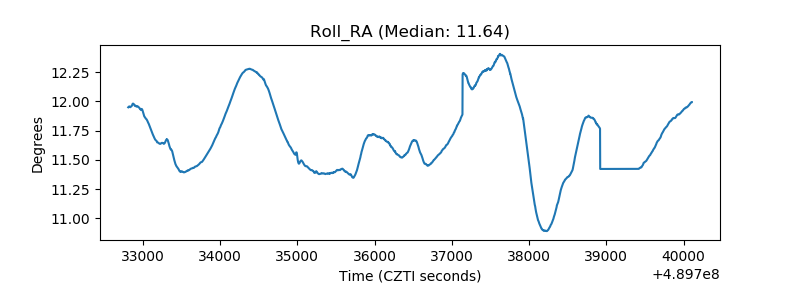 |
| Veto Counter | 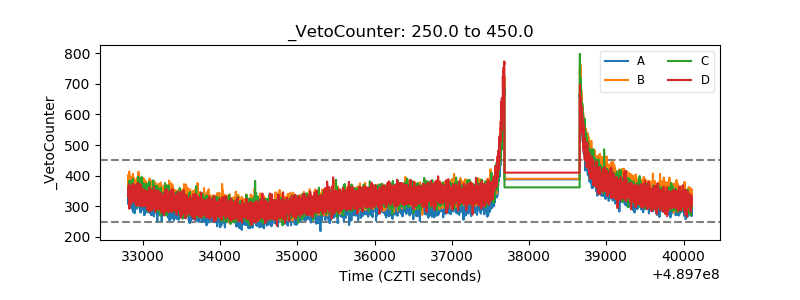 |