| Param | Original file | Final file |
|---|---|---|
| Filename | modeM0/AS1C09_011T06_9000006484_52902cztM0_level2.fits | modeM0/AS1C09_011T06_9000006484_52902cztM0_level2_quad_clean.evt |
| Size (bytes) | 897,451,200 | 61,496,640 |
| Size | 855.9 MB | 58.6 MB |
| Events in quadrant A | 9,875,910 | 325,037 |
| Events in quadrant B | 3,288,733 | 588,377 |
| Events in quadrant C | 13,041,852 | 134,181 |
| Events in quadrant D | 6,566,225 | 409,625 |
| Mode M9 | |||
|---|---|---|---|
| Quadrant | BADHDUFLAG | Total packets | Discarded packets |
| A | 0 | 11 | 0 |
| B | 0 | 11 | 0 |
| C | 0 | 11 | 0 |
| D | 0 | 11 | 0 |
| Mode M0 | |||
|---|---|---|---|
| Quadrant | BADHDUFLAG | Total packets | Discarded packets |
| A | 0 | 33244 | 1 |
| B | 0 | 13933 | 1 |
| C | 0 | 42743 | 1 |
| D | 0 | 23478 | 2 |
| Mode SS | |||
|---|---|---|---|
| Quadrant | BADHDUFLAG | Total packets | Discarded packets |
| A | 0 | 116 | 0 |
| B | 0 | 116 | 0 |
| C | 0 | 116 | 0 |
| D | 0 | 116 | 0 |
| Quadrant | Total seconds | Saturated seconds | Saturation percentage |
|---|---|---|---|
| A | 5792 | 2905 | 50.155387% |
| B | 5792 | 222 | 3.832873% |
| C | 5792 | 4570 | 78.901934% |
| D | 5791 | 1309 | 22.604041% |
Noise dominated data is calculated using 1-second bins in cleaned event files. If a bin has >2000 counts, and if more than 50% of those come from <1% of pixels, then it is considered to be noise-dominated and hence unusable.
| Quadrant | # 1 sec bins | Bins with >0 counts | Bins with >2000 counts | High rate bins dominated by noise | Noise dominated (total time) | Noise dominated (detector-on time) | Marked lightcurve |
|---|---|---|---|---|---|---|---|
| A | 6887 | 5793 | 2784 | 2784 | 40.42% | 48.06% | 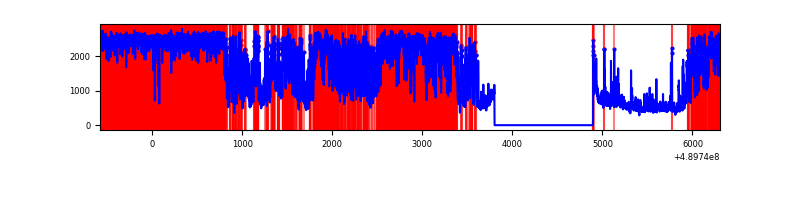 |
| B | 6886 | 5792 | 99 | 99 | 1.44% | 1.71% | 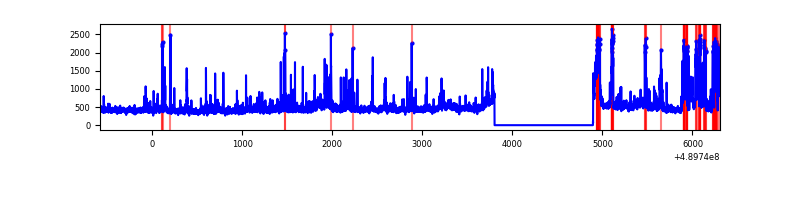 |
| C | 6887 | 5793 | 4419 | 4419 | 64.16% | 76.28% | 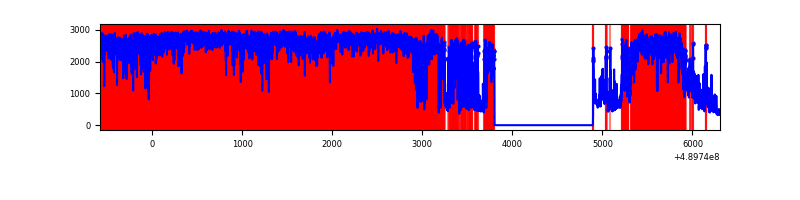 |
| D | 6886 | 5792 | 1063 | 1063 | 15.44% | 18.35% | 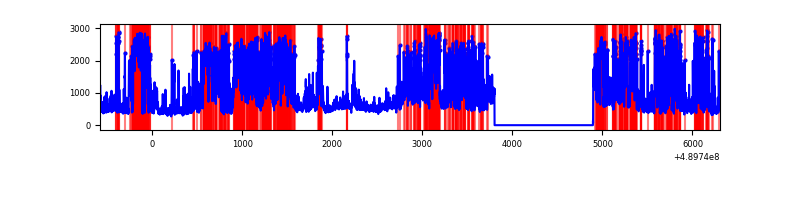 |
Top three noisy pixels from each quadrant. If the there are fewer than three noisy pixels in the level2.evt file, extra rows are filled as -1
| Pixel properties | Quadrant properties | ||||||
|---|---|---|---|---|---|---|---|
| Quadrant | DetID | PixID | Counts | Sigma | Mean | Median | Sigma |
| A | 9 | 191 | 7442732 | 62521.29 | 472 | 459 | 119.0 |
| A | 8 | 249 | 109190 | 913.43 | 472 | 459 | 119.0 |
| A | 12 | 17 | 82991 | 693.34 | 472 | 459 | 119.0 |
| B | 1 | 255 | 548387 | 4286.18 | 600 | 582 | 127.8 |
| B | 12 | 32 | 126023 | 981.48 | 600 | 582 | 127.8 |
| B | 5 | 185 | 50779 | 392.75 | 600 | 582 | 127.8 |
| C | 15 | 198 | 11584300 | 164214.48 | 248 | 245 | 70.5 |
| C | 2 | 12 | 237459 | 3362.72 | 248 | 245 | 70.5 |
| C | 7 | 80 | 138590 | 1961.17 | 248 | 245 | 70.5 |
| D | 8 | 176 | 2103482 | 13897.85 | 528 | 505 | 151.3 |
| D | 2 | 153 | 581574 | 3840.09 | 528 | 505 | 151.3 |
| D | 10 | 172 | 530665 | 3503.65 | 528 | 505 | 151.3 |
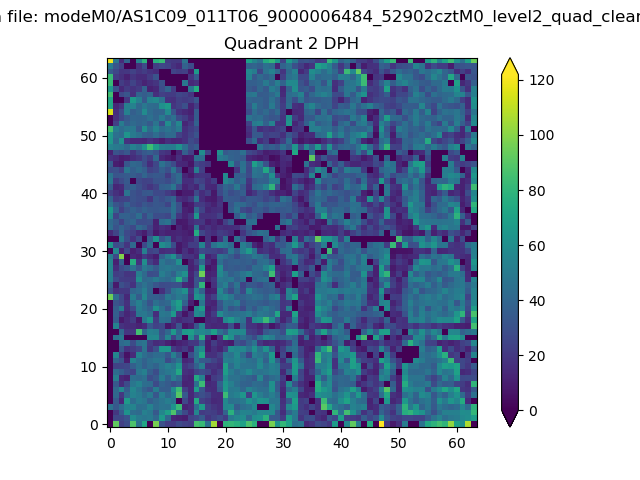
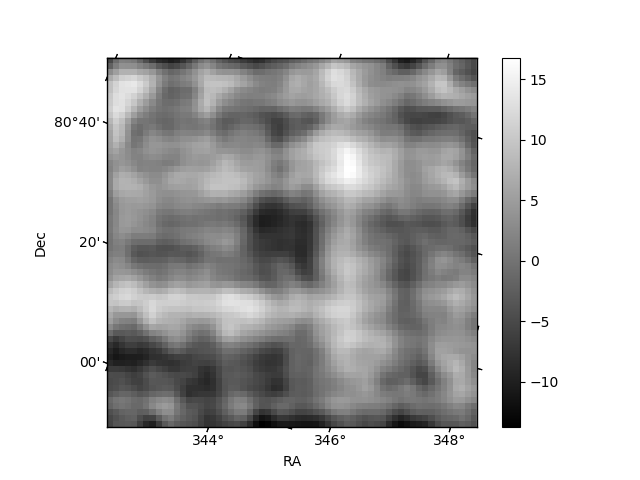
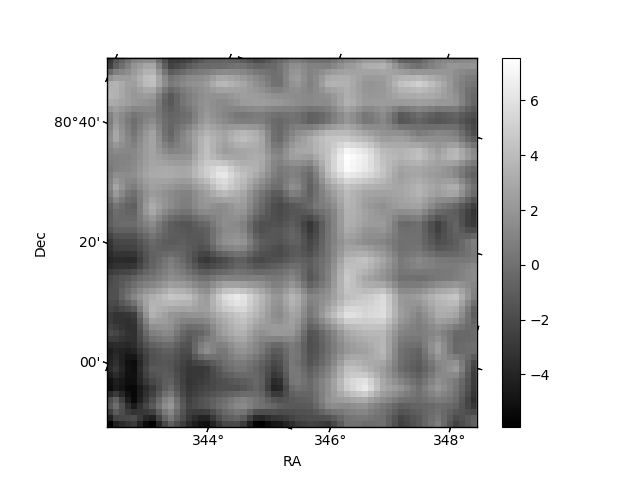
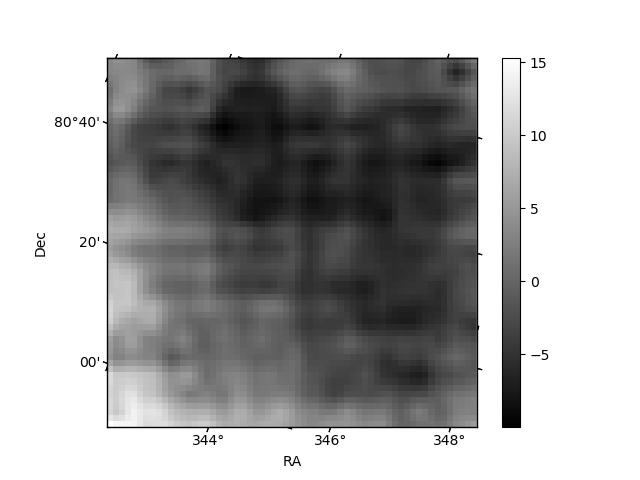
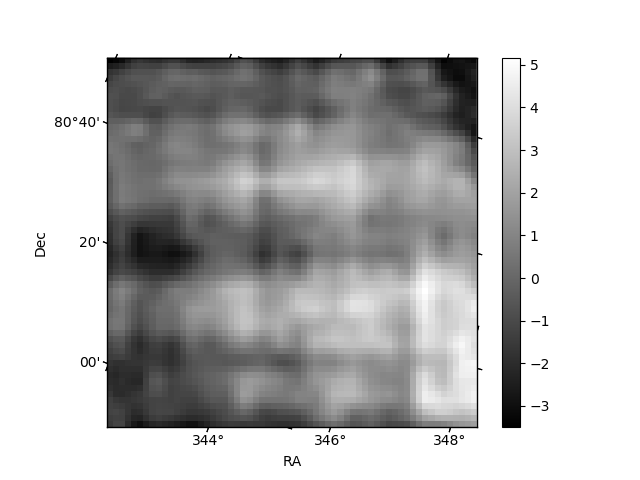
Histogram calculated using DETX and DETY for each event in the final _common_clean file
| Quadrant A | 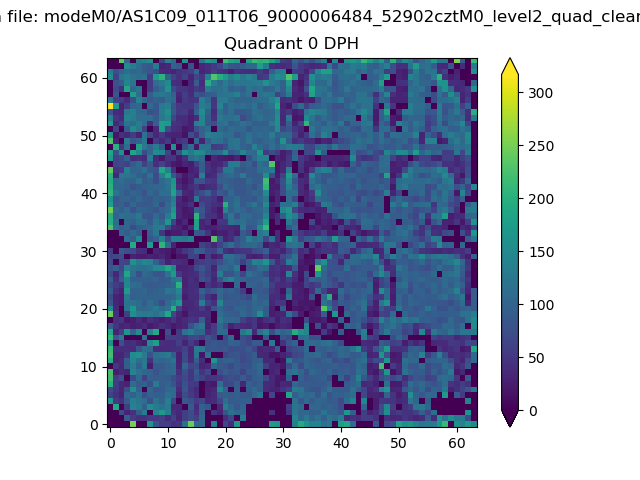 |
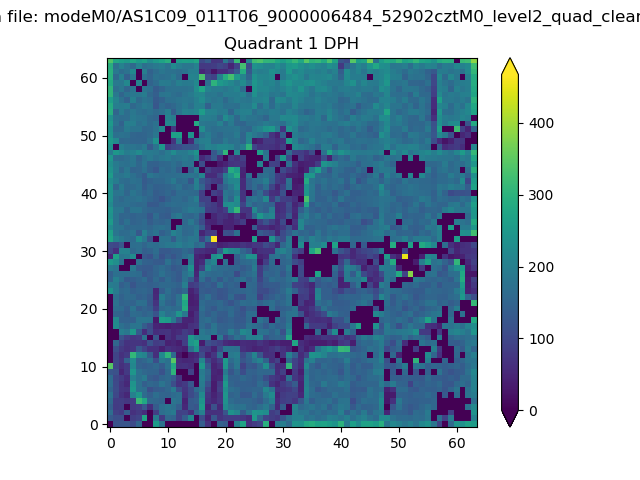 |
Quadrant B |
|---|---|---|---|
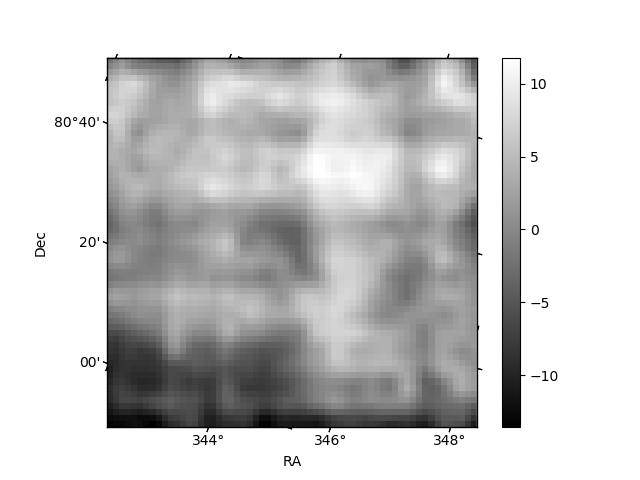
| Quadrant D | 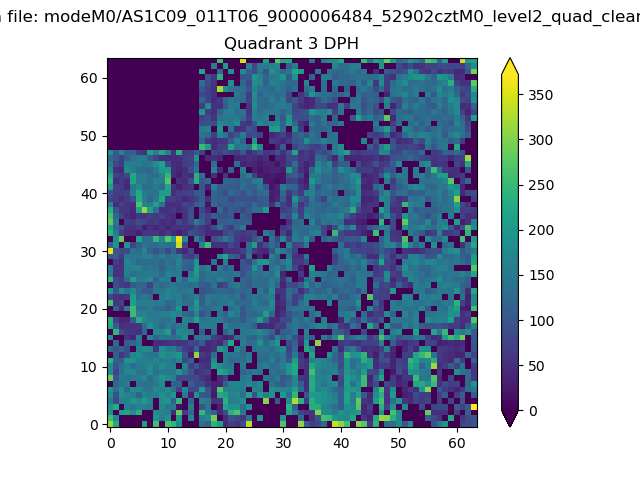 |
 |
Quadrant C |
| Plot type | Count rate plots | Images |
|---|---|---|
| Comparison with Poisson distribution Blue bars denote a histogram of data divided into 1 sec bins. Red curve is a Poisson curve with rate = median count rate of data. |
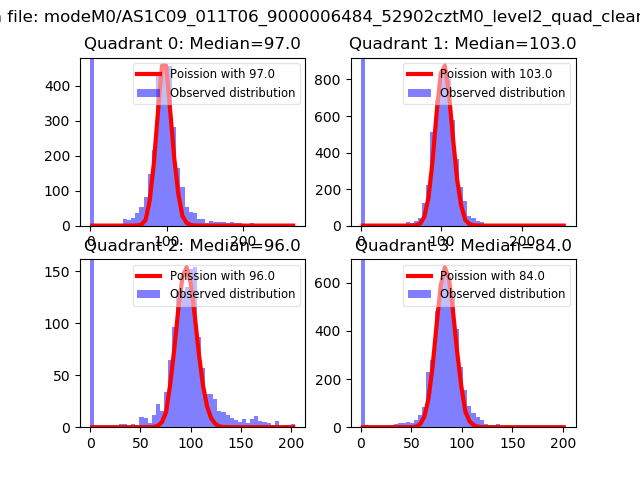 |
 |
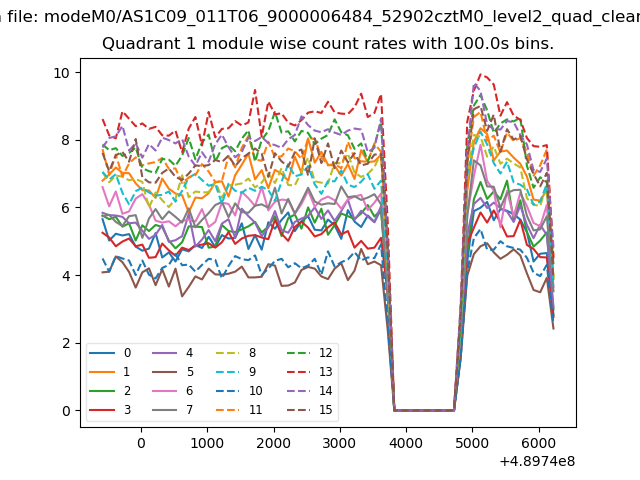
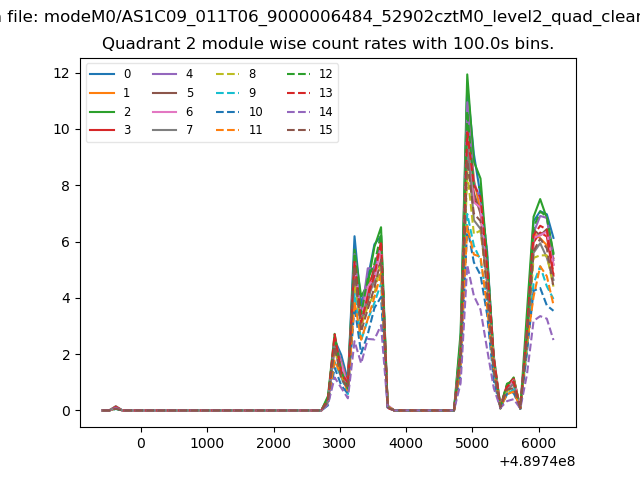
| Quadrant-wise count rates Data is divided into 100 sec bins |
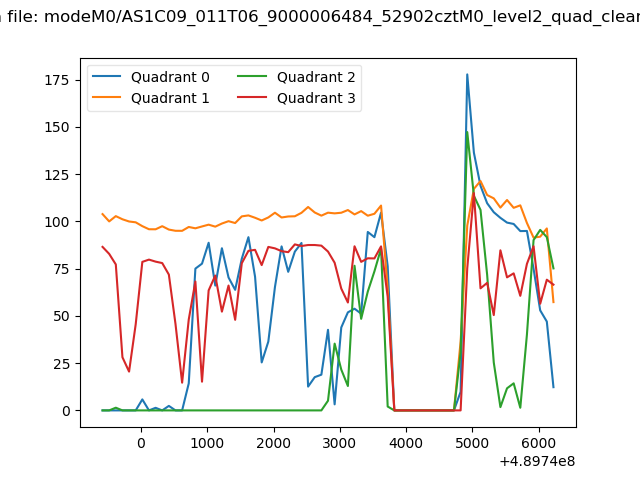 |
|
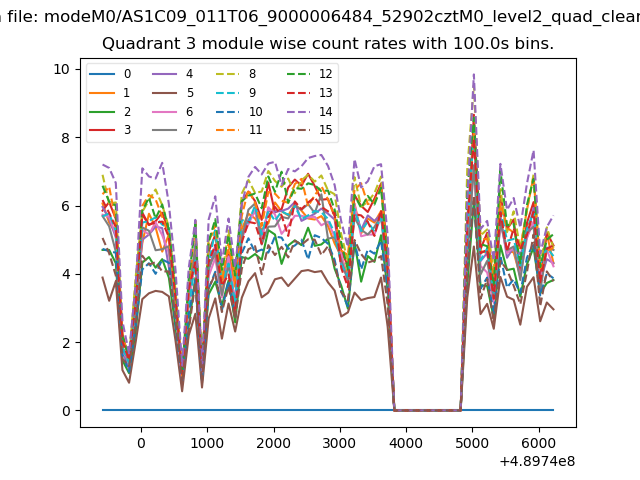
| Module-wise count rates for Quadrant A Data is divided into 100 sec bins |
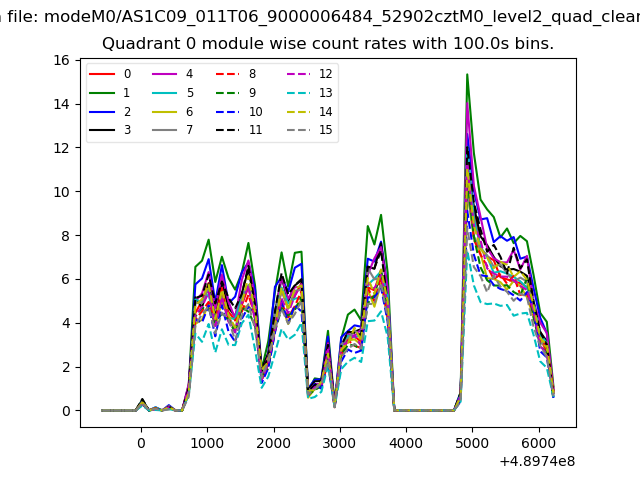 |
 |
| Module-wise count rates for Quadrant B Data is divided into 100 sec bins |
 |
 |
| Module-wise count rates for Quadrant C Data is divided into 100 sec bins |
 |
 |
| Module-wise count rates for Quadrant D Data is divided into 100 sec bins |
 |
 |
| Parameter | Plot |
|---|---|
| CZT HV Monitor | 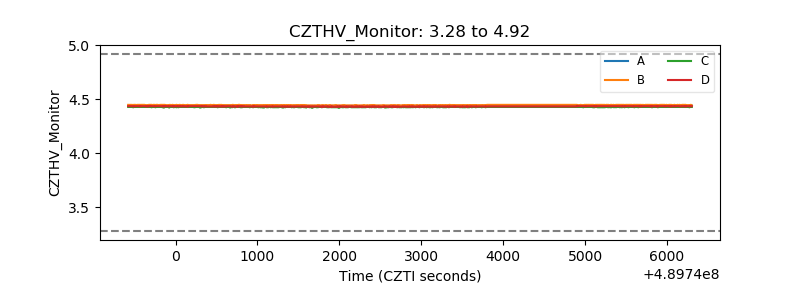 |
| D_VDD | 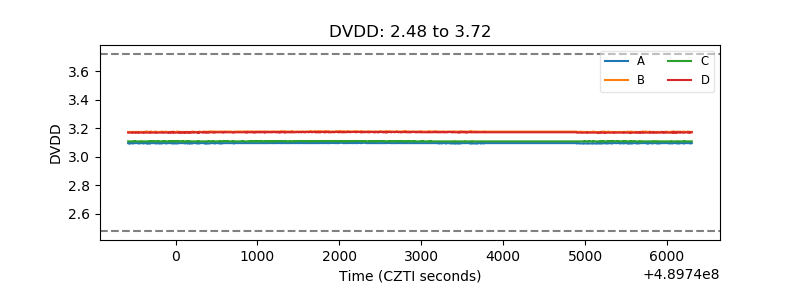 |
| Temperature 1 | 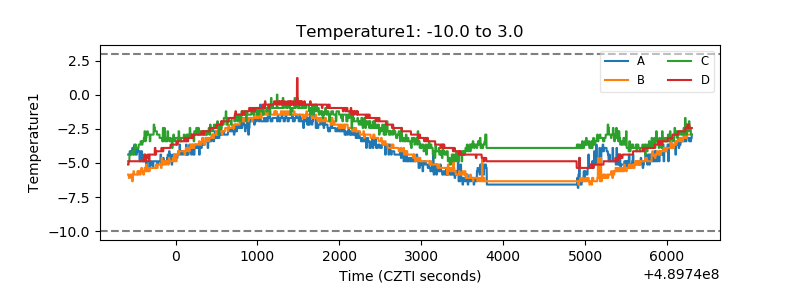 |
| Veto HV Monitor | 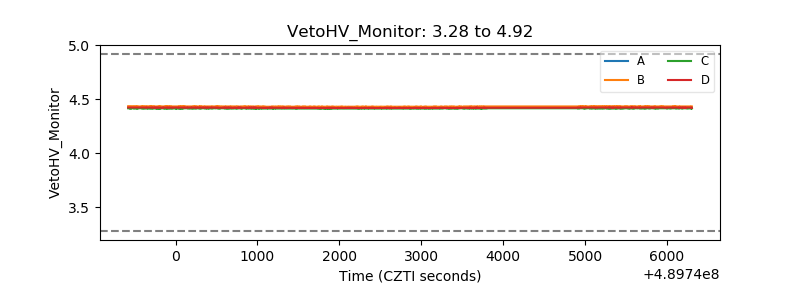 |
| Veto LLD | 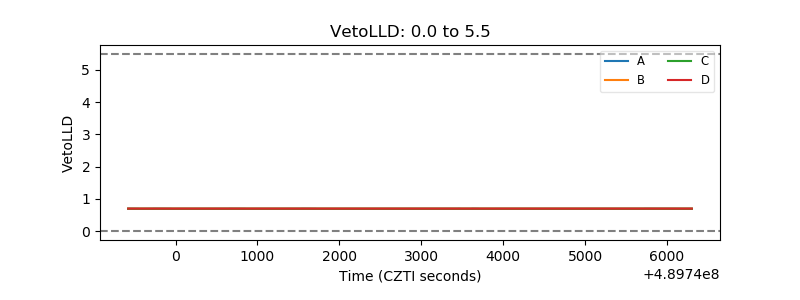 |
| Alpha Counter | 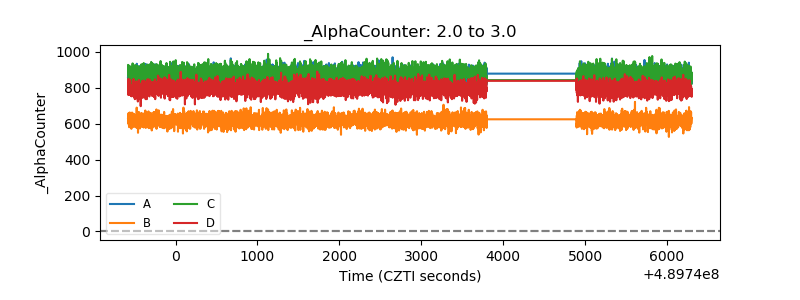 |
| _CPM_Rate | 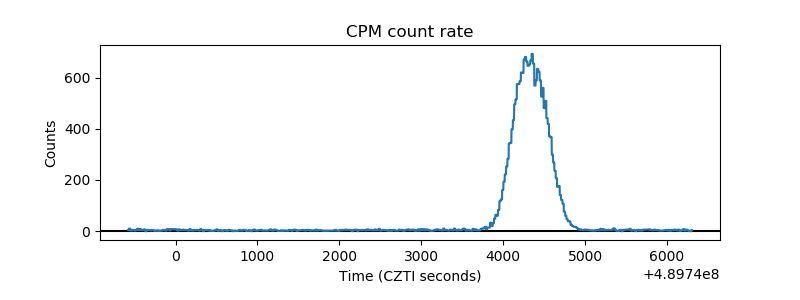 |
| CZT Counter | 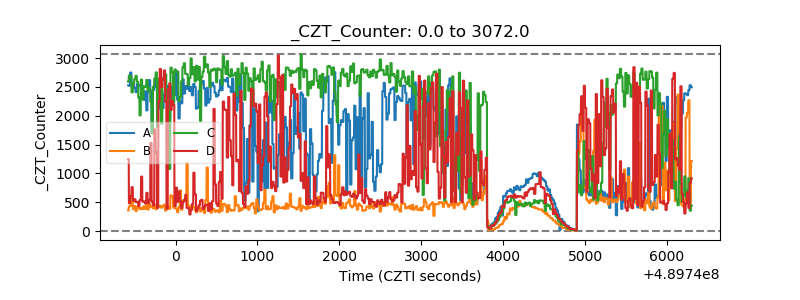 |
| +2.5 Volts monitor |  |
| +5 Volts monitor |  |
| _ROLL_ROT | 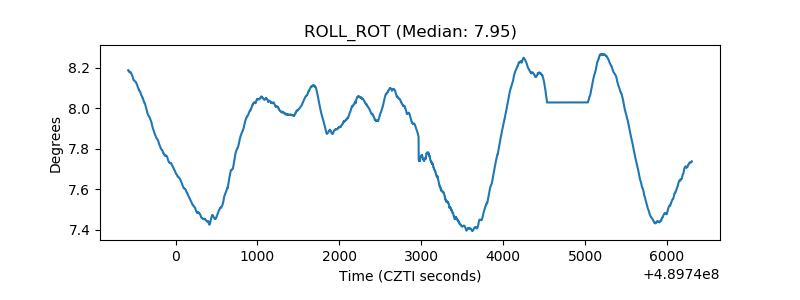 |
| _Roll_DEC | 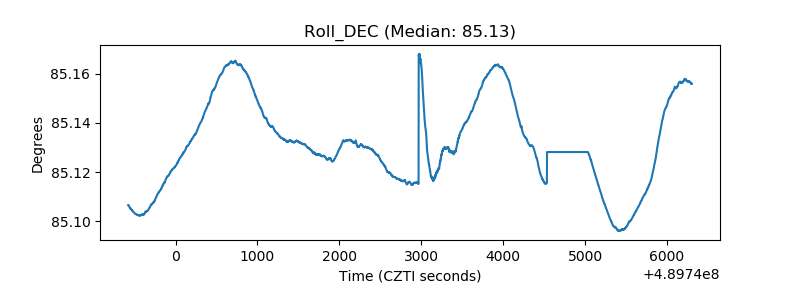 |
| _Roll_RA | 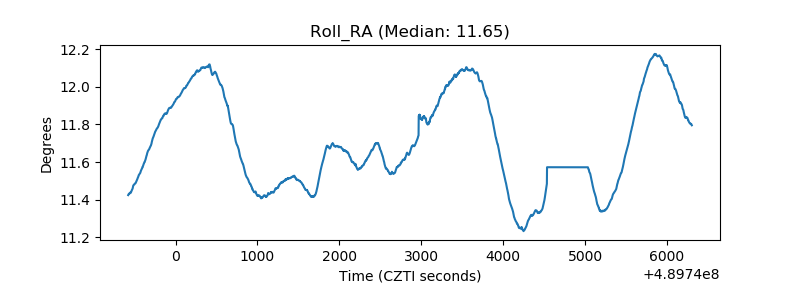 |
| Veto Counter | 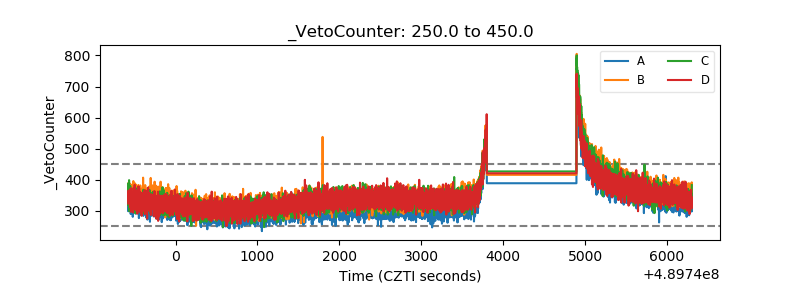 |