| Param | Original file | Final file |
|---|---|---|
| Filename | modeM0/AS1C09_011T06_9000006484_52903cztM0_level2.fits | modeM0/AS1C09_011T06_9000006484_52903cztM0_level2_quad_clean.evt |
| Size (bytes) | 1,011,600,000 | 66,585,600 |
| Size | 964.7 MB | 63.5 MB |
| Events in quadrant A | 12,553,702 | 210,593 |
| Events in quadrant B | 4,498,102 | 654,592 |
| Events in quadrant C | 11,799,759 | 260,369 |
| Events in quadrant D | 8,106,389 | 448,974 |
| Mode M9 | |||
|---|---|---|---|
| Quadrant | BADHDUFLAG | Total packets | Discarded packets |
| A | 0 | 12 | 0 |
| B | 0 | 12 | 0 |
| C | 0 | 12 | 0 |
| D | 0 | 12 | 0 |
| Mode M0 | |||
|---|---|---|---|
| Quadrant | BADHDUFLAG | Total packets | Discarded packets |
| A | 0 | 41522 | 1 |
| B | 0 | 17638 | 2 |
| C | 0 | 39445 | 1 |
| D | 0 | 28476 | 3 |
| Mode SS | |||
|---|---|---|---|
| Quadrant | BADHDUFLAG | Total packets | Discarded packets |
| A | 0 | 128 | 0 |
| B | 0 | 128 | 0 |
| C | 0 | 128 | 0 |
| D | 0 | 128 | 0 |
| Quadrant | Total seconds | Saturated seconds | Saturation percentage |
|---|---|---|---|
| A | 6322 | 4474 | 70.768744% |
| B | 6322 | 300 | 4.745334% |
| C | 6323 | 3841 | 60.746481% |
| D | 6322 | 1654 | 26.162607% |
Noise dominated data is calculated using 1-second bins in cleaned event files. If a bin has >2000 counts, and if more than 50% of those come from <1% of pixels, then it is considered to be noise-dominated and hence unusable.
| Quadrant | # 1 sec bins | Bins with >0 counts | Bins with >2000 counts | High rate bins dominated by noise | Noise dominated (total time) | Noise dominated (detector-on time) | Marked lightcurve |
|---|---|---|---|---|---|---|---|
| A | 7507 | 6323 | 4249 | 4249 | 56.60% | 67.20% | 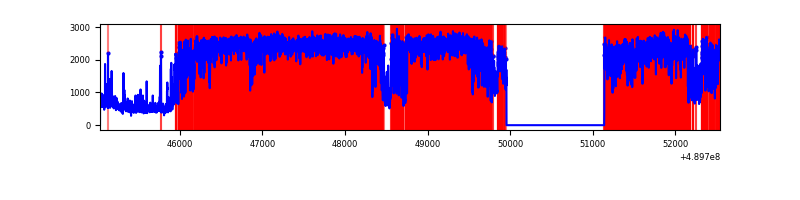 |
| B | 7508 | 6324 | 147 | 147 | 1.96% | 2.32% | 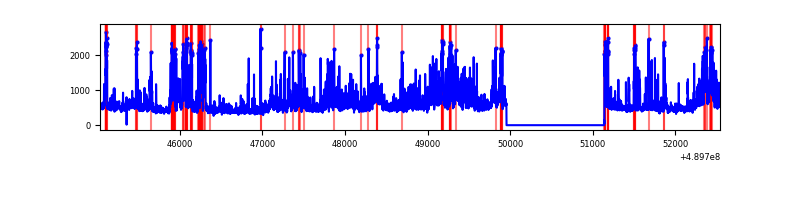 |
| C | 7508 | 6324 | 3799 | 3799 | 50.60% | 60.07% | 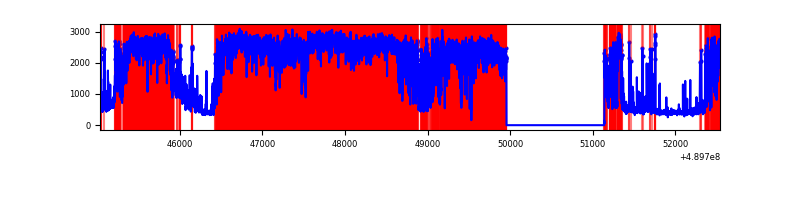 |
| D | 7507 | 6323 | 1575 | 1575 | 20.98% | 24.91% | 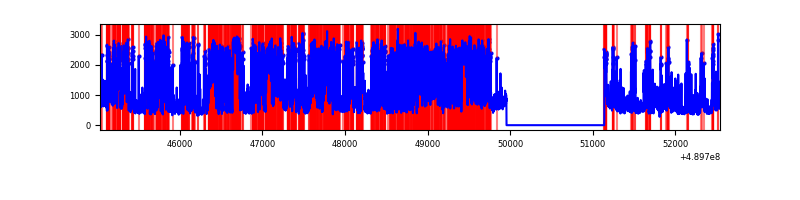 |
Top three noisy pixels from each quadrant. If the there are fewer than three noisy pixels in the level2.evt file, extra rows are filled as -1
| Pixel properties | Quadrant properties | ||||||
|---|---|---|---|---|---|---|---|
| Quadrant | DetID | PixID | Counts | Sigma | Mean | Median | Sigma |
| A | 9 | 191 | 9952114 | 93903.23 | 422 | 413 | 106.0 |
| A | 12 | 17 | 203431 | 1915.66 | 422 | 413 | 106.0 |
| A | 12 | 80 | 195234 | 1838.31 | 422 | 413 | 106.0 |
| B | 1 | 255 | 717712 | 5144.34 | 662 | 640 | 139.4 |
| B | 12 | 32 | 698713 | 5008.04 | 662 | 640 | 139.4 |
| B | 5 | 185 | 67281 | 478.09 | 662 | 640 | 139.4 |
| C | 15 | 198 | 8581872 | 69215.27 | 441 | 437 | 124.0 |
| C | 2 | 12 | 747155 | 6022.8 | 441 | 437 | 124.0 |
| C | 7 | 80 | 379827 | 3060.05 | 441 | 437 | 124.0 |
| D | 8 | 176 | 3299917 | 19525.82 | 584 | 556 | 169.0 |
| D | 10 | 172 | 718074 | 4246.32 | 584 | 556 | 169.0 |
| D | 15 | 174 | 451701 | 2669.9 | 584 | 556 | 169.0 |
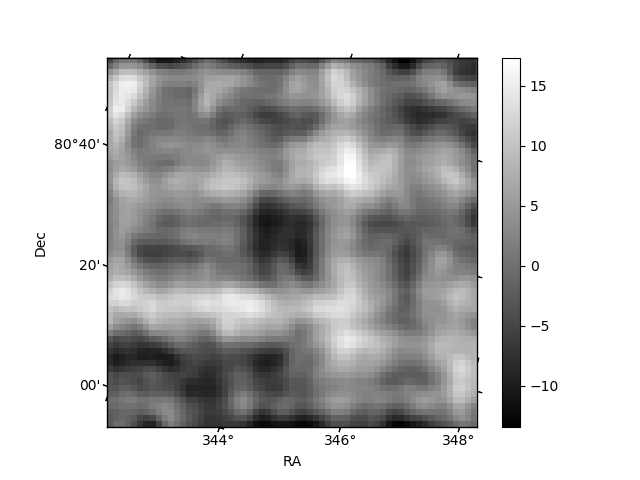
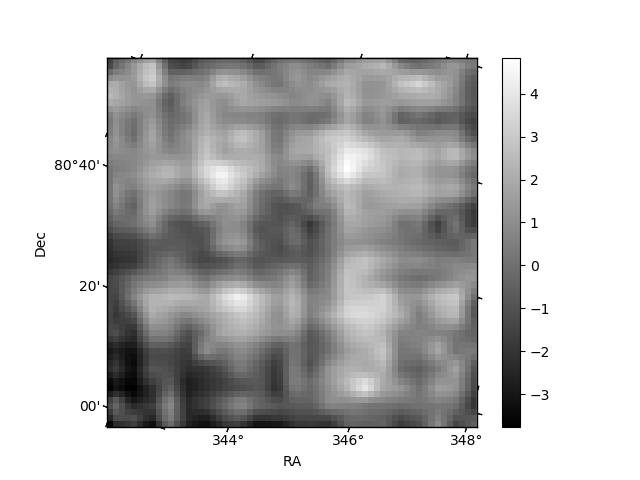
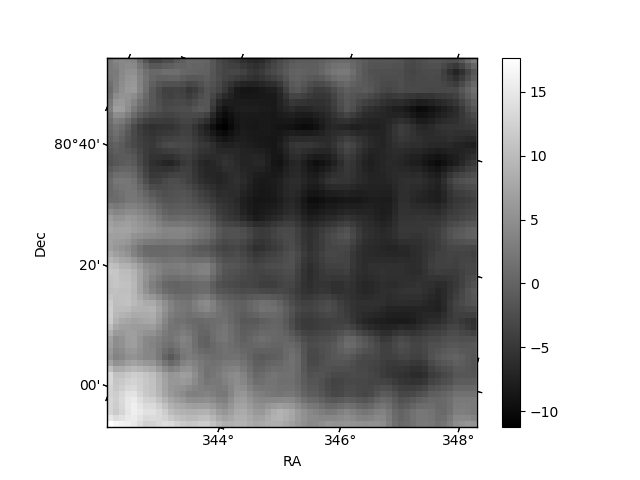
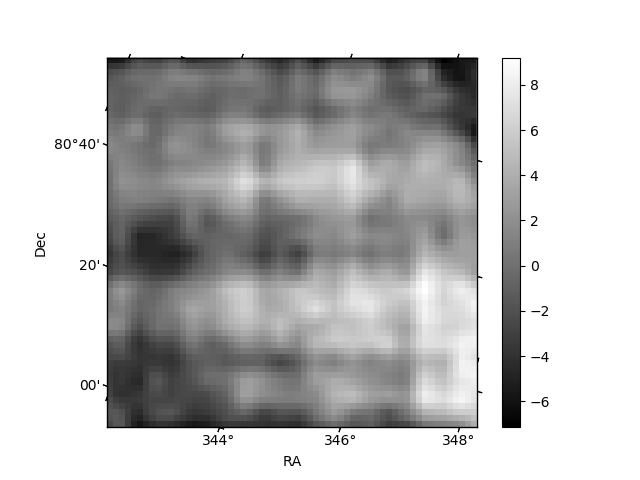
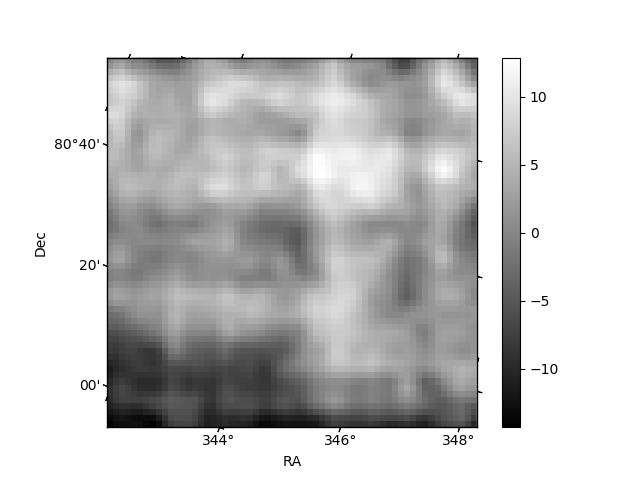
Histogram calculated using DETX and DETY for each event in the final _common_clean file
| Quadrant A | 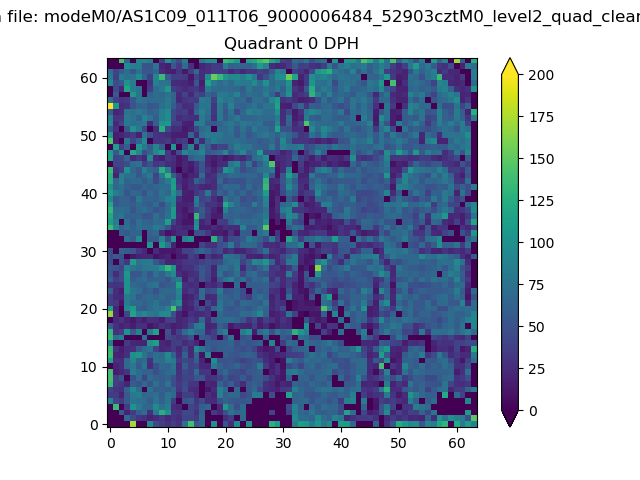 |
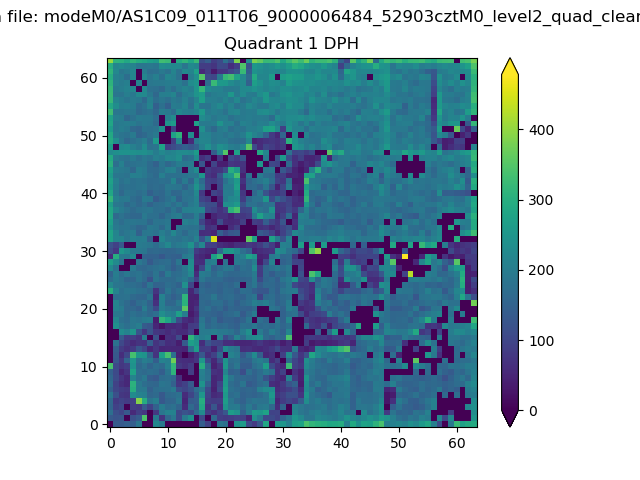 |
Quadrant B |
|---|---|---|---|
| Quadrant D | 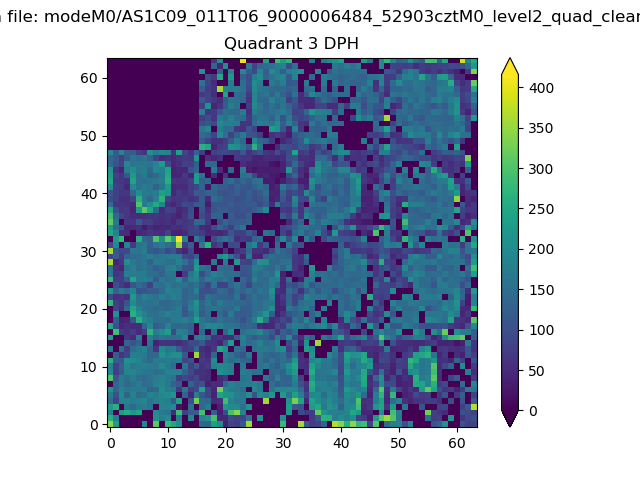 |
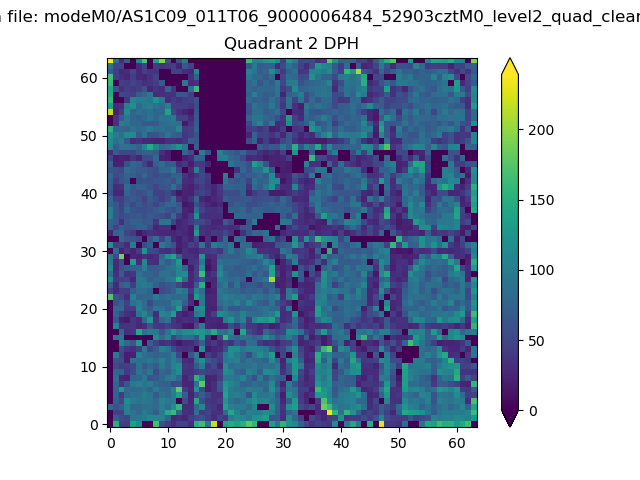 |
Quadrant C |
| Plot type | Count rate plots | Images |
|---|---|---|
| Comparison with Poisson distribution Blue bars denote a histogram of data divided into 1 sec bins. Red curve is a Poisson curve with rate = median count rate of data. |
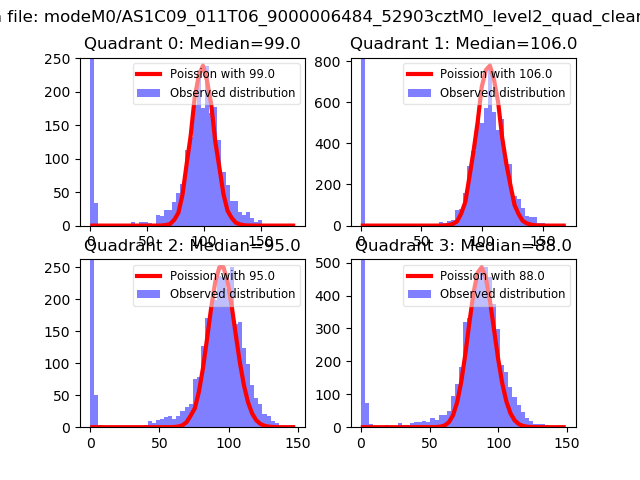 |
 |
| Quadrant-wise count rates Data is divided into 100 sec bins |
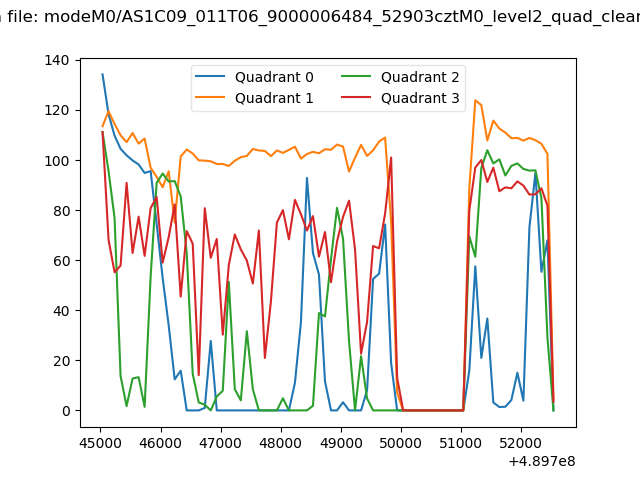 |
|
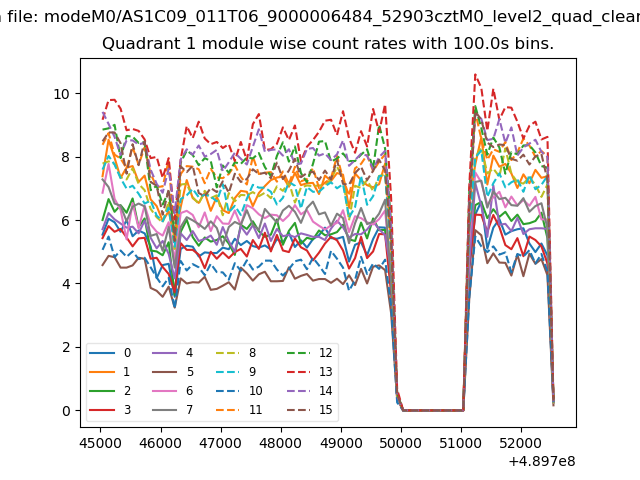
| Module-wise count rates for Quadrant A Data is divided into 100 sec bins |
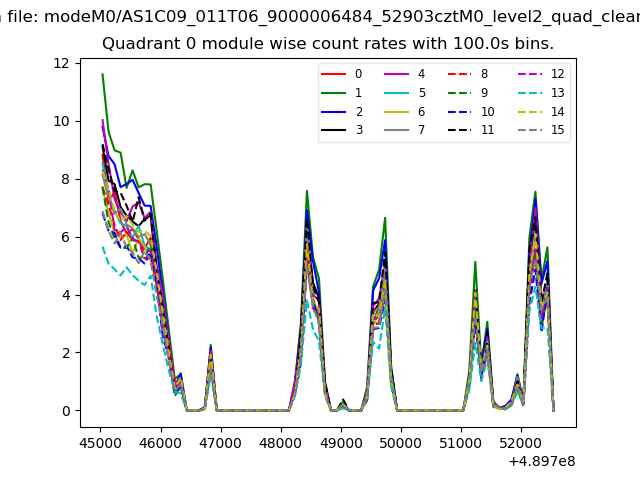 |
 |
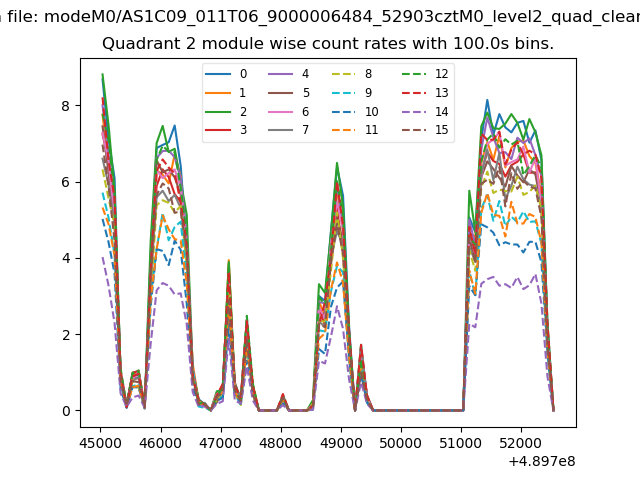
| Module-wise count rates for Quadrant B Data is divided into 100 sec bins |
 |
 |
| Module-wise count rates for Quadrant C Data is divided into 100 sec bins |
 |
 |
| Module-wise count rates for Quadrant D Data is divided into 100 sec bins |
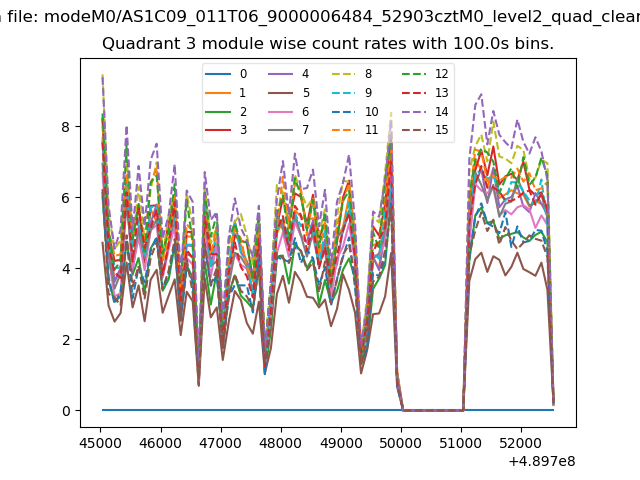 |
 |
| Parameter | Plot |
|---|---|
| CZT HV Monitor | 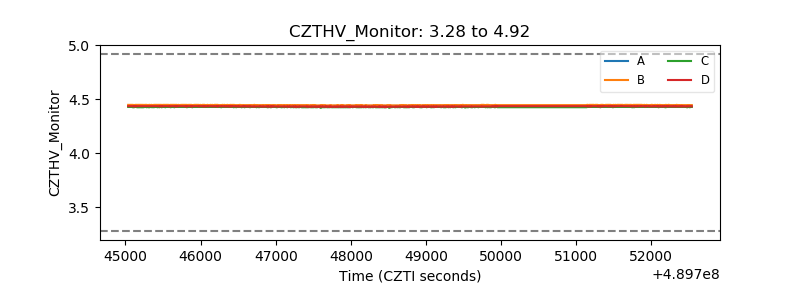 |
| D_VDD | 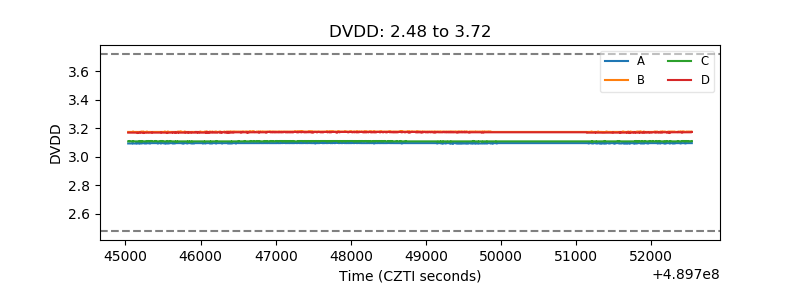 |
| Temperature 1 | 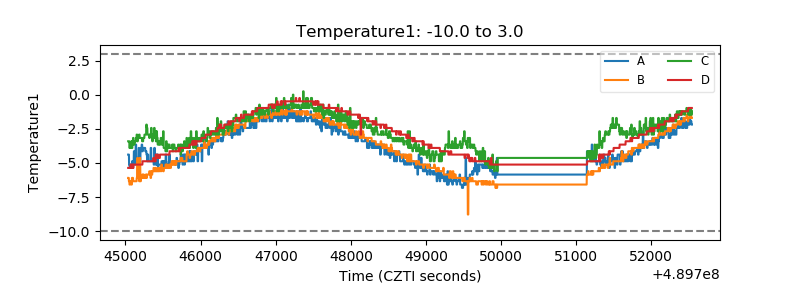 |
| Veto HV Monitor | 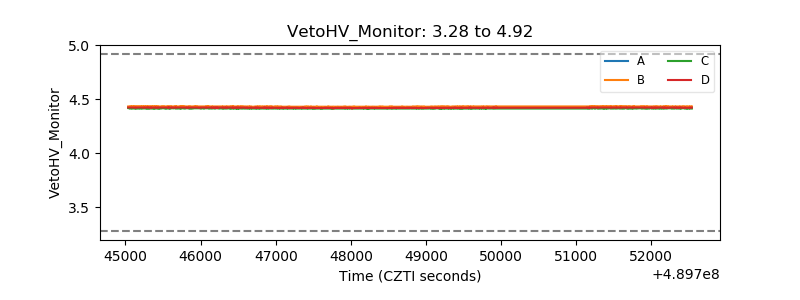 |
| Veto LLD | 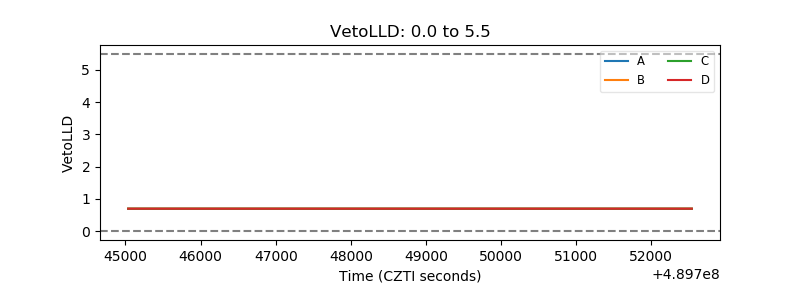 |
| Alpha Counter | 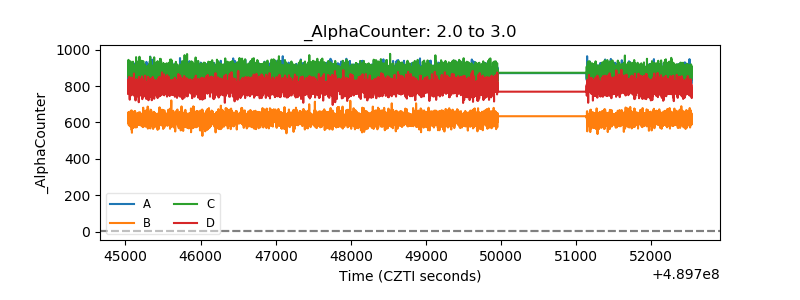 |
| _CPM_Rate | 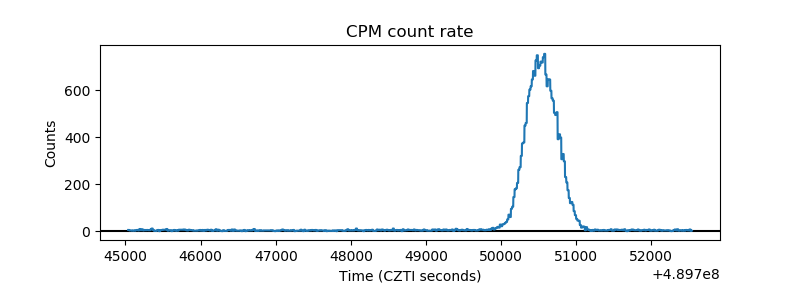 |
| CZT Counter | 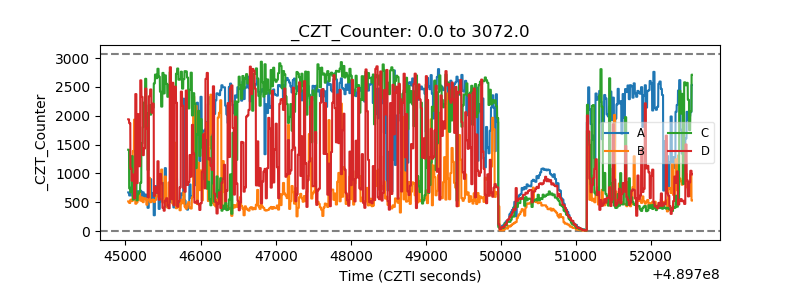 |
| +2.5 Volts monitor |  |
| +5 Volts monitor |  |
| _ROLL_ROT | 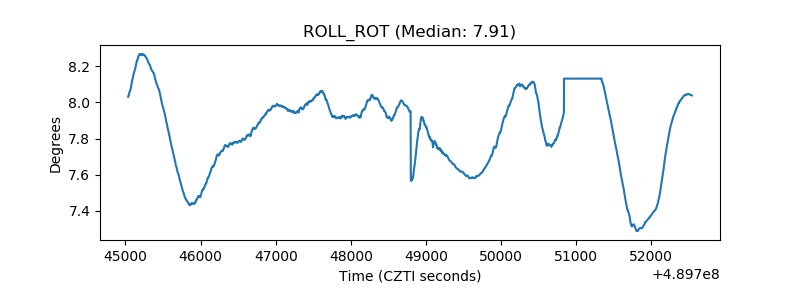 |
| _Roll_DEC | 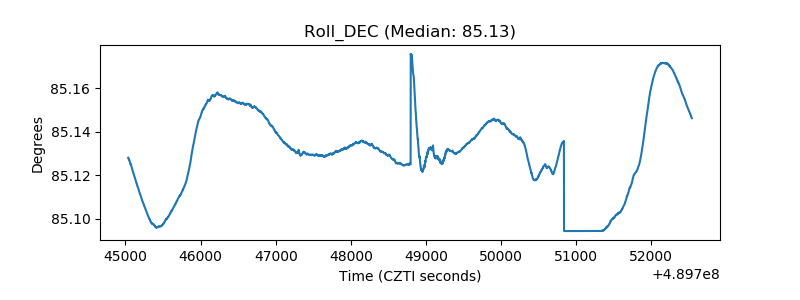 |
| _Roll_RA | 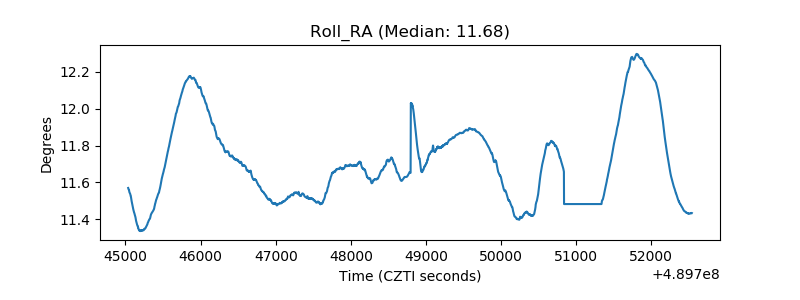 |
| Veto Counter | 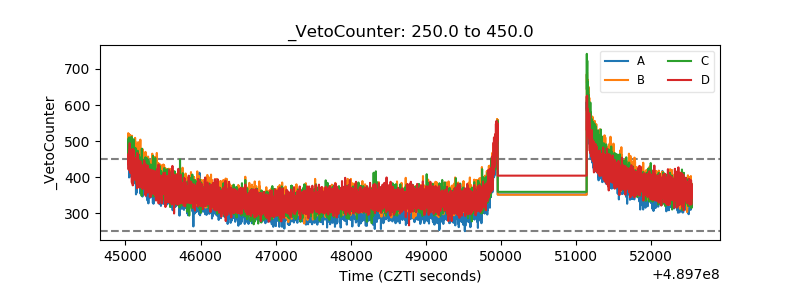 |