| Param | Original file | Final file |
|---|---|---|
| Filename | modeM0/AS1C09_011T06_9000006484_52905cztM0_level2.fits | modeM0/AS1C09_011T06_9000006484_52905cztM0_level2_quad_clean.evt |
| Size (bytes) | 826,646,400 | 71,029,440 |
| Size | 788.4 MB | 67.7 MB |
| Events in quadrant A | 15,801,384 | 8,470 |
| Events in quadrant B | 3,133,108 | 657,377 |
| Events in quadrant C | 4,734,046 | 536,928 |
| Events in quadrant D | 6,439,678 | 505,767 |
| Mode M9 | |||
|---|---|---|---|
| Quadrant | BADHDUFLAG | Total packets | Discarded packets |
| A | 0 | 11 | 0 |
| B | 0 | 11 | 0 |
| C | 0 | 11 | 0 |
| D | 0 | 11 | 0 |
| Mode M0 | |||
|---|---|---|---|
| Quadrant | BADHDUFLAG | Total packets | Discarded packets |
| A | 0 | 51106 | 1 |
| B | 0 | 13735 | 1 |
| C | 0 | 18575 | 3 |
| D | 0 | 23486 | 1 |
| Mode SS | |||
|---|---|---|---|
| Quadrant | BADHDUFLAG | Total packets | Discarded packets |
| A | 0 | 128 | 0 |
| B | 0 | 128 | 0 |
| C | 0 | 128 | 0 |
| D | 0 | 128 | 0 |
| Quadrant | Total seconds | Saturated seconds | Saturation percentage |
|---|---|---|---|
| A | 6334 | 6274 | 99.052731% |
| B | 6334 | 130 | 2.052416% |
| C | 6334 | 620 | 9.788443% |
| D | 6334 | 837 | 13.214398% |
Noise dominated data is calculated using 1-second bins in cleaned event files. If a bin has >2000 counts, and if more than 50% of those come from <1% of pixels, then it is considered to be noise-dominated and hence unusable.
| Quadrant | # 1 sec bins | Bins with >0 counts | Bins with >2000 counts | High rate bins dominated by noise | Noise dominated (total time) | Noise dominated (detector-on time) | Marked lightcurve |
|---|---|---|---|---|---|---|---|
| A | 7444 | 6335 | 6086 | 6086 | 81.76% | 96.07% | 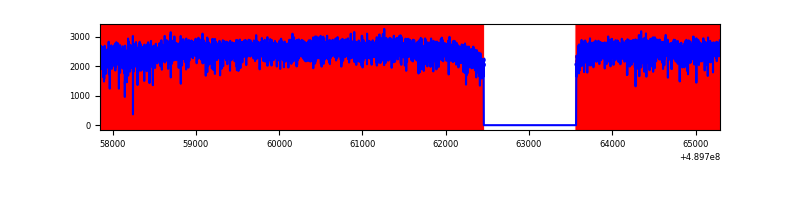 |
| B | 7444 | 6335 | 22 | 22 | 0.30% | 0.35% | 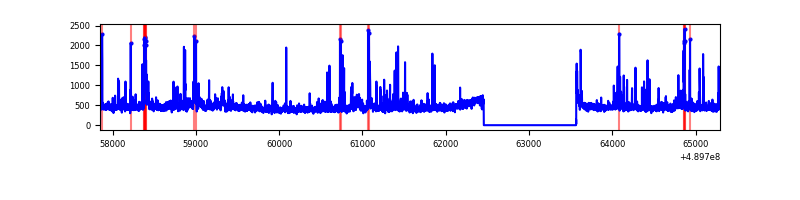 |
| C | 7444 | 6335 | 502 | 502 | 6.74% | 7.92% | 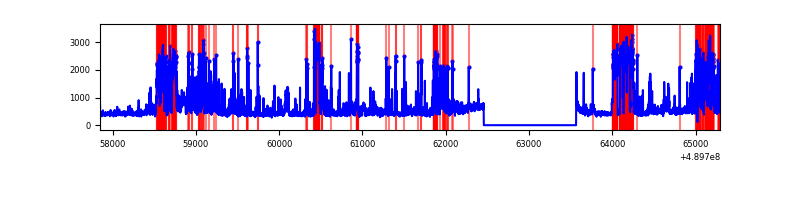 |
| D | 7444 | 6335 | 779 | 779 | 10.46% | 12.30% | 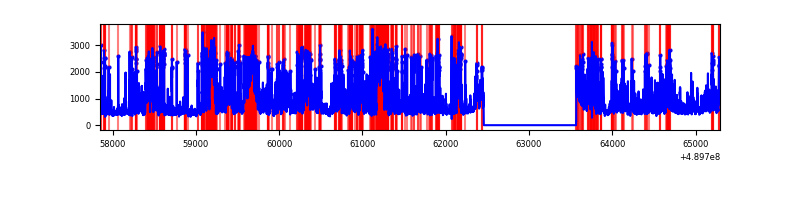 |
Top three noisy pixels from each quadrant. If the there are fewer than three noisy pixels in the level2.evt file, extra rows are filled as -1
| Pixel properties | Quadrant properties | ||||||
|---|---|---|---|---|---|---|---|
| Quadrant | DetID | PixID | Counts | Sigma | Mean | Median | Sigma |
| A | 9 | 191 | 14333073 | 258292.4 | 213 | 207 | 55.5 |
| A | 12 | 17 | 331428 | 5968.93 | 213 | 207 | 55.5 |
| A | 12 | 194 | 40774 | 731.06 | 213 | 207 | 55.5 |
| B | 1 | 255 | 100747 | 718.29 | 664 | 641 | 139.4 |
| B | 7 | 0 | 62741 | 445.59 | 664 | 641 | 139.4 |
| B | 4 | 158 | 59336 | 421.16 | 664 | 641 | 139.4 |
| C | 7 | 80 | 866694 | 5050.1 | 627 | 620 | 171.5 |
| C | 2 | 12 | 367400 | 2138.7 | 627 | 620 | 171.5 |
| C | 1 | 45 | 207816 | 1208.17 | 627 | 620 | 171.5 |
| D | 8 | 176 | 2132551 | 11809.18 | 628 | 597 | 180.5 |
| D | 15 | 125 | 888554 | 4918.51 | 628 | 597 | 180.5 |
| D | 7 | 96 | 148255 | 817.9 | 628 | 597 | 180.5 |
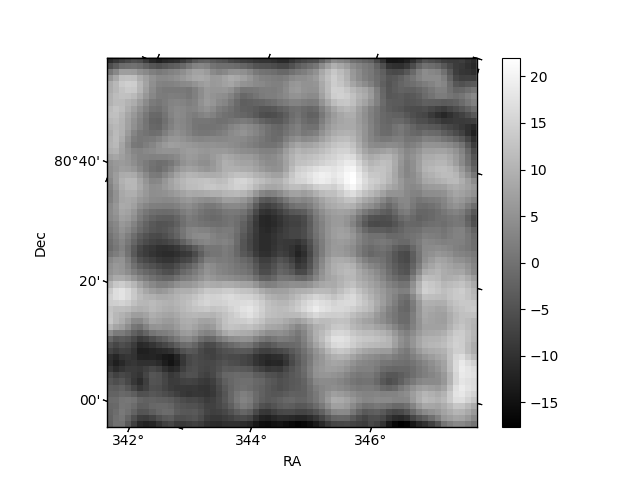
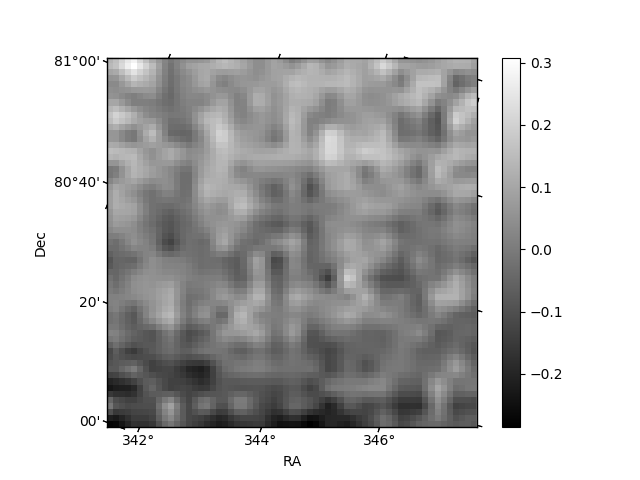
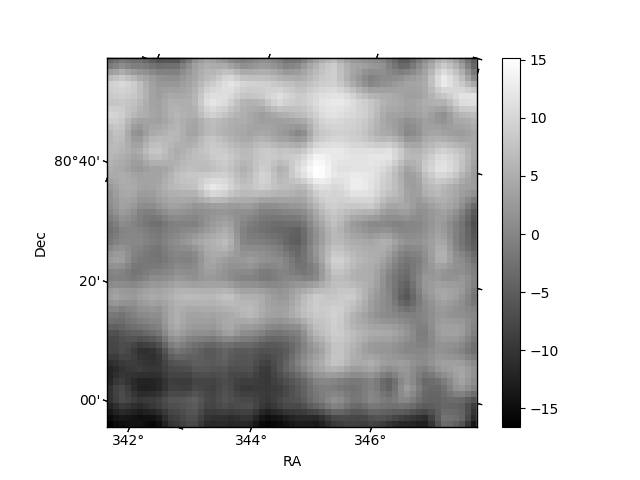
Histogram calculated using DETX and DETY for each event in the final _common_clean file
| Quadrant A | 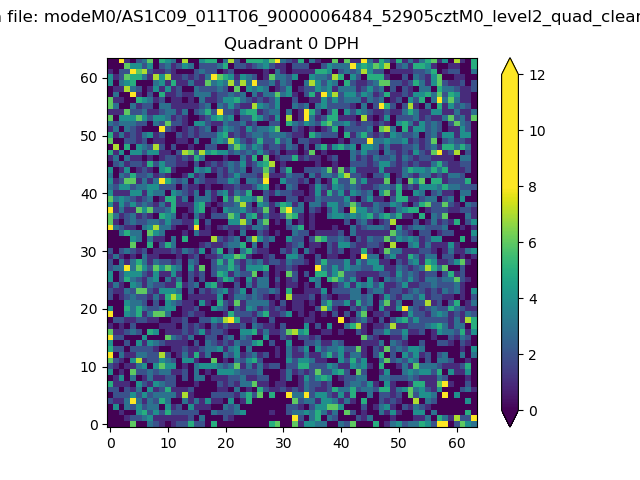 |
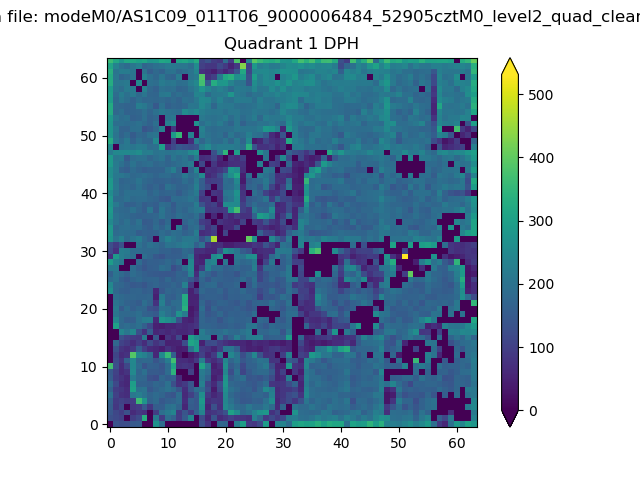 |
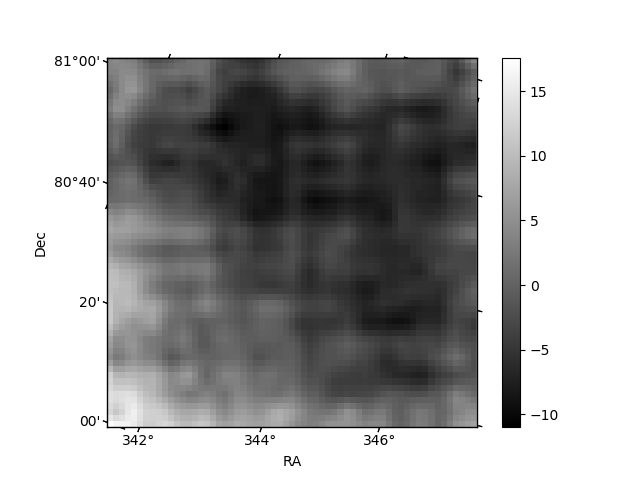
Quadrant B |
|---|---|---|---|
| Quadrant D | 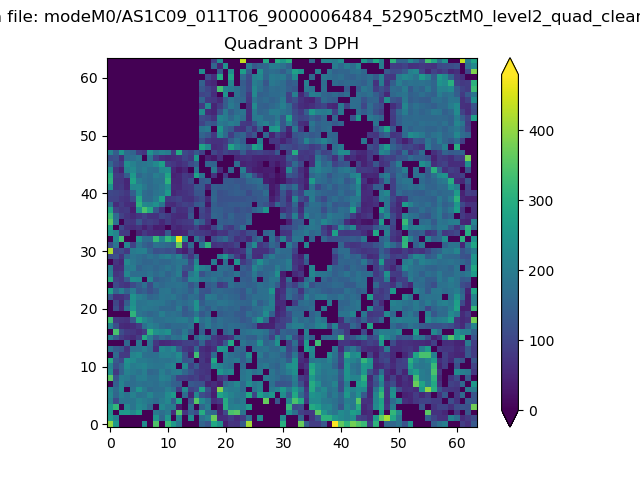 |
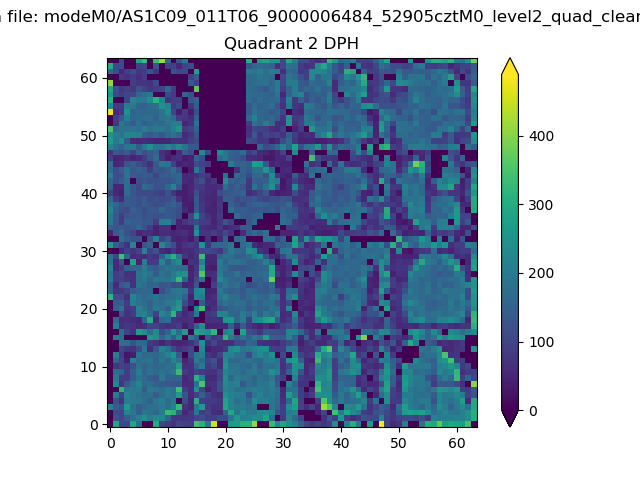 |
Quadrant C |
| Plot type | Count rate plots | Images |
|---|---|---|
| Comparison with Poisson distribution Blue bars denote a histogram of data divided into 1 sec bins. Red curve is a Poisson curve with rate = median count rate of data. |
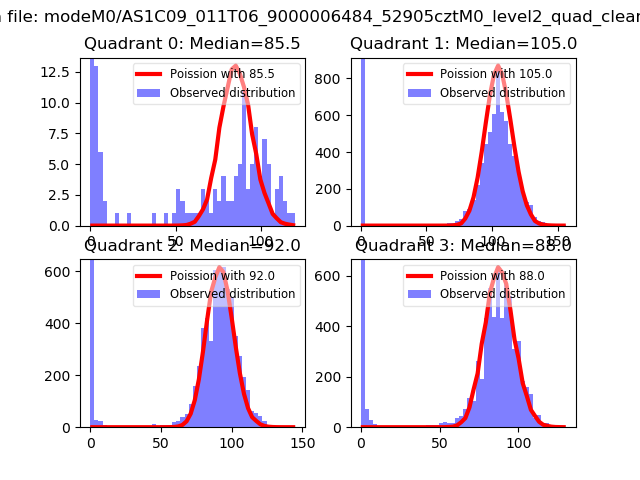 |
 |
| Quadrant-wise count rates Data is divided into 100 sec bins |
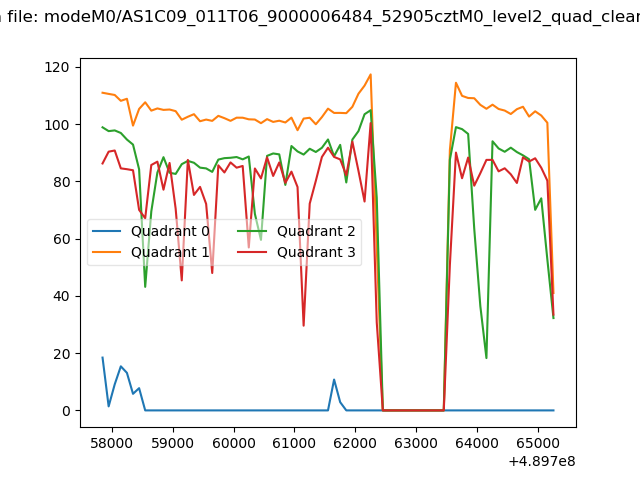 |
|
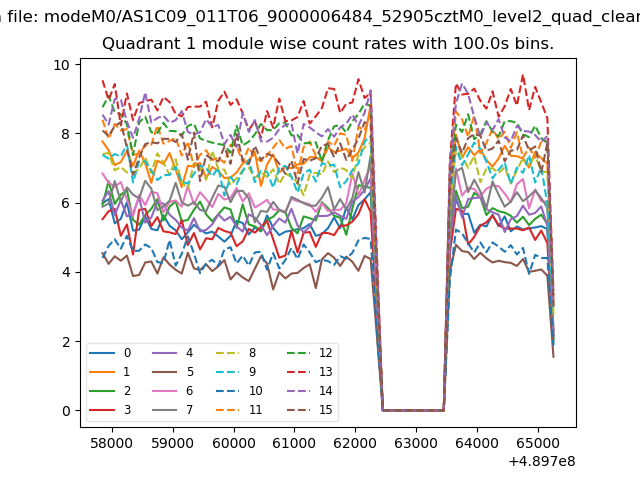
| Module-wise count rates for Quadrant A Data is divided into 100 sec bins |
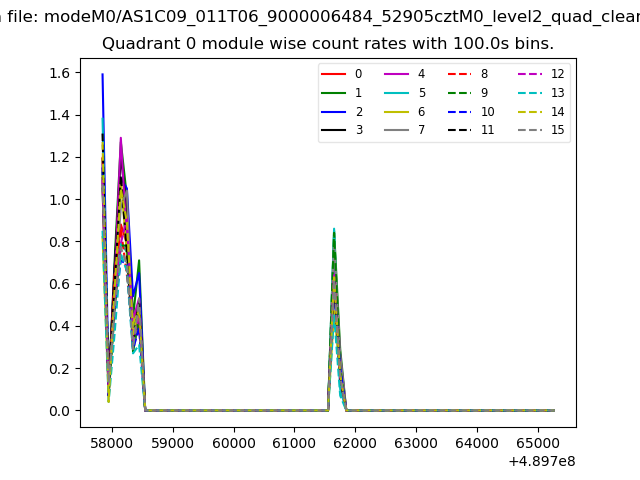 |
 |
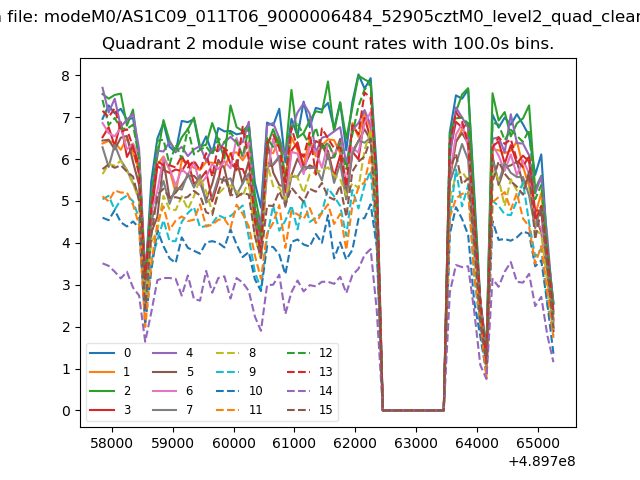
| Module-wise count rates for Quadrant B Data is divided into 100 sec bins |
 |
 |
| Module-wise count rates for Quadrant C Data is divided into 100 sec bins |
 |
 |
| Module-wise count rates for Quadrant D Data is divided into 100 sec bins |
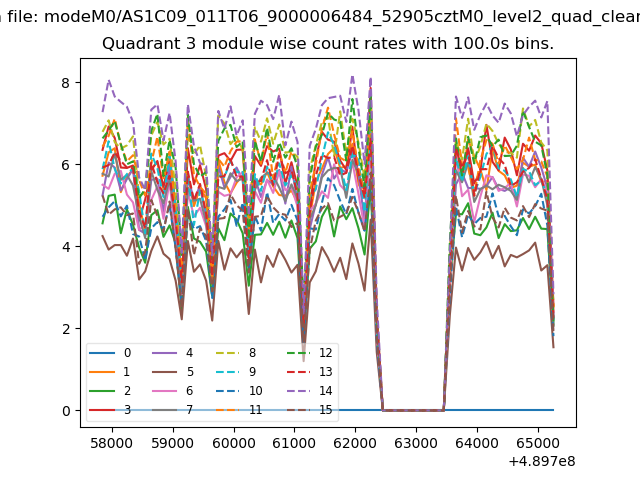 |
 |
| Parameter | Plot |
|---|---|
| CZT HV Monitor | 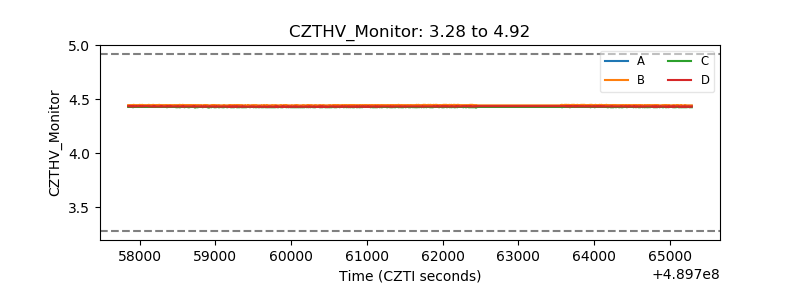 |
| D_VDD | 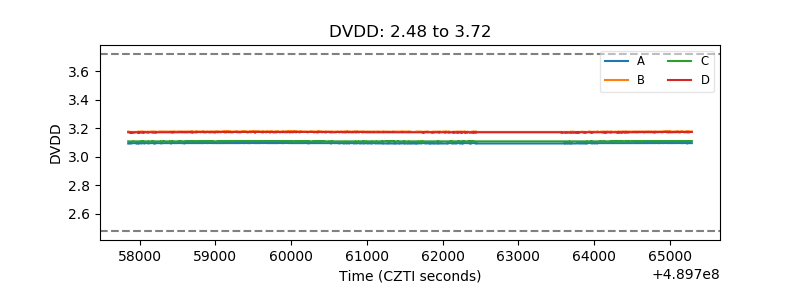 |
| Temperature 1 | 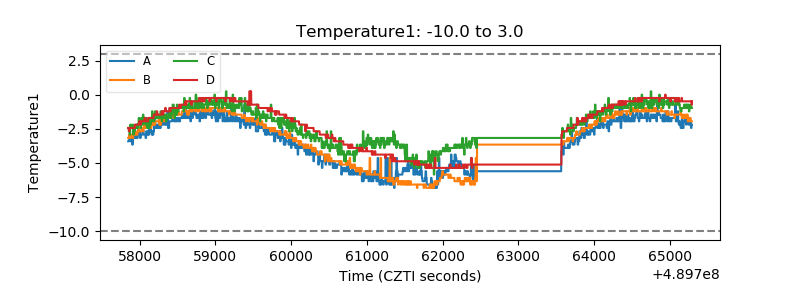 |
| Veto HV Monitor | 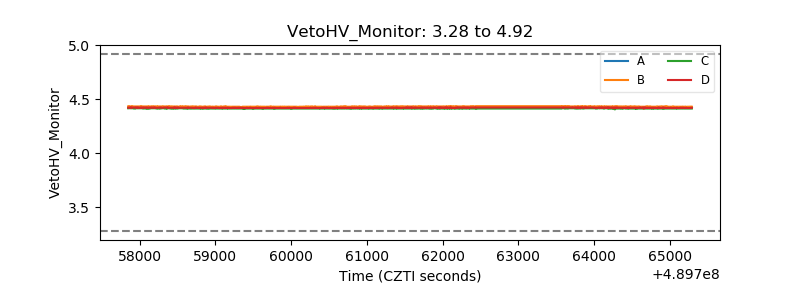 |
| Veto LLD | 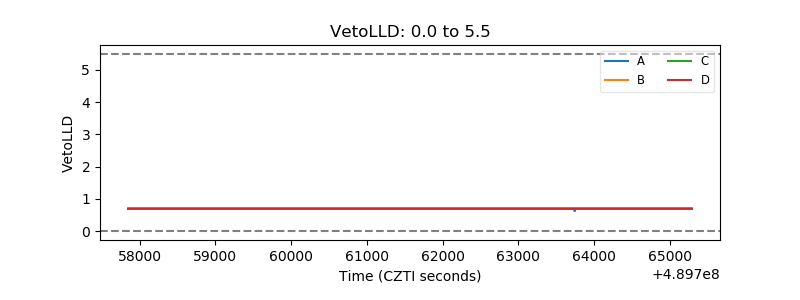 |
| Alpha Counter | 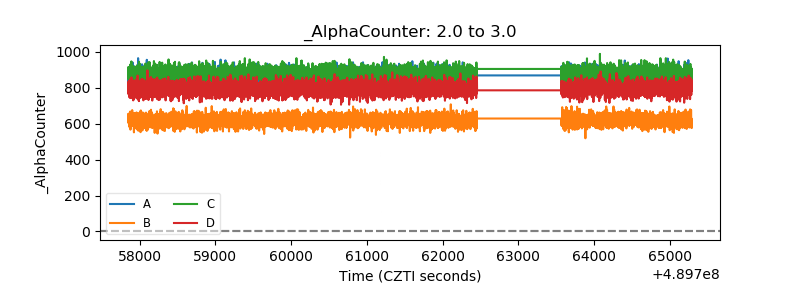 |
| _CPM_Rate | 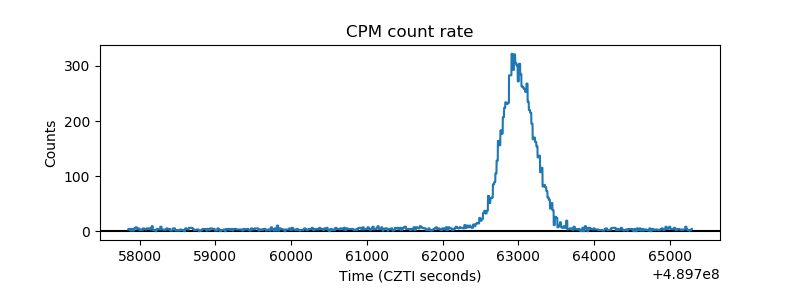 |
| CZT Counter | 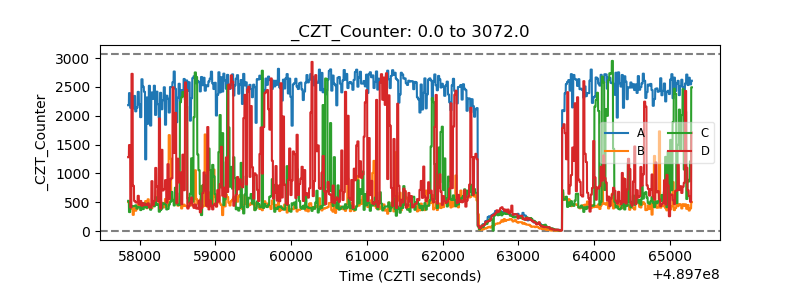 |
| +2.5 Volts monitor |  |
| +5 Volts monitor |  |
| _ROLL_ROT | 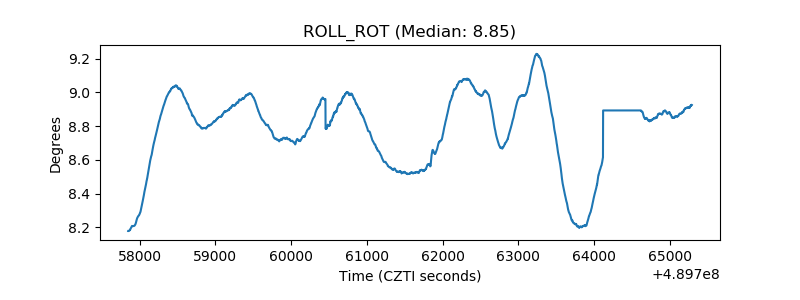 |
| _Roll_DEC | 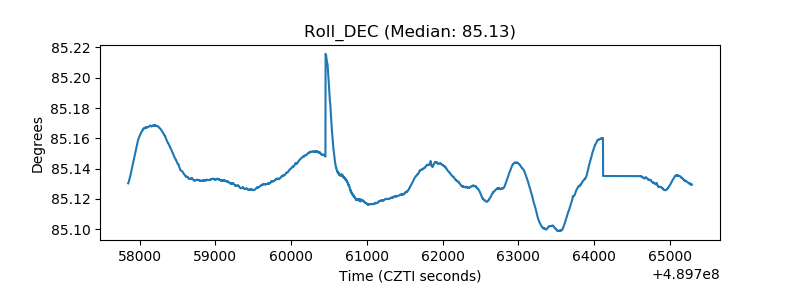 |
| _Roll_RA | 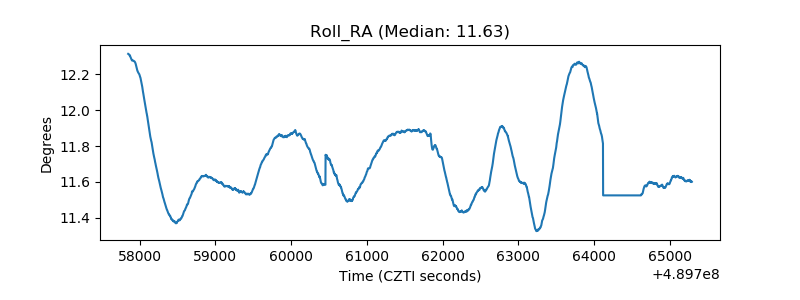 |
| Veto Counter | 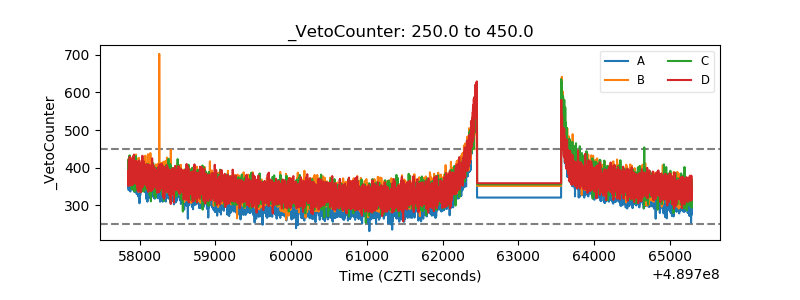 |