| Param | Original file | Final file |
|---|---|---|
| Filename | modeM0/AS1C09_011T06_9000006484_52906cztM0_level2.fits | modeM0/AS1C09_011T06_9000006484_52906cztM0_level2_quad_clean.evt |
| Size (bytes) | 764,455,680 | 66,686,400 |
| Size | 729.0 MB | 63.6 MB |
| Events in quadrant A | 14,585,622 | 19,993 |
| Events in quadrant B | 4,239,931 | 574,113 |
| Events in quadrant C | 3,669,916 | 519,081 |
| Events in quadrant D | 5,339,189 | 489,762 |
| Mode M9 | |||
|---|---|---|---|
| Quadrant | BADHDUFLAG | Total packets | Discarded packets |
| A | 0 | 9 | 0 |
| B | 0 | 9 | 0 |
| C | 0 | 9 | 0 |
| D | 0 | 9 | 0 |
| Mode M0 | |||
|---|---|---|---|
| Quadrant | BADHDUFLAG | Total packets | Discarded packets |
| A | 0 | 47259 | 1 |
| B | 0 | 16764 | 6 |
| C | 0 | 15207 | 1 |
| D | 0 | 19987 | 1 |
| Mode SS | |||
|---|---|---|---|
| Quadrant | BADHDUFLAG | Total packets | Discarded packets |
| A | 0 | 120 | 0 |
| B | 0 | 120 | 0 |
| C | 0 | 120 | 0 |
| D | 0 | 120 | 0 |
| Quadrant | Total seconds | Saturated seconds | Saturation percentage |
|---|---|---|---|
| A | 5960 | 5824 | 97.718121% |
| B | 5959 | 434 | 7.283101% |
| C | 5959 | 295 | 4.950495% |
| D | 5959 | 551 | 9.246518% |
Noise dominated data is calculated using 1-second bins in cleaned event files. If a bin has >2000 counts, and if more than 50% of those come from <1% of pixels, then it is considered to be noise-dominated and hence unusable.
| Quadrant | # 1 sec bins | Bins with >0 counts | Bins with >2000 counts | High rate bins dominated by noise | Noise dominated (total time) | Noise dominated (detector-on time) | Marked lightcurve |
|---|---|---|---|---|---|---|---|
| A | 6860 | 5961 | 5474 | 5474 | 79.80% | 91.83% | 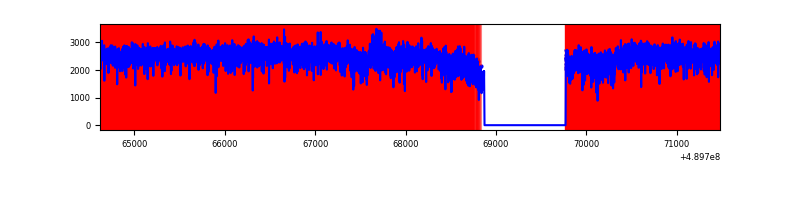 |
| B | 6859 | 5960 | 303 | 303 | 4.42% | 5.08% | 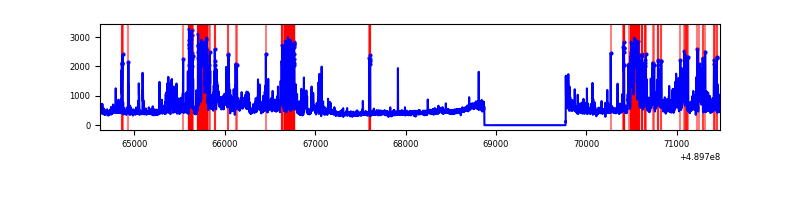 |
| C | 6859 | 5960 | 157 | 157 | 2.29% | 2.63% | 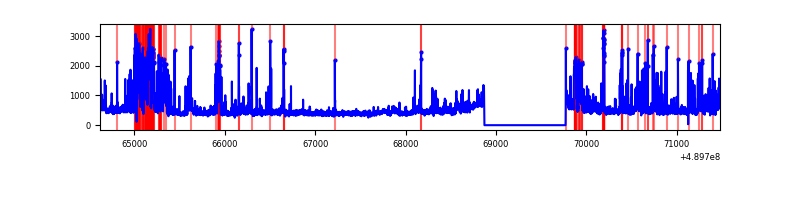 |
| D | 6859 | 5960 | 501 | 501 | 7.30% | 8.41% | 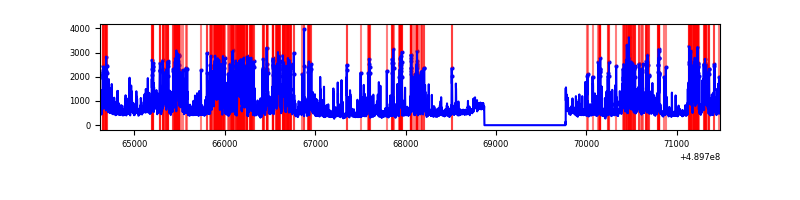 |
Top three noisy pixels from each quadrant. If the there are fewer than three noisy pixels in the level2.evt file, extra rows are filled as -1
| Pixel properties | Quadrant properties | ||||||
|---|---|---|---|---|---|---|---|
| Quadrant | DetID | PixID | Counts | Sigma | Mean | Median | Sigma |
| A | 9 | 191 | 13170595 | 221467.76 | 232 | 227 | 59.5 |
| A | 12 | 17 | 212875 | 3575.81 | 232 | 227 | 59.5 |
| A | 3 | 62 | 108164 | 1815.03 | 232 | 227 | 59.5 |
| B | 8 | 128 | 811253 | 6310.93 | 605 | 584 | 128.5 |
| B | 4 | 158 | 520786 | 4049.69 | 605 | 584 | 128.5 |
| B | 12 | 32 | 69404 | 535.75 | 605 | 584 | 128.5 |
| C | 2 | 12 | 438549 | 2636.17 | 602 | 594 | 166.1 |
| C | 7 | 80 | 302773 | 1818.9 | 602 | 594 | 166.1 |
| C | 15 | 224 | 125368 | 751.05 | 602 | 594 | 166.1 |
| D | 8 | 176 | 1194543 | 6949.01 | 600 | 573 | 171.8 |
| D | 15 | 125 | 676453 | 3933.68 | 600 | 573 | 171.8 |
| D | 2 | 249 | 197366 | 1145.35 | 600 | 573 | 171.8 |
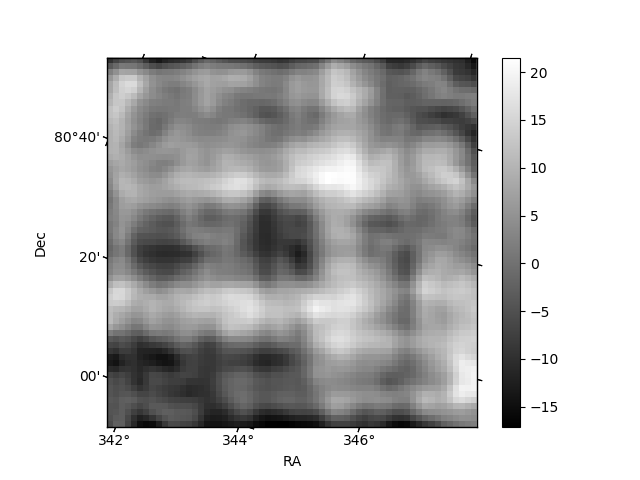
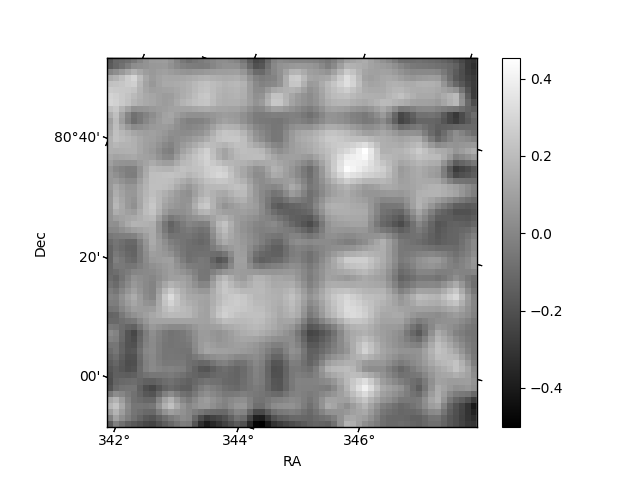
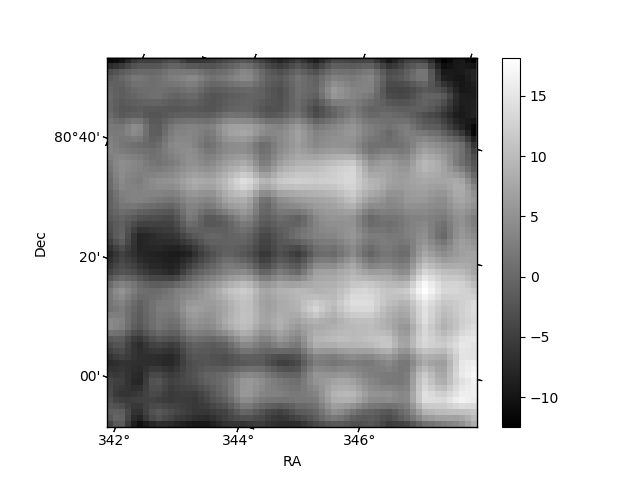
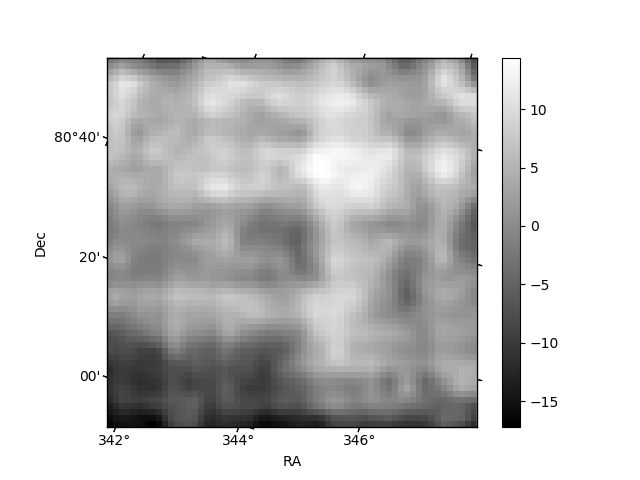
Histogram calculated using DETX and DETY for each event in the final _common_clean file
| Quadrant A | 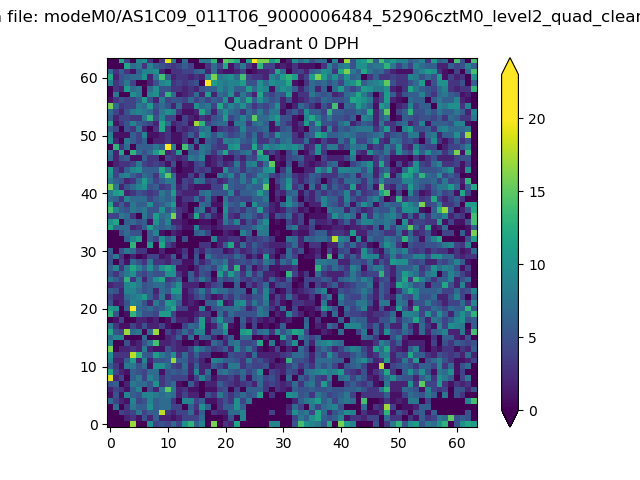 |
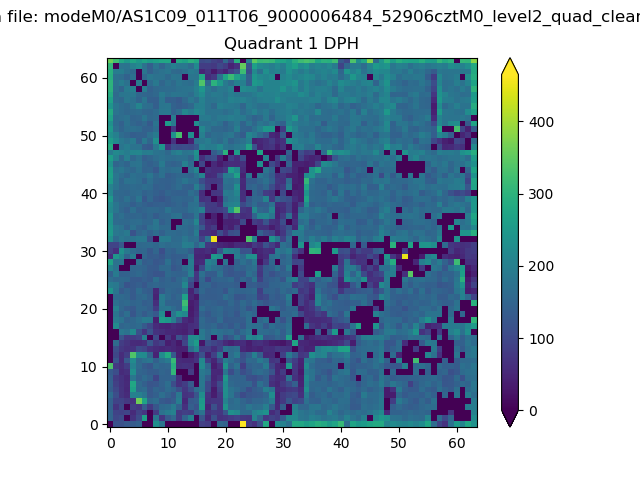 |
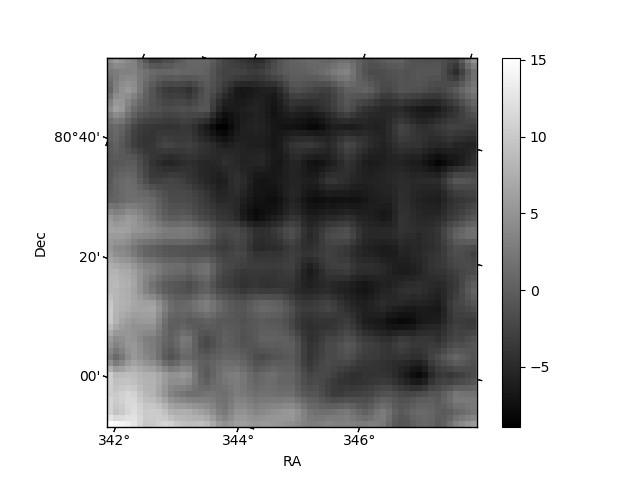
Quadrant B |
|---|---|---|---|
| Quadrant D | 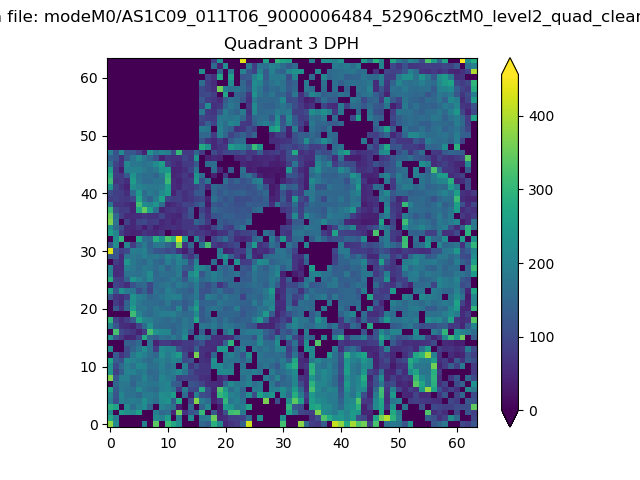 |
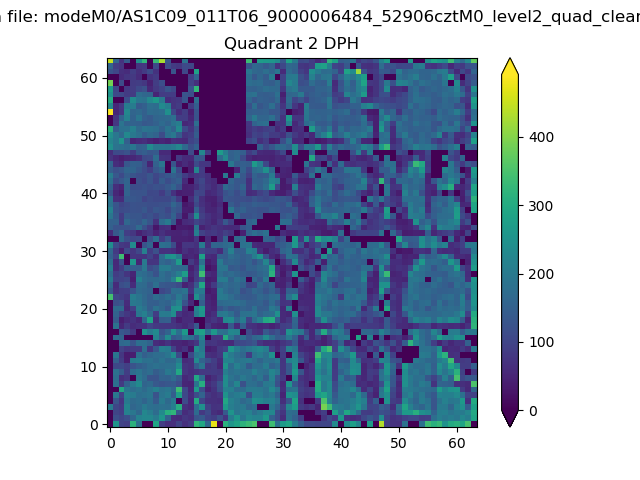 |
Quadrant C |
| Plot type | Count rate plots | Images |
|---|---|---|
| Comparison with Poisson distribution Blue bars denote a histogram of data divided into 1 sec bins. Red curve is a Poisson curve with rate = median count rate of data. |
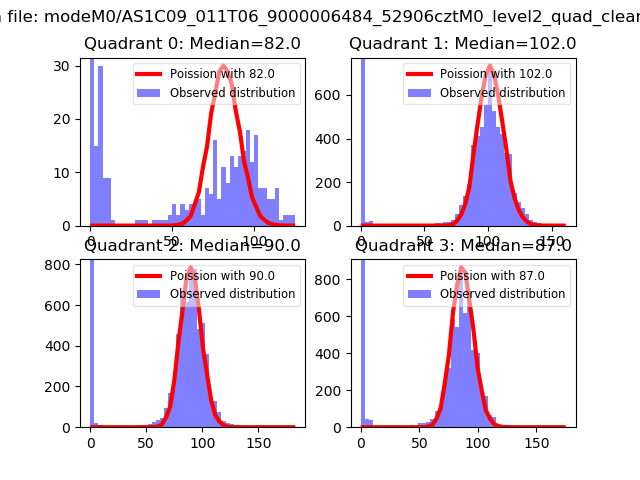 |
 |
| Quadrant-wise count rates Data is divided into 100 sec bins |
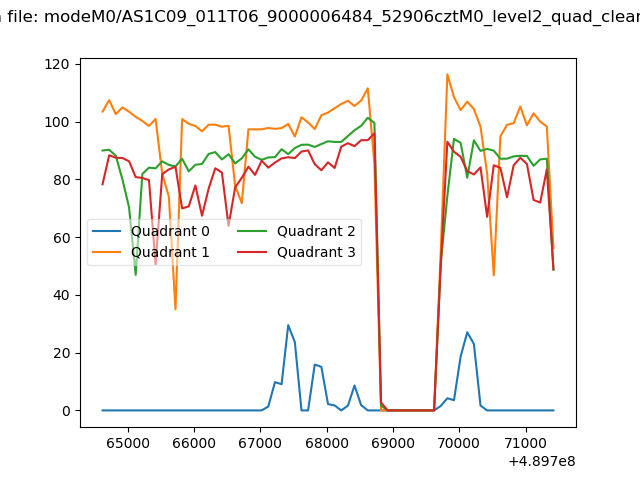 |
|
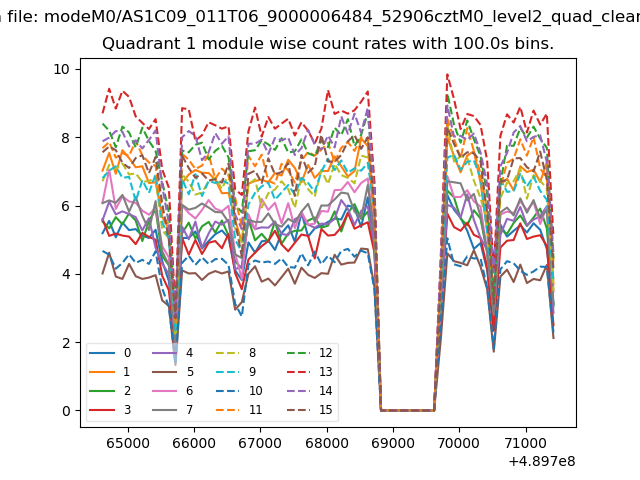
| Module-wise count rates for Quadrant A Data is divided into 100 sec bins |
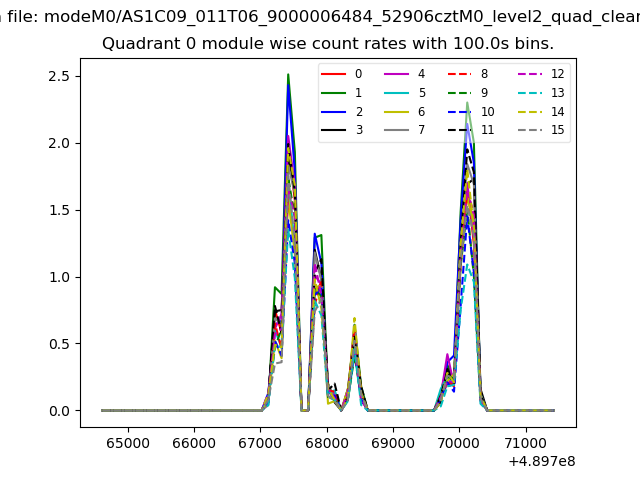 |
 |
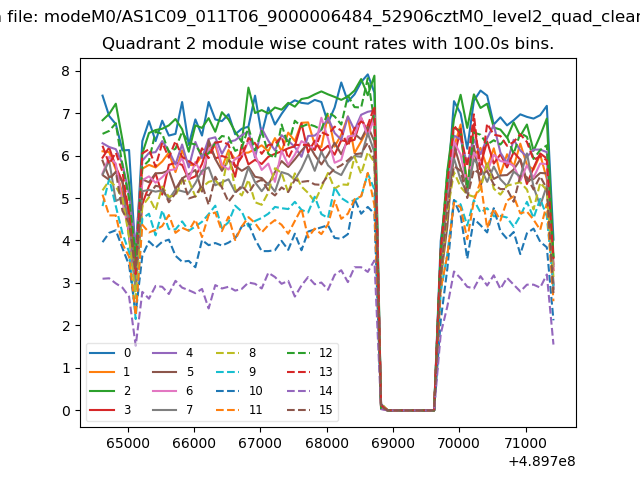
| Module-wise count rates for Quadrant B Data is divided into 100 sec bins |
 |
 |
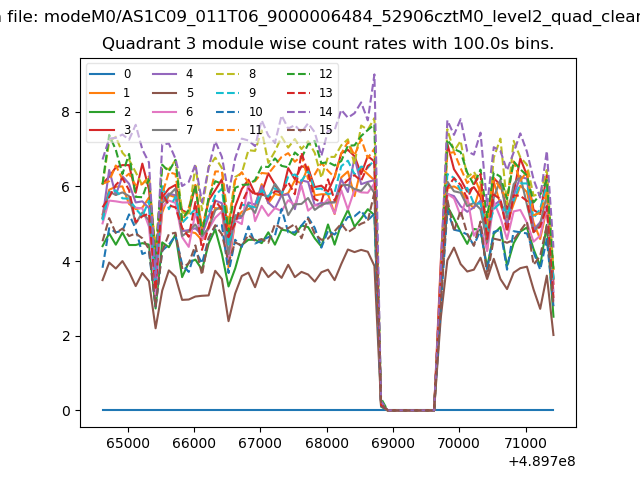
| Module-wise count rates for Quadrant C Data is divided into 100 sec bins |
 |
 |
| Module-wise count rates for Quadrant D Data is divided into 100 sec bins |
 |
 |
| Parameter | Plot |
|---|---|
| CZT HV Monitor | 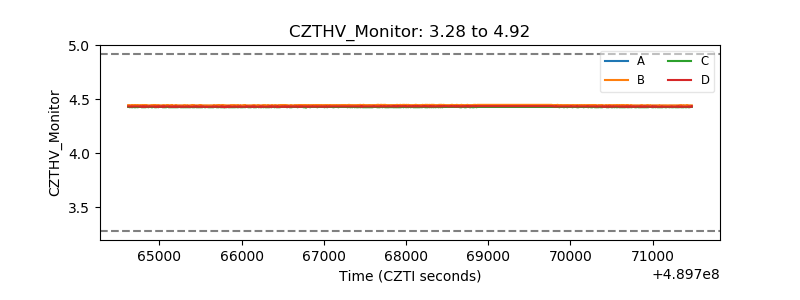 |
| D_VDD | 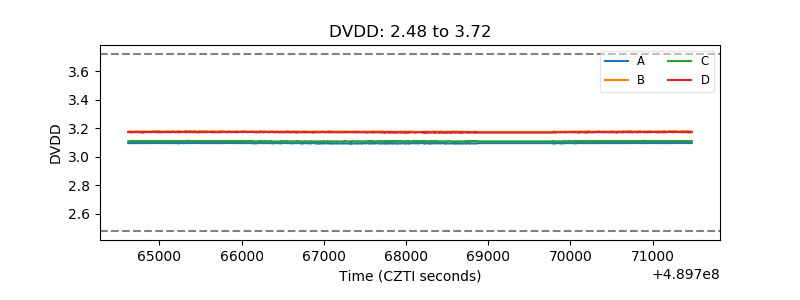 |
| Temperature 1 | 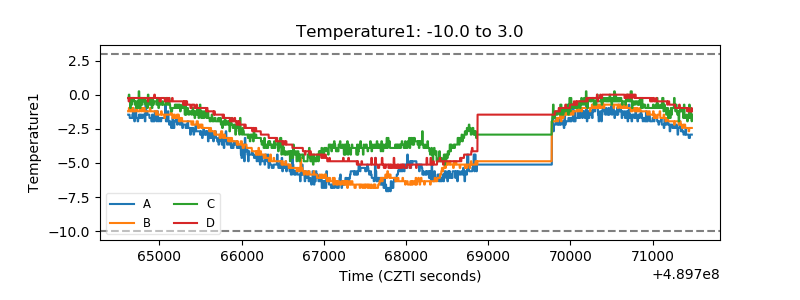 |
| Veto HV Monitor | 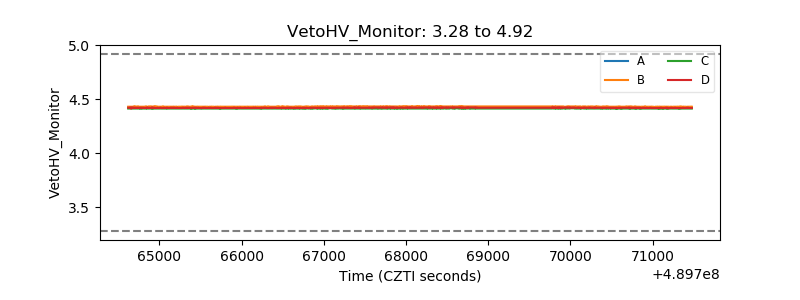 |
| Veto LLD | 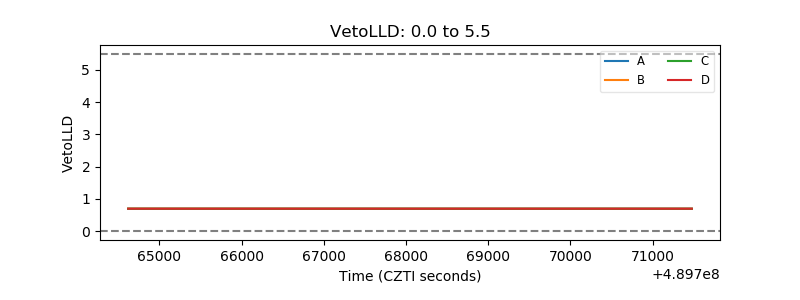 |
| Alpha Counter | 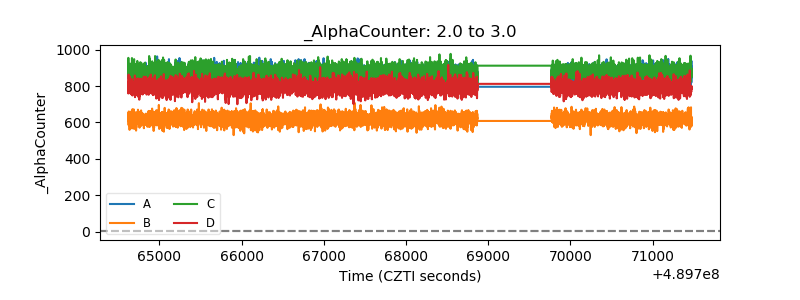 |
| _CPM_Rate | 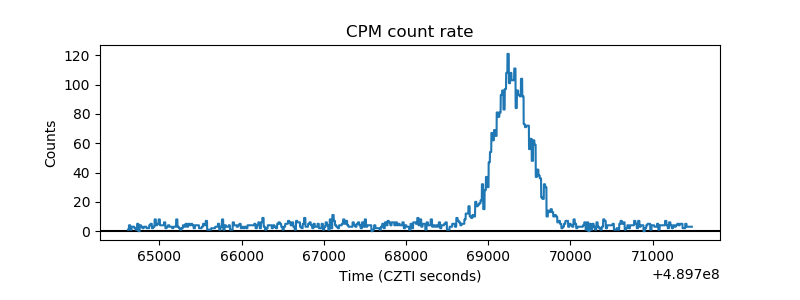 |
| CZT Counter | 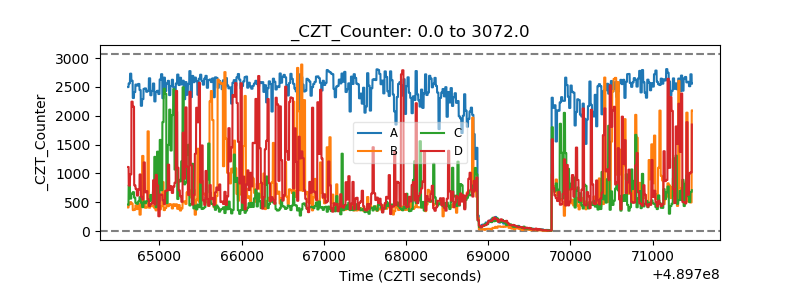 |
| +2.5 Volts monitor |  |
| +5 Volts monitor | 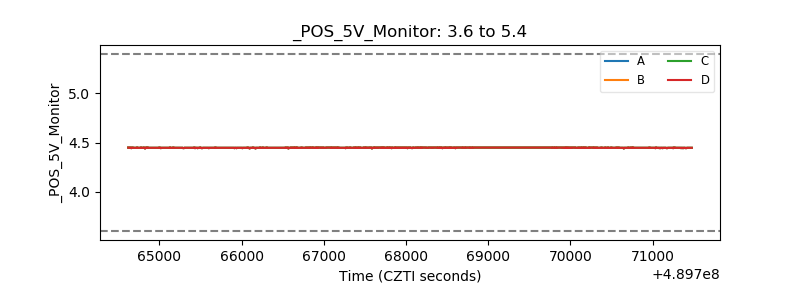 |
| _ROLL_ROT | 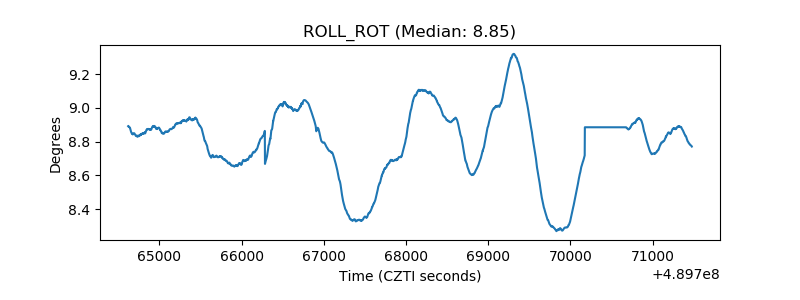 |
| _Roll_DEC | 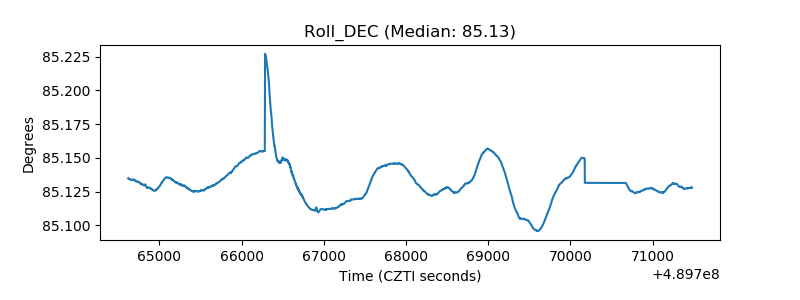 |
| _Roll_RA | 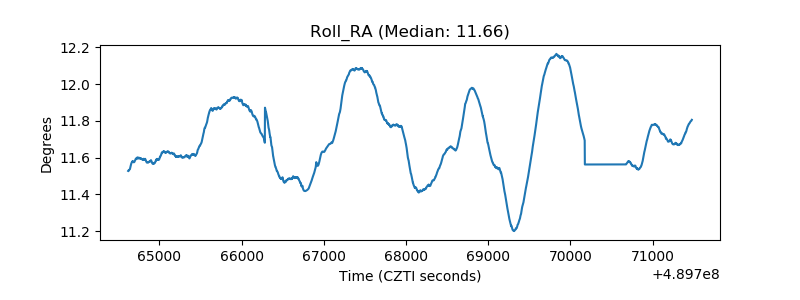 |
| Veto Counter | 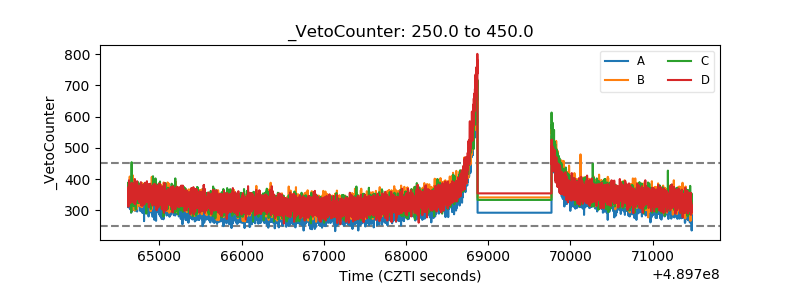 |