| Param | Original file | Final file |
|---|---|---|
| Filename | modeM0/AS1C09_011T06_9000006484_52907cztM0_level2.fits | modeM0/AS1C09_011T06_9000006484_52907cztM0_level2_quad_clean.evt |
| Size (bytes) | 838,872,000 | 71,421,120 |
| Size | 800.0 MB | 68.1 MB |
| Events in quadrant A | 15,576,002 | 22,992 |
| Events in quadrant B | 4,352,259 | 635,119 |
| Events in quadrant C | 3,855,416 | 566,830 |
| Events in quadrant D | 6,776,887 | 494,767 |
| Mode M9 | |||
|---|---|---|---|
| Quadrant | BADHDUFLAG | Total packets | Discarded packets |
| A | 0 | 4 | 0 |
| B | 0 | 4 | 0 |
| C | 0 | 4 | 0 |
| D | 0 | 4 | 0 |
| Mode M0 | |||
|---|---|---|---|
| Quadrant | BADHDUFLAG | Total packets | Discarded packets |
| A | 0 | 50510 | 9 |
| B | 0 | 17259 | 2 |
| C | 0 | 16000 | 2 |
| D | 0 | 24561 | 2 |
| Mode SS | |||
|---|---|---|---|
| Quadrant | BADHDUFLAG | Total packets | Discarded packets |
| A | 0 | 130 | 0 |
| B | 0 | 130 | 0 |
| C | 0 | 130 | 0 |
| D | 0 | 130 | 0 |
| Quadrant | Total seconds | Saturated seconds | Saturation percentage |
|---|---|---|---|
| A | 6337 | 6161 | 97.222661% |
| B | 6338 | 237 | 3.739350% |
| C | 6338 | 197 | 3.108236% |
| D | 6338 | 1020 | 16.093405% |
Noise dominated data is calculated using 1-second bins in cleaned event files. If a bin has >2000 counts, and if more than 50% of those come from <1% of pixels, then it is considered to be noise-dominated and hence unusable.
| Quadrant | # 1 sec bins | Bins with >0 counts | Bins with >2000 counts | High rate bins dominated by noise | Noise dominated (total time) | Noise dominated (detector-on time) | Marked lightcurve |
|---|---|---|---|---|---|---|---|
| A | 6817 | 6339 | 5778 | 5778 | 84.76% | 91.15% | 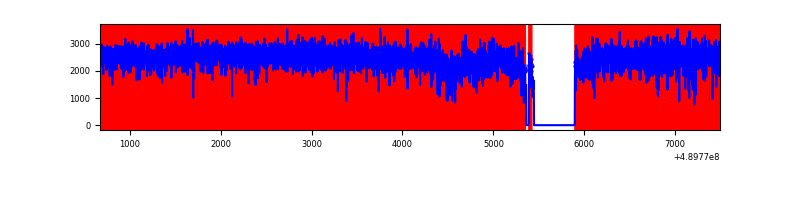 |
| B | 6818 | 6340 | 162 | 162 | 2.38% | 2.56% | 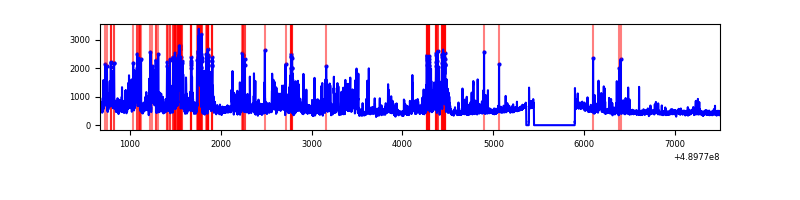 |
| C | 6818 | 6340 | 116 | 116 | 1.70% | 1.83% | 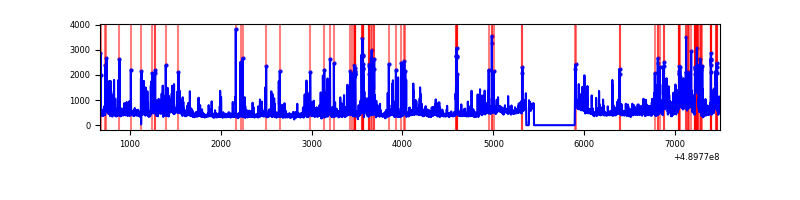 |
| D | 6818 | 6340 | 969 | 969 | 14.21% | 15.28% | 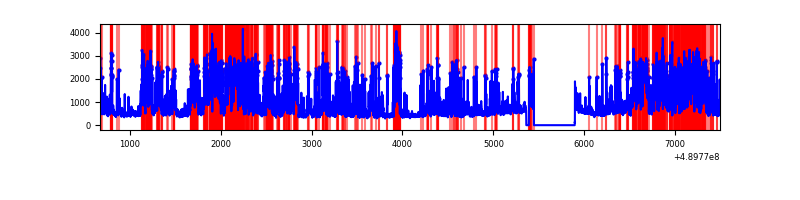 |
Top three noisy pixels from each quadrant. If the there are fewer than three noisy pixels in the level2.evt file, extra rows are filled as -1
| Pixel properties | Quadrant properties | ||||||
|---|---|---|---|---|---|---|---|
| Quadrant | DetID | PixID | Counts | Sigma | Mean | Median | Sigma |
| A | 9 | 191 | 14078656 | 215966.13 | 251 | 244 | 65.2 |
| A | 12 | 17 | 180249 | 2761.32 | 251 | 244 | 65.2 |
| A | 0 | 8 | 89949 | 1376.1 | 251 | 244 | 65.2 |
| B | 8 | 128 | 986742 | 7101.4 | 656 | 633 | 138.9 |
| B | 4 | 158 | 300759 | 2161.34 | 656 | 633 | 138.9 |
| B | 12 | 32 | 160139 | 1148.67 | 656 | 633 | 138.9 |
| C | 7 | 80 | 565499 | 3176.38 | 648 | 640 | 177.8 |
| C | 15 | 224 | 183034 | 1025.66 | 648 | 640 | 177.8 |
| C | 2 | 12 | 113630 | 635.38 | 648 | 640 | 177.8 |
| D | 8 | 176 | 2050072 | 11541.92 | 618 | 589 | 177.6 |
| D | 15 | 125 | 1187962 | 6686.84 | 618 | 589 | 177.6 |
| D | 15 | 174 | 354986 | 1995.83 | 618 | 589 | 177.6 |
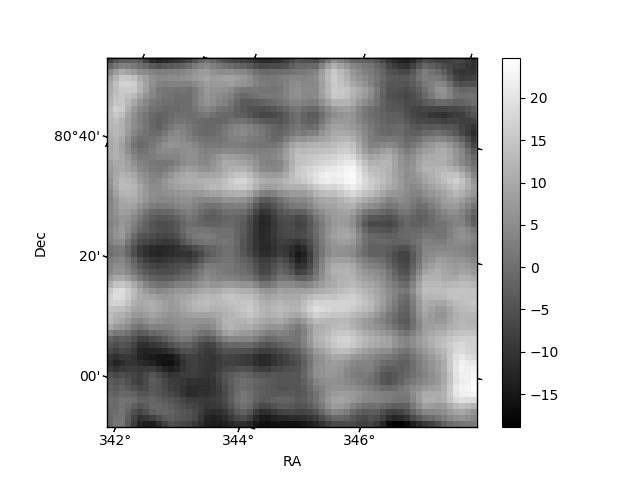
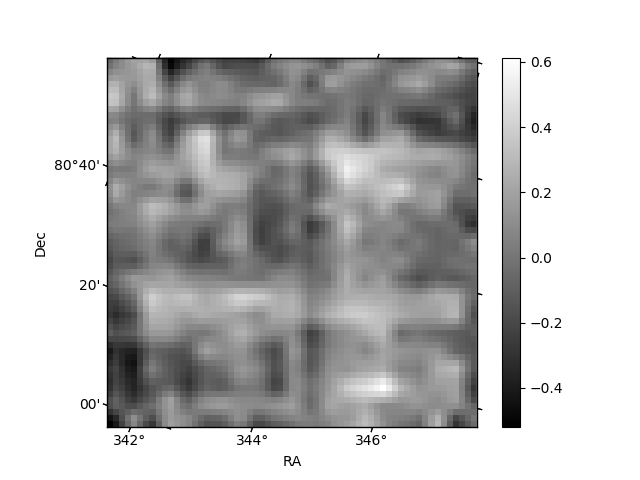
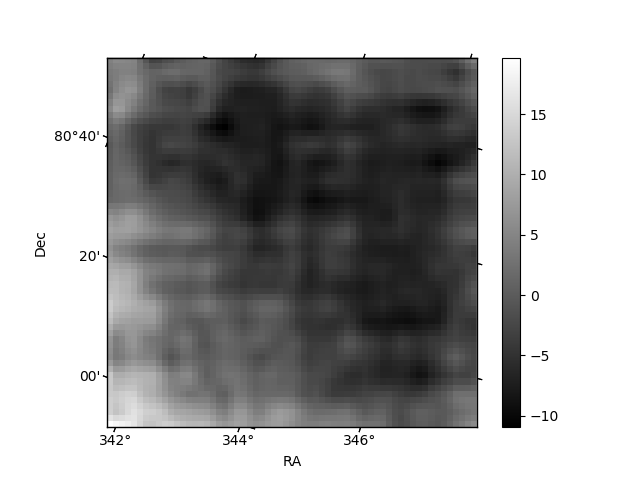
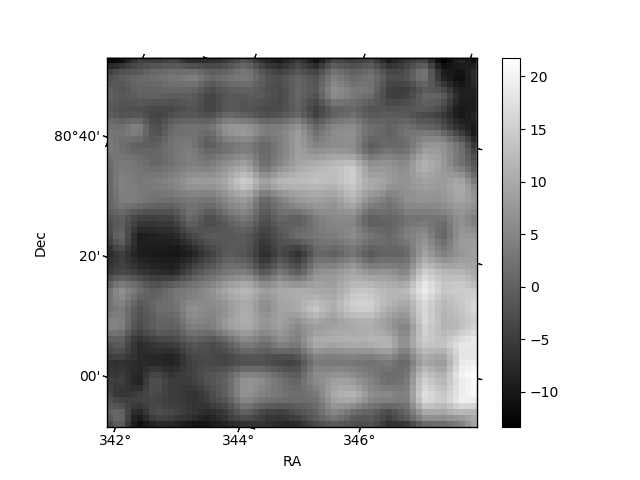
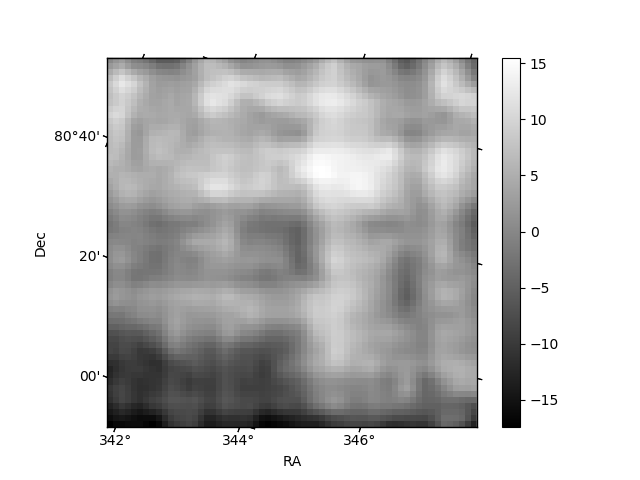
Histogram calculated using DETX and DETY for each event in the final _common_clean file
| Quadrant A | 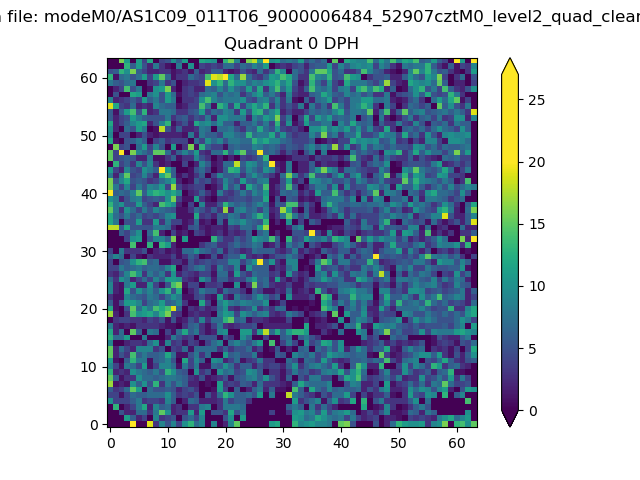 |
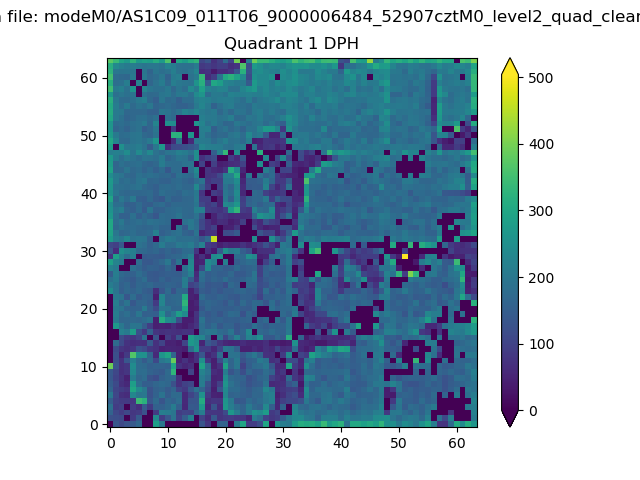 |
Quadrant B |
|---|---|---|---|
| Quadrant D | 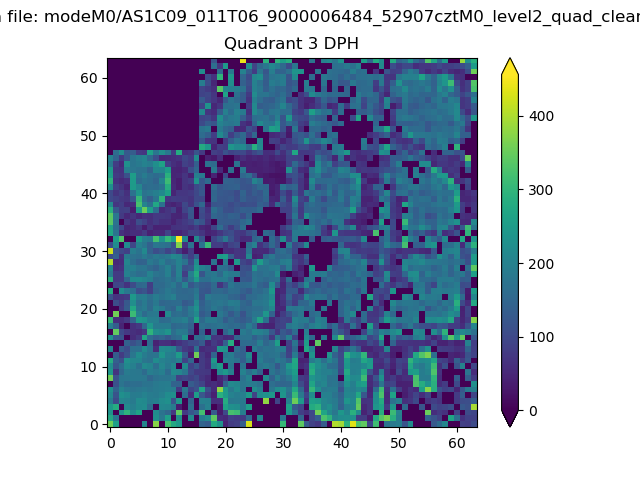 |
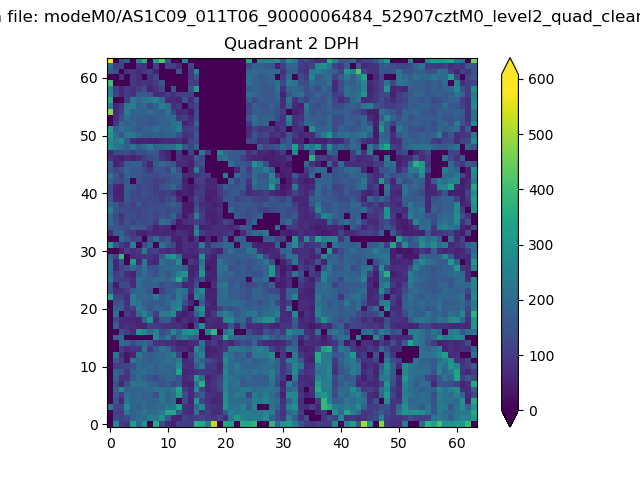 |
Quadrant C |
| Plot type | Count rate plots | Images |
|---|---|---|
| Comparison with Poisson distribution Blue bars denote a histogram of data divided into 1 sec bins. Red curve is a Poisson curve with rate = median count rate of data. |
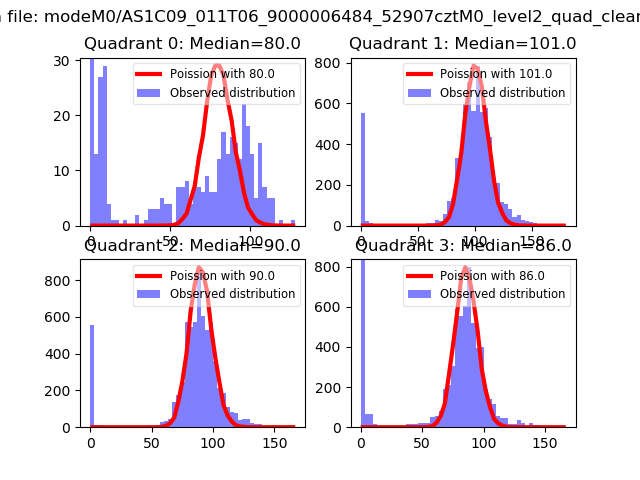 |
 |
| Quadrant-wise count rates Data is divided into 100 sec bins |
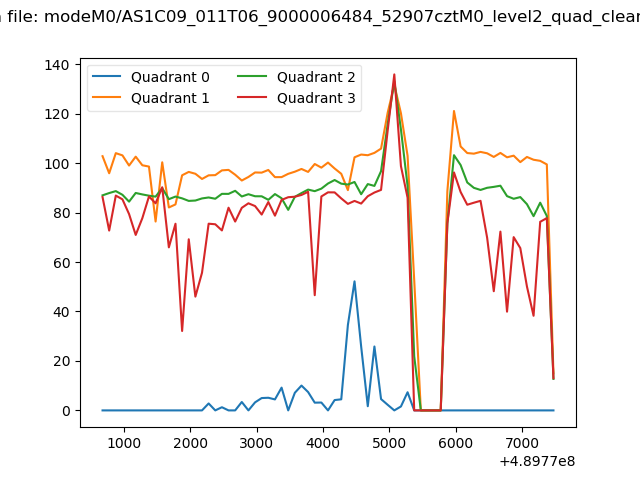 |
|
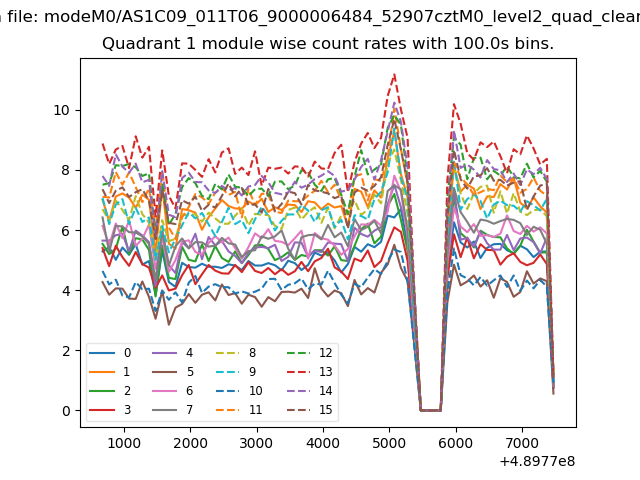
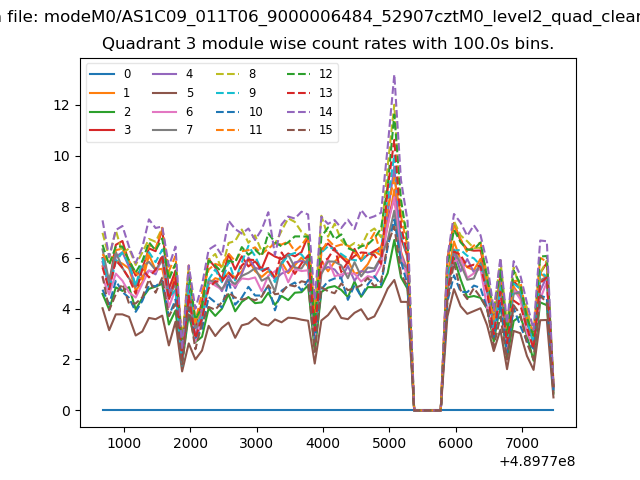
| Module-wise count rates for Quadrant A Data is divided into 100 sec bins |
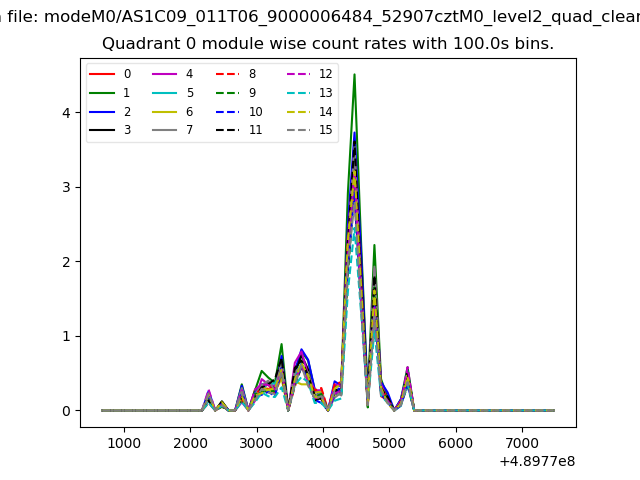 |
 |
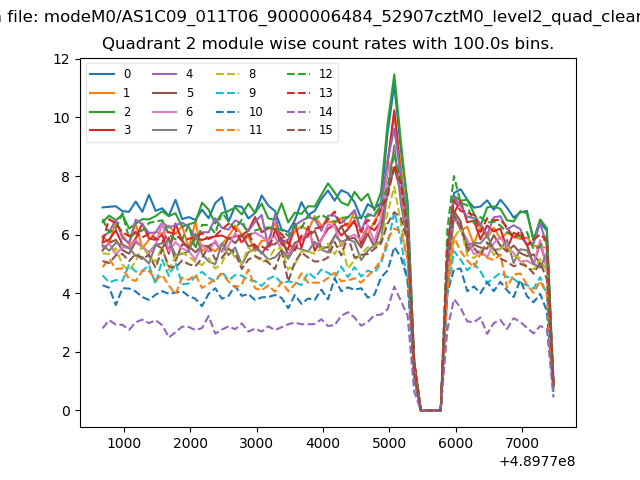
| Module-wise count rates for Quadrant B Data is divided into 100 sec bins |
 |
 |
| Module-wise count rates for Quadrant C Data is divided into 100 sec bins |
 |
 |
| Module-wise count rates for Quadrant D Data is divided into 100 sec bins |
 |
 |
| Parameter | Plot |
|---|---|
| CZT HV Monitor | 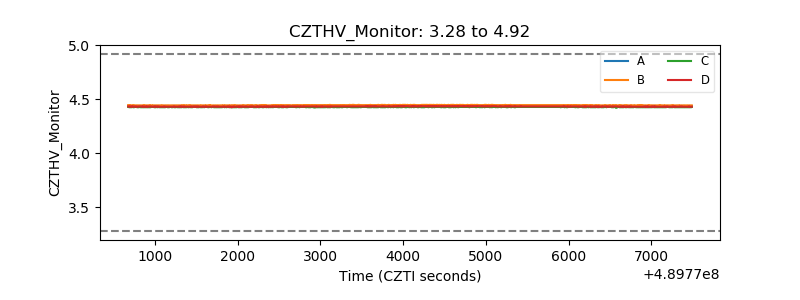 |
| D_VDD | 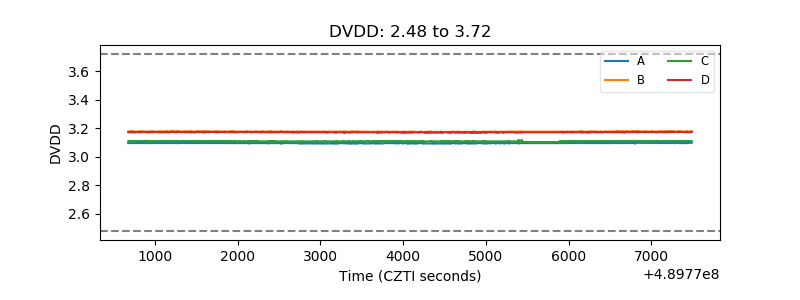 |
| Temperature 1 | 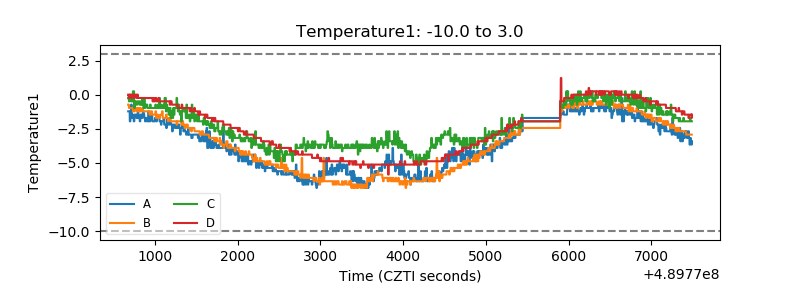 |
| Veto HV Monitor | 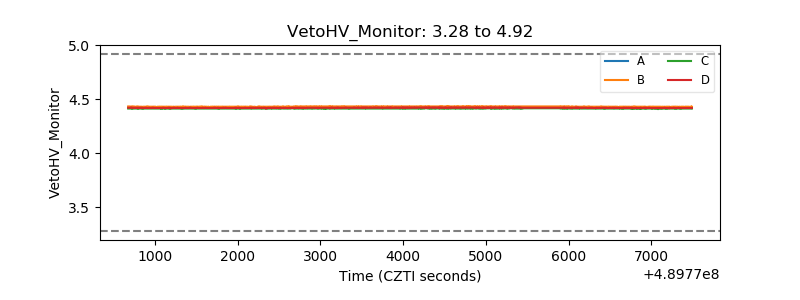 |
| Veto LLD | 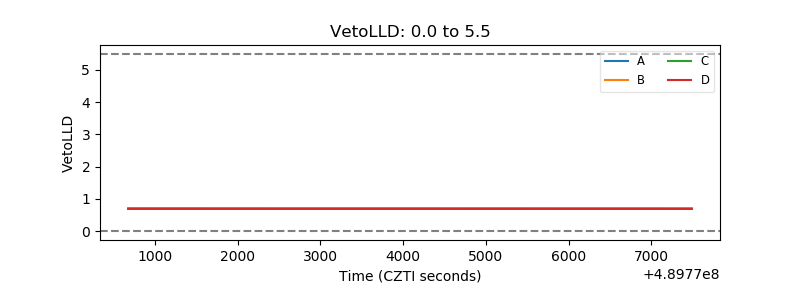 |
| Alpha Counter | 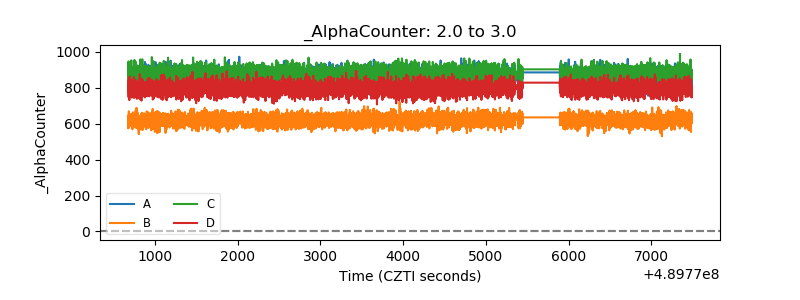 |
| _CPM_Rate | 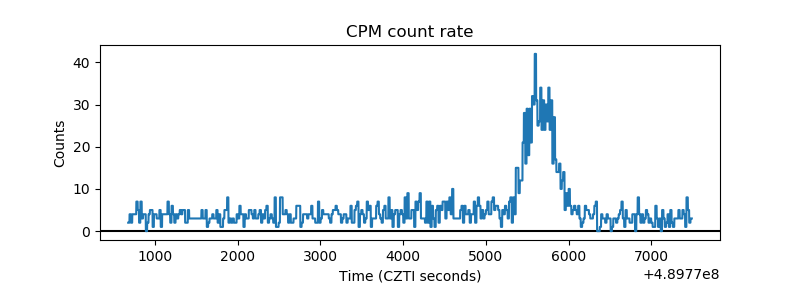 |
| CZT Counter | 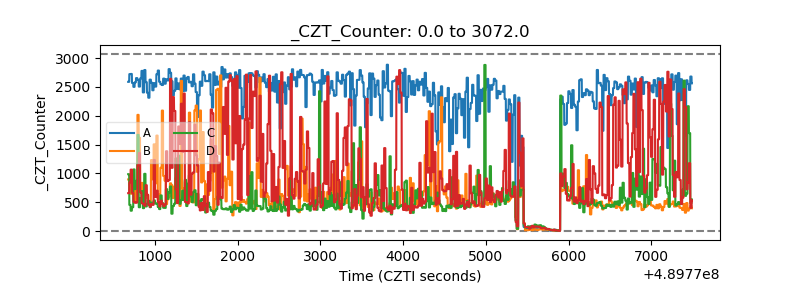 |
| +2.5 Volts monitor |  |
| +5 Volts monitor | 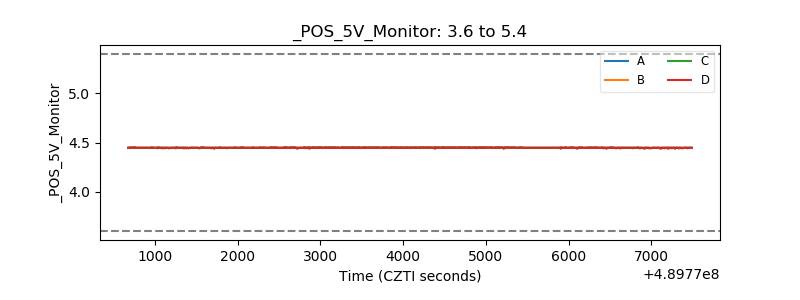 |
| _ROLL_ROT | 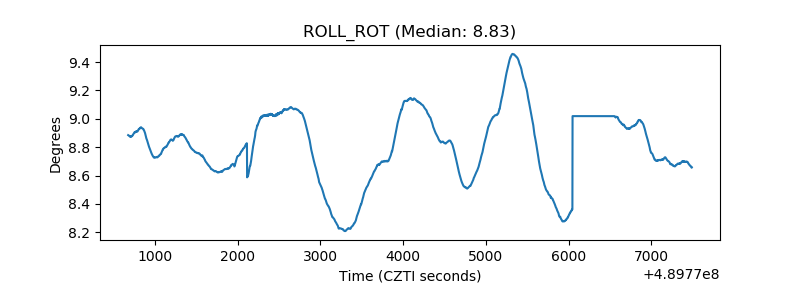 |
| _Roll_DEC | 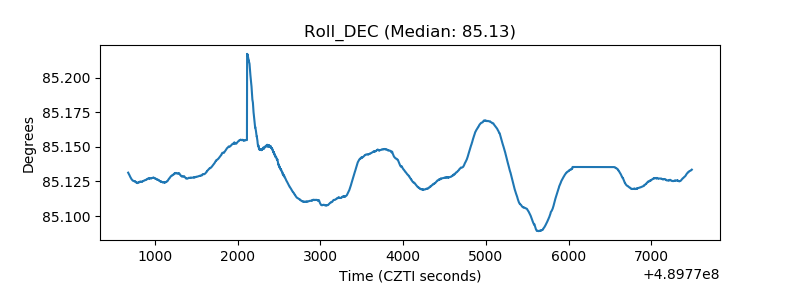 |
| _Roll_RA | 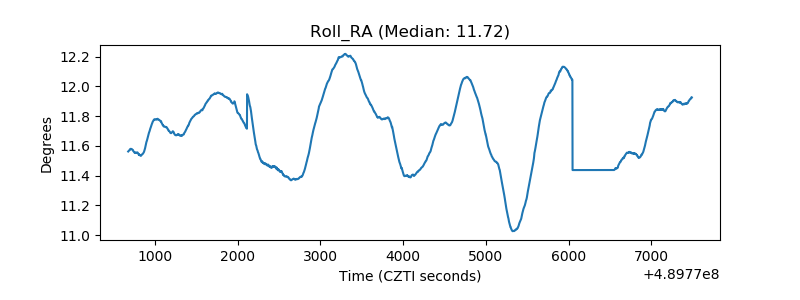 |
| Veto Counter | 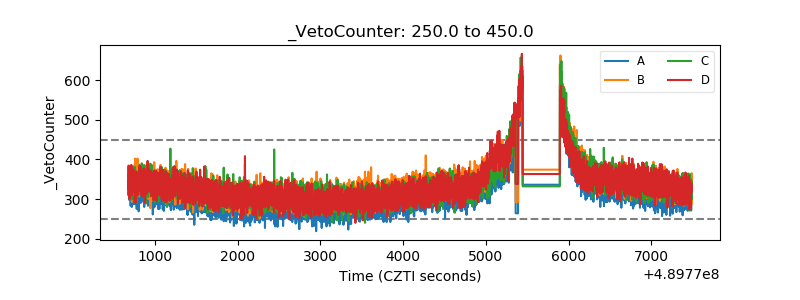 |