| Param | Original file | Final file |
|---|---|---|
| Filename | modeM0/AS1C09_011T06_9000006484_52908cztM0_level2.fits | modeM0/AS1C09_011T06_9000006484_52908cztM0_level2_quad_clean.evt |
| Size (bytes) | 1,033,623,360 | 77,653,440 |
| Size | 985.7 MB | 74.1 MB |
| Events in quadrant A | 17,891,650 | 23,893 |
| Events in quadrant B | 3,421,187 | 733,943 |
| Events in quadrant C | 7,014,531 | 588,725 |
| Events in quadrant D | 9,375,285 | 501,728 |
| Mode M0 | |||
|---|---|---|---|
| Quadrant | BADHDUFLAG | Total packets | Discarded packets |
| A | 0 | 58043 | 7 |
| B | 0 | 15367 | 0 |
| C | 0 | 25937 | 0 |
| D | 0 | 32895 | 0 |
| Mode SS | |||
|---|---|---|---|
| Quadrant | BADHDUFLAG | Total packets | Discarded packets |
| A | 0 | 144 | 0 |
| B | 0 | 144 | 0 |
| C | 0 | 144 | 0 |
| D | 0 | 144 | 0 |
| Quadrant | Total seconds | Saturated seconds | Saturation percentage |
|---|---|---|---|
| A | 7218 | 7026 | 97.339983% |
| B | 7218 | 35 | 0.484899% |
| C | 7218 | 871 | 12.067055% |
| D | 7218 | 1842 | 25.519534% |
Noise dominated data is calculated using 1-second bins in cleaned event files. If a bin has >2000 counts, and if more than 50% of those come from <1% of pixels, then it is considered to be noise-dominated and hence unusable.
| Quadrant | # 1 sec bins | Bins with >0 counts | Bins with >2000 counts | High rate bins dominated by noise | Noise dominated (total time) | Noise dominated (detector-on time) | Marked lightcurve |
|---|---|---|---|---|---|---|---|
| A | 7218 | 7218 | 6589 | 6589 | 91.29% | 91.29% | 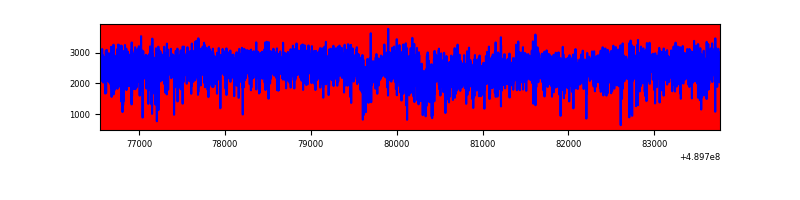 |
| B | 7218 | 7218 | 11 | 11 | 0.15% | 0.15% | 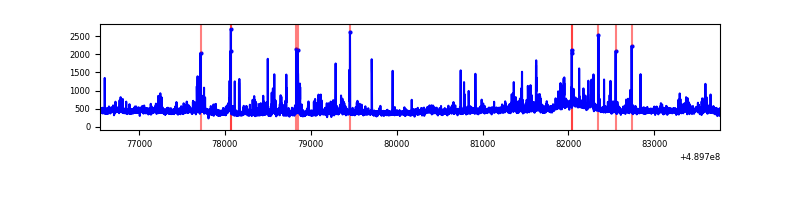 |
| C | 7218 | 7218 | 669 | 669 | 9.27% | 9.27% | 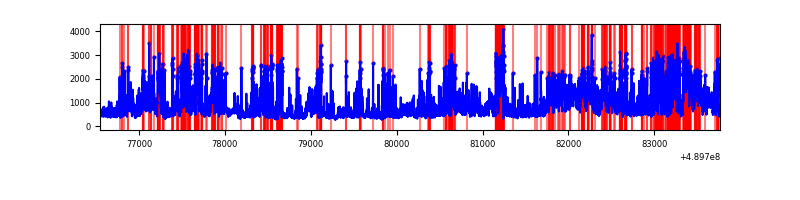 |
| D | 7218 | 7218 | 1688 | 1688 | 23.39% | 23.39% | 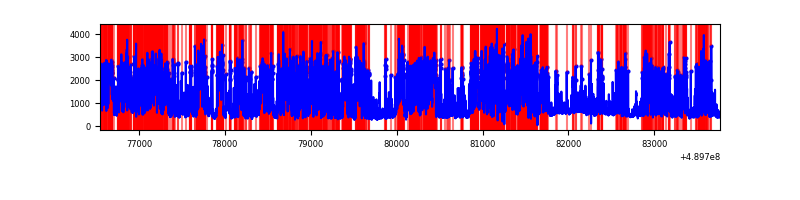 |
Top three noisy pixels from each quadrant. If the there are fewer than three noisy pixels in the level2.evt file, extra rows are filled as -1
| Pixel properties | Quadrant properties | ||||||
|---|---|---|---|---|---|---|---|
| Quadrant | DetID | PixID | Counts | Sigma | Mean | Median | Sigma |
| A | 9 | 191 | 15220880 | 237601.52 | 242 | 235 | 64.1 |
| A | 12 | 17 | 1038874 | 16213.65 | 242 | 235 | 64.1 |
| A | 0 | 8 | 146582 | 2284.55 | 242 | 235 | 64.1 |
| B | 4 | 158 | 63430 | 389.87 | 758 | 733 | 160.8 |
| B | 10 | 247 | 48844 | 299.17 | 758 | 733 | 160.8 |
| B | 1 | 255 | 42970 | 262.65 | 758 | 733 | 160.8 |
| C | 7 | 80 | 2369000 | 12109.78 | 717 | 711 | 195.6 |
| C | 2 | 12 | 584744 | 2986.34 | 717 | 711 | 195.6 |
| C | 15 | 224 | 334663 | 1707.6 | 717 | 711 | 195.6 |
| D | 8 | 176 | 4388248 | 22410.03 | 674 | 643 | 195.8 |
| D | 15 | 125 | 571600 | 2916.21 | 674 | 643 | 195.8 |
| D | 15 | 174 | 405332 | 2066.98 | 674 | 643 | 195.8 |
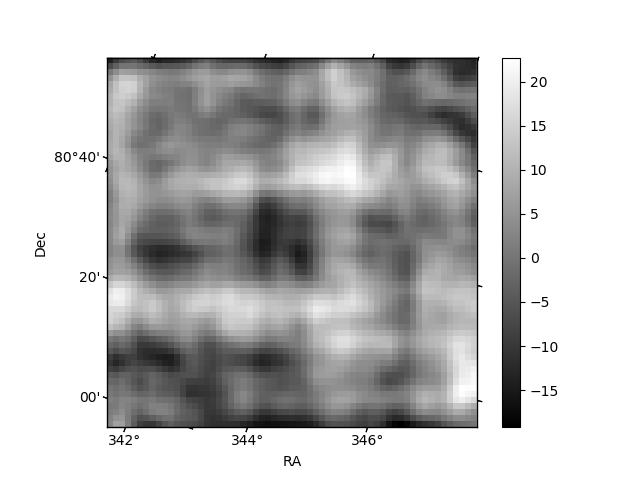
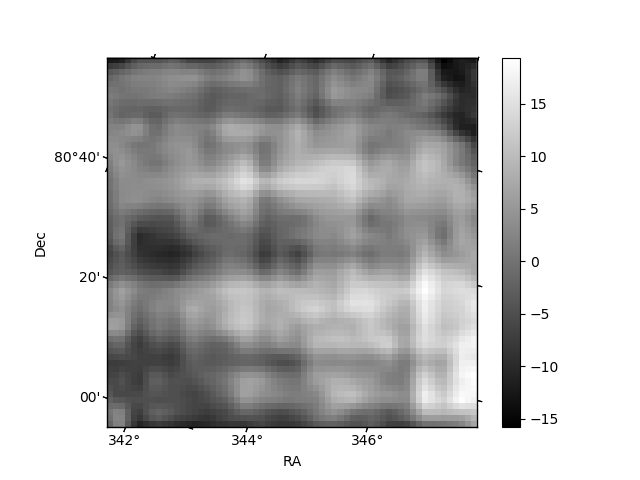
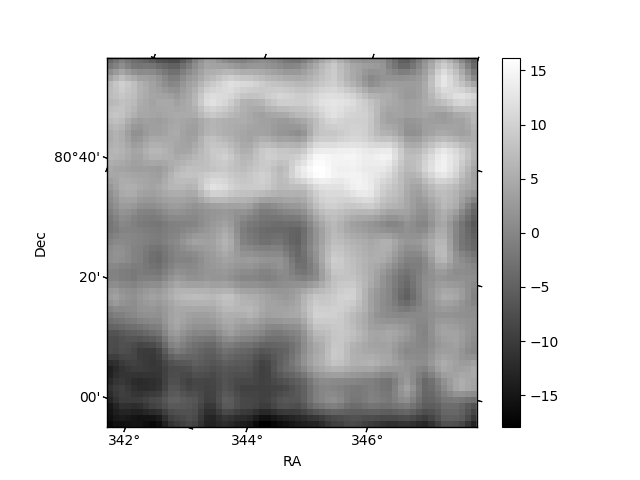
Histogram calculated using DETX and DETY for each event in the final _common_clean file
| Quadrant A | 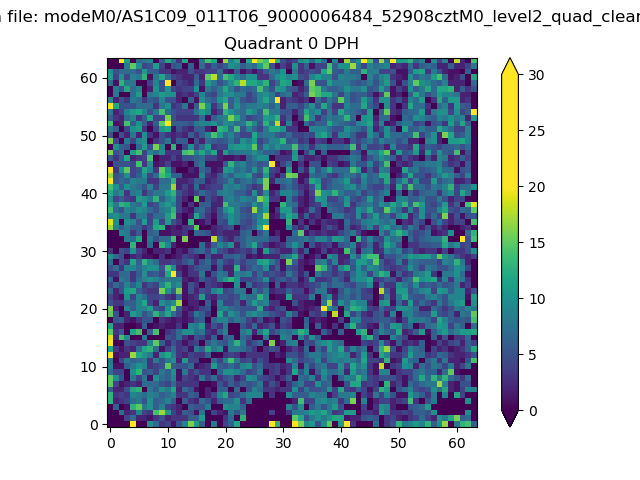 |
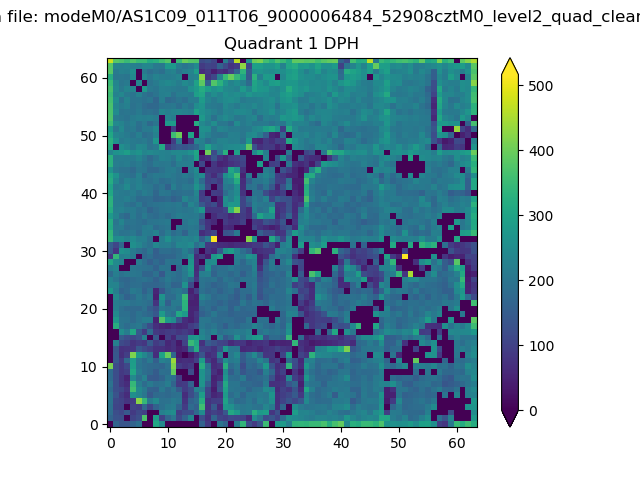 |
Quadrant B |
|---|---|---|---|
| Quadrant D | 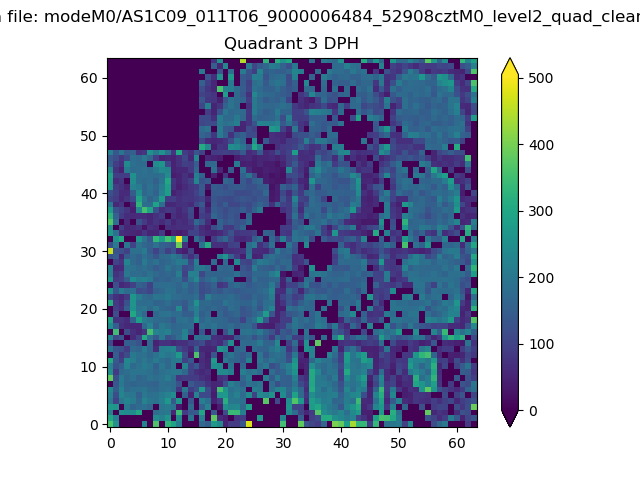 |
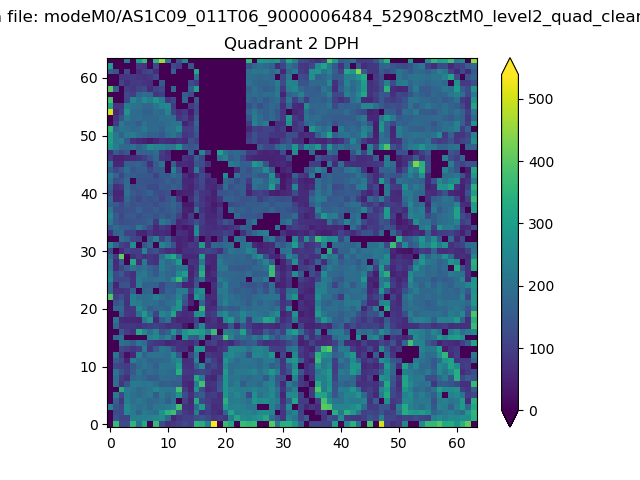 |
Quadrant C |
| Plot type | Count rate plots | Images |
|---|---|---|
| Comparison with Poisson distribution Blue bars denote a histogram of data divided into 1 sec bins. Red curve is a Poisson curve with rate = median count rate of data. |
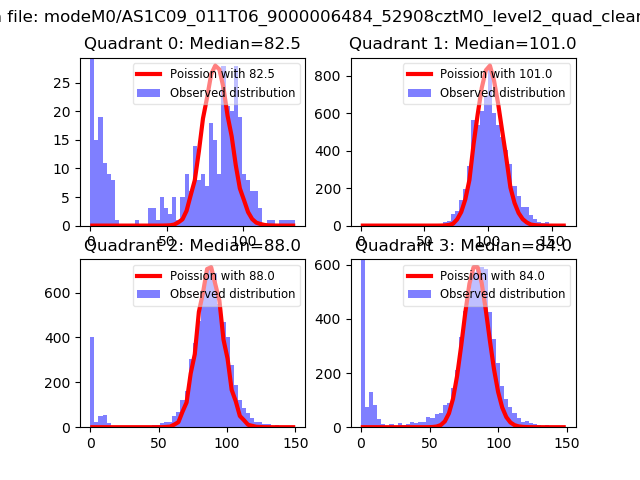 |
 |
| Quadrant-wise count rates Data is divided into 100 sec bins |
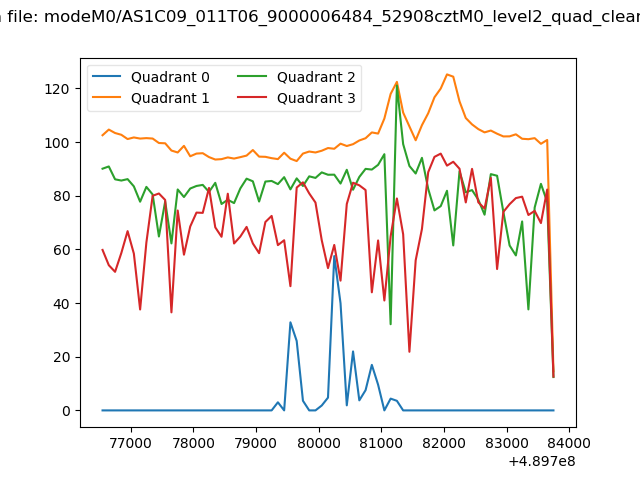 |
|
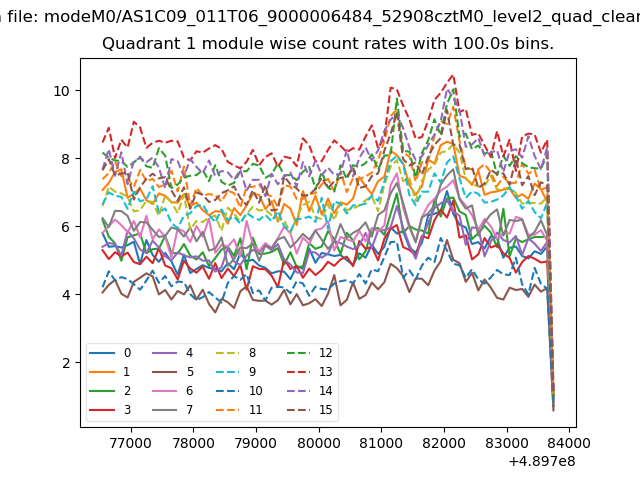
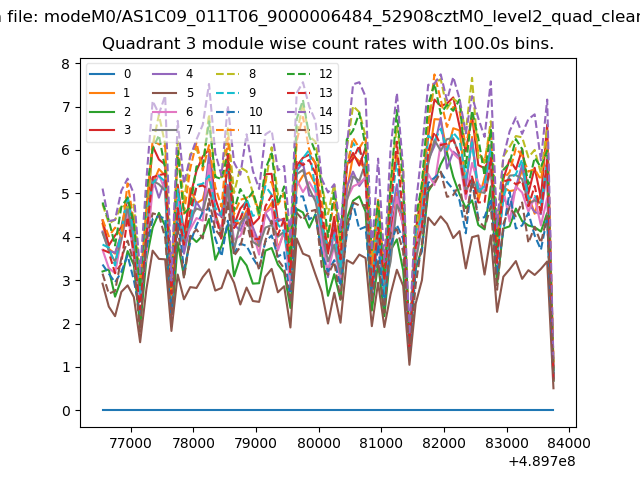
| Module-wise count rates for Quadrant A Data is divided into 100 sec bins |
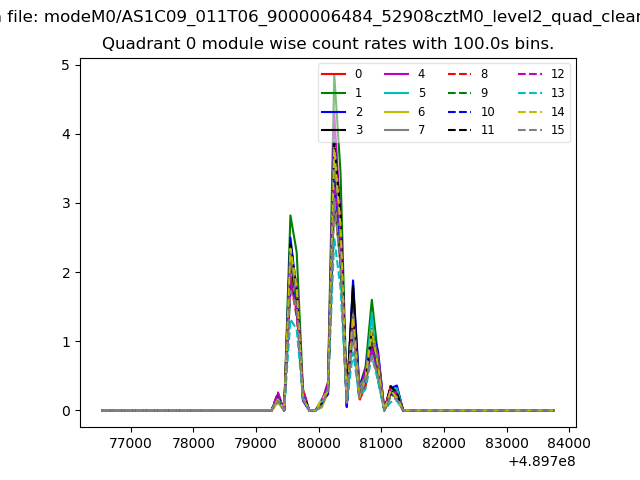 |
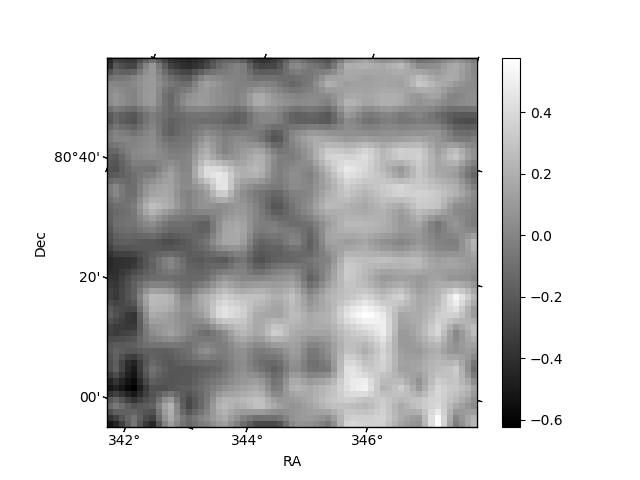 |
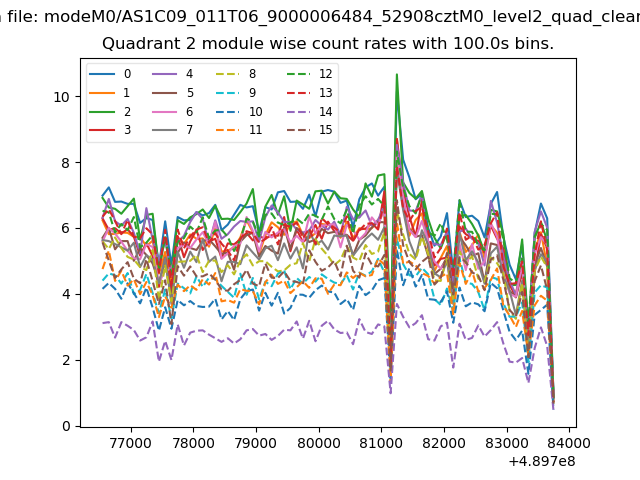
| Module-wise count rates for Quadrant B Data is divided into 100 sec bins |
 |
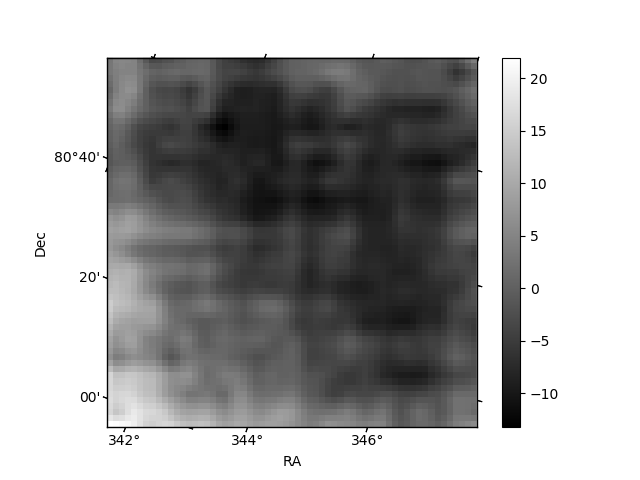 |
| Module-wise count rates for Quadrant C Data is divided into 100 sec bins |
 |
 |
| Module-wise count rates for Quadrant D Data is divided into 100 sec bins |
 |
 |
| Parameter | Plot |
|---|---|
| CZT HV Monitor |  |
| D_VDD | 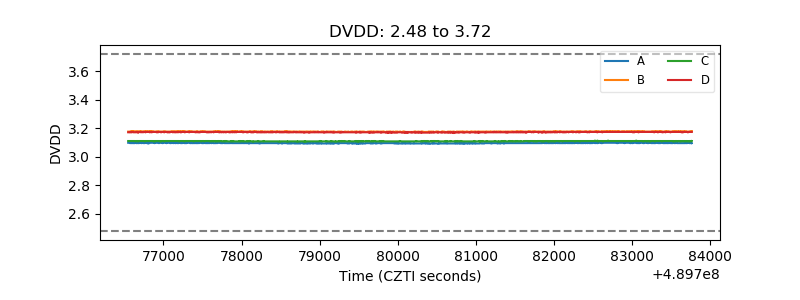 |
| Temperature 1 | 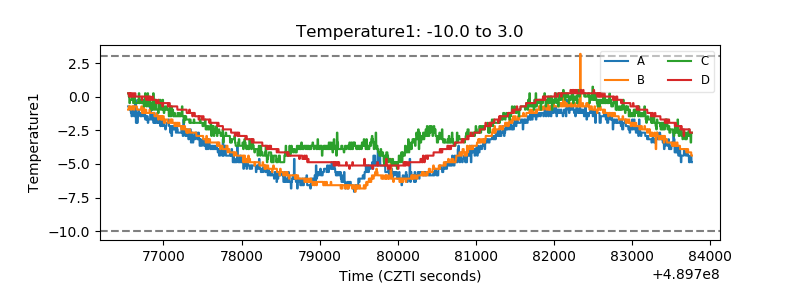 |
| Veto HV Monitor | 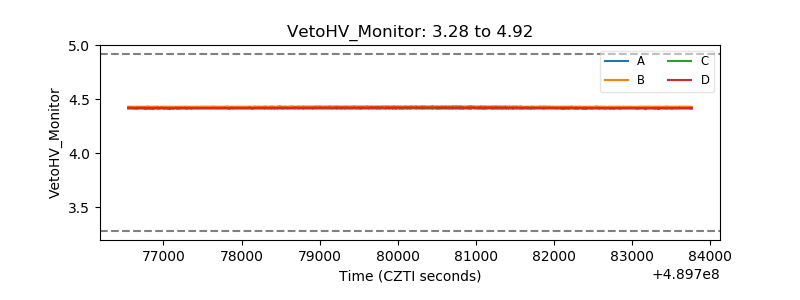 |
| Veto LLD | 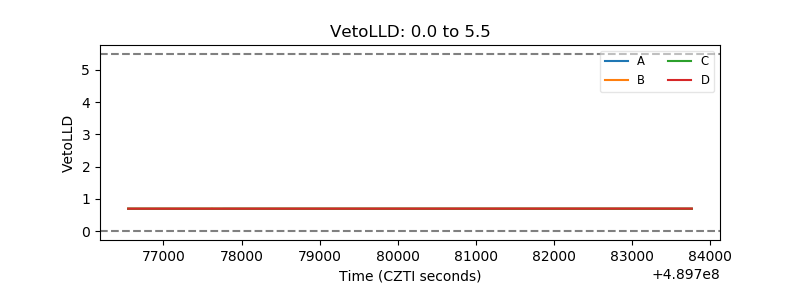 |
| Alpha Counter | 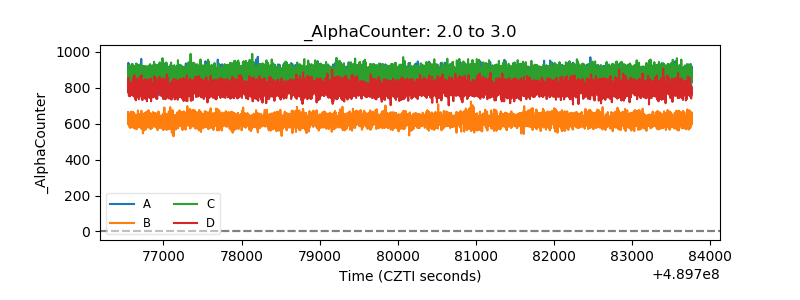 |
| _CPM_Rate | 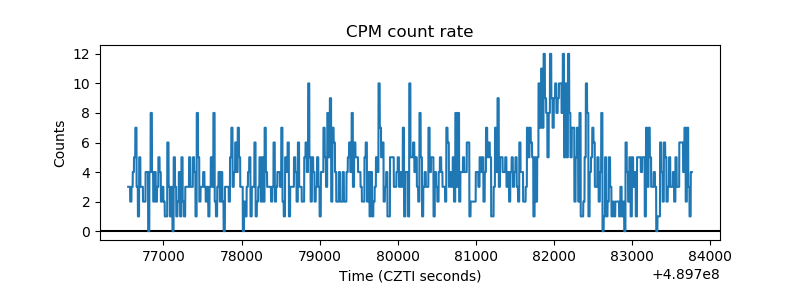 |
| CZT Counter | 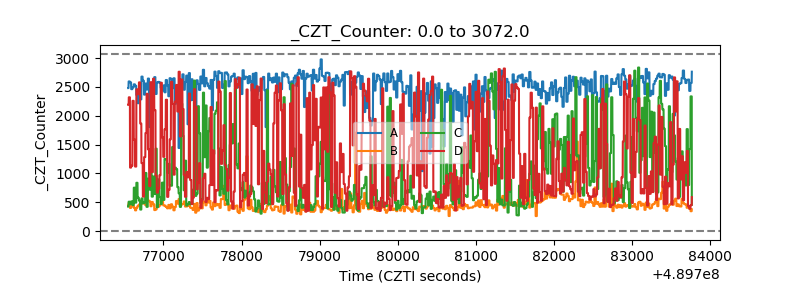 |
| +2.5 Volts monitor |  |
| +5 Volts monitor | 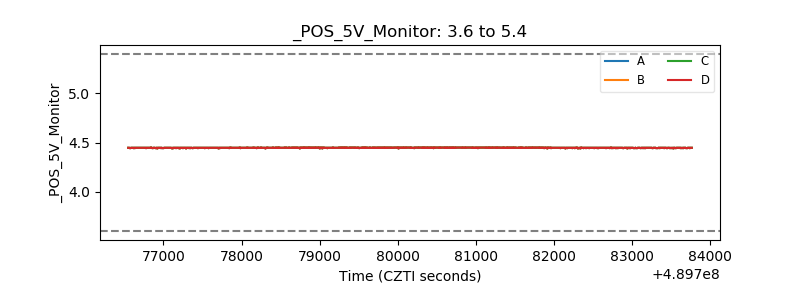 |
| _ROLL_ROT | 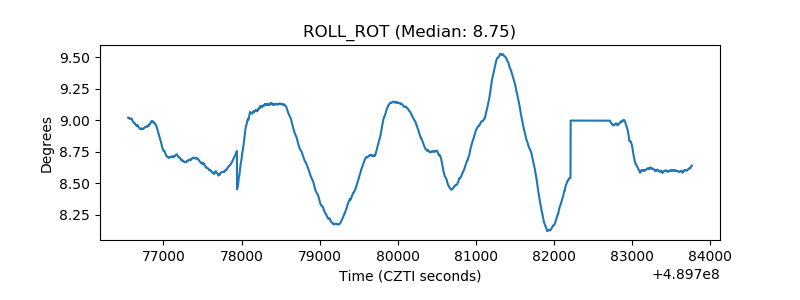 |
| _Roll_DEC | 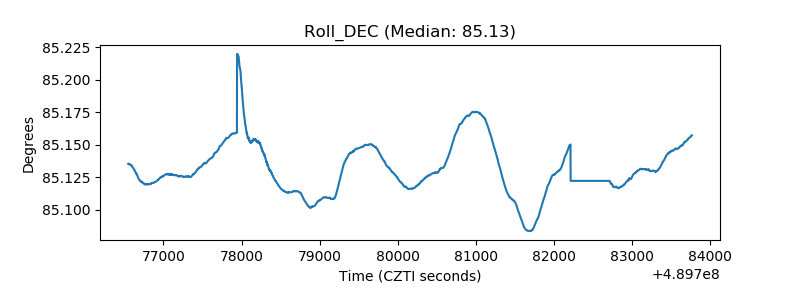 |
| _Roll_RA | 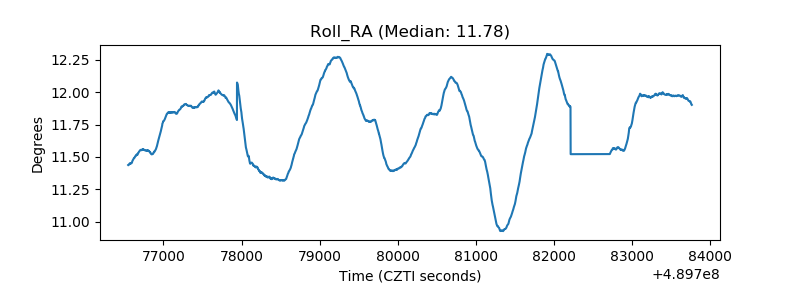 |
| Veto Counter | 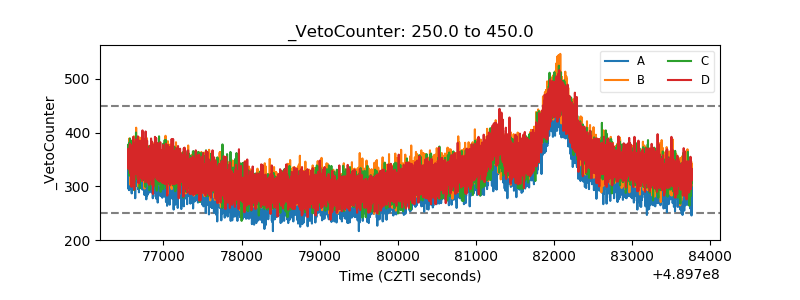 |