| Param | Original file | Final file |
|---|---|---|
| Filename | modeM0/AS1C09_011T06_9000006484_52909cztM0_level2.fits | modeM0/AS1C09_011T06_9000006484_52909cztM0_level2_quad_clean.evt |
| Size (bytes) | 1,110,401,280 | 74,877,120 |
| Size | 1.0 GB | 71.4 MB |
| Events in quadrant A | 18,563,264 | 4,761 |
| Events in quadrant B | 3,547,562 | 745,956 |
| Events in quadrant C | 9,252,630 | 502,958 |
| Events in quadrant D | 9,166,780 | 497,121 |
| Mode M0 | |||
|---|---|---|---|
| Quadrant | BADHDUFLAG | Total packets | Discarded packets |
| A | 0 | 60018 | 0 |
| B | 0 | 15910 | 0 |
| C | 0 | 32679 | 0 |
| D | 0 | 32413 | 0 |
| Mode SS | |||
|---|---|---|---|
| Quadrant | BADHDUFLAG | Total packets | Discarded packets |
| A | 0 | 148 | 0 |
| B | 0 | 148 | 0 |
| C | 0 | 148 | 0 |
| D | 0 | 148 | 0 |
| Quadrant | Total seconds | Saturated seconds | Saturation percentage |
|---|---|---|---|
| A | 7411 | 7379 | 99.568209% |
| B | 7412 | 50 | 0.674582% |
| C | 7412 | 1999 | 26.969779% |
| D | 7412 | 1901 | 25.647598% |
Noise dominated data is calculated using 1-second bins in cleaned event files. If a bin has >2000 counts, and if more than 50% of those come from <1% of pixels, then it is considered to be noise-dominated and hence unusable.
| Quadrant | # 1 sec bins | Bins with >0 counts | Bins with >2000 counts | High rate bins dominated by noise | Noise dominated (total time) | Noise dominated (detector-on time) | Marked lightcurve |
|---|---|---|---|---|---|---|---|
| A | 7411 | 7411 | 7003 | 7003 | 94.49% | 94.49% | 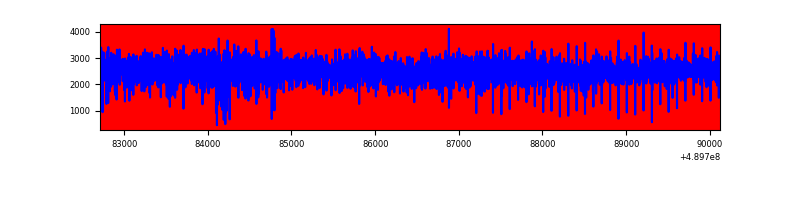 |
| B | 7412 | 7412 | 34 | 34 | 0.46% | 0.46% | 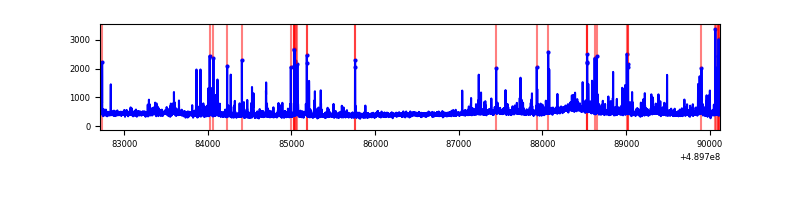 |
| C | 7412 | 7412 | 1611 | 1611 | 21.74% | 21.74% | 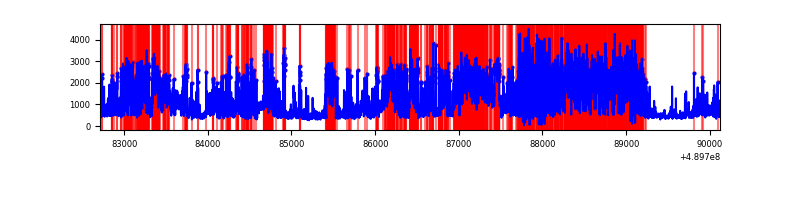 |
| D | 7412 | 7412 | 1518 | 1518 | 20.48% | 20.48% | 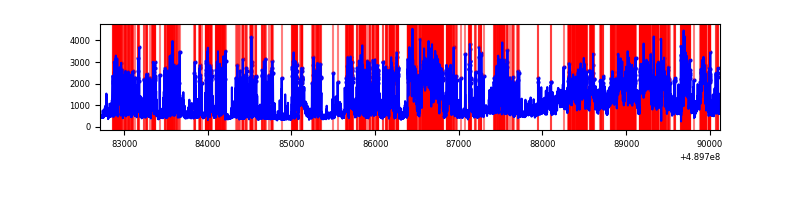 |
Top three noisy pixels from each quadrant. If the there are fewer than three noisy pixels in the level2.evt file, extra rows are filled as -1
| Pixel properties | Quadrant properties | ||||||
|---|---|---|---|---|---|---|---|
| Quadrant | DetID | PixID | Counts | Sigma | Mean | Median | Sigma |
| A | 9 | 191 | 16896572 | 296935.45 | 217 | 211 | 56.9 |
| A | 12 | 17 | 459769 | 8076.24 | 217 | 211 | 56.9 |
| A | 4 | 238 | 68009 | 1191.48 | 217 | 211 | 56.9 |
| B | 4 | 81 | 91700 | 549.98 | 773 | 746 | 165.4 |
| B | 10 | 247 | 71553 | 428.15 | 773 | 746 | 165.4 |
| B | 5 | 185 | 61656 | 368.31 | 773 | 746 | 165.4 |
| C | 7 | 80 | 2695107 | 14911.91 | 658 | 652 | 180.7 |
| C | 15 | 224 | 1700389 | 9406.85 | 658 | 652 | 180.7 |
| C | 15 | 158 | 705190 | 3899.12 | 658 | 652 | 180.7 |
| D | 8 | 176 | 3016725 | 15526.64 | 675 | 645 | 194.3 |
| D | 10 | 172 | 1307056 | 6725.34 | 675 | 645 | 194.3 |
| D | 15 | 125 | 729331 | 3751.24 | 675 | 645 | 194.3 |
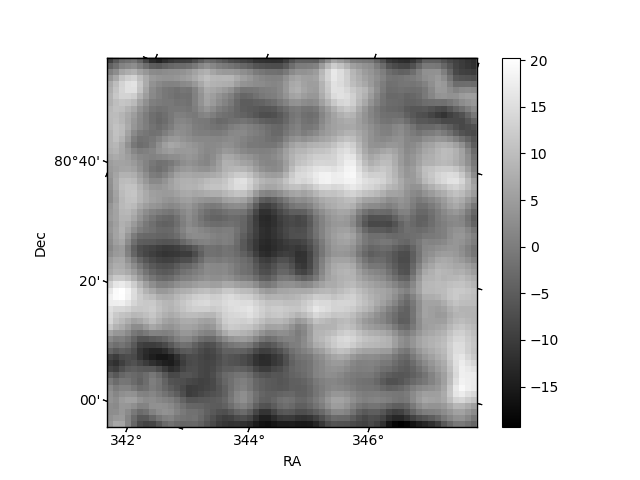
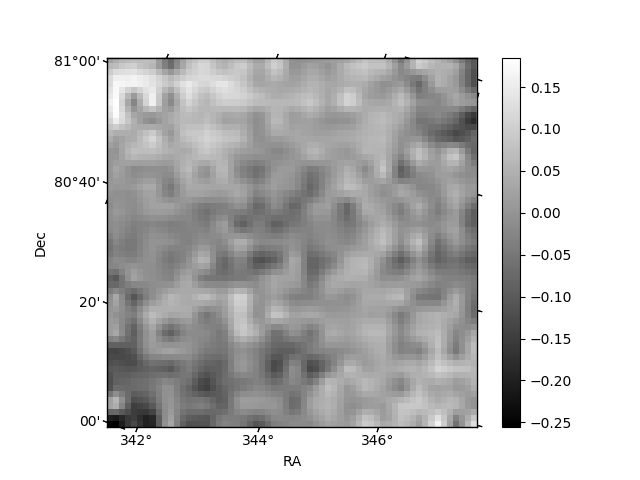
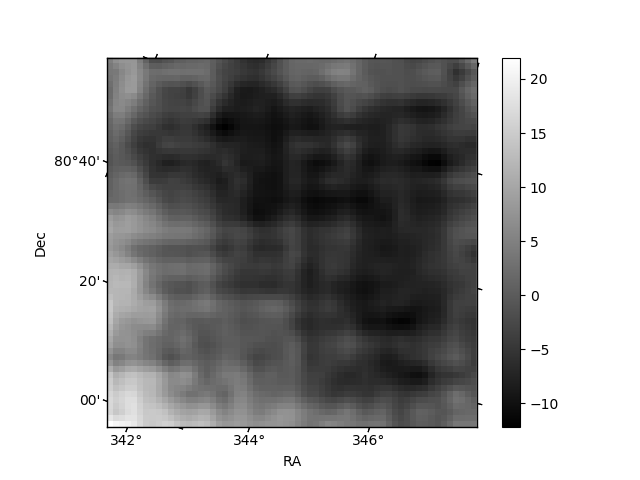
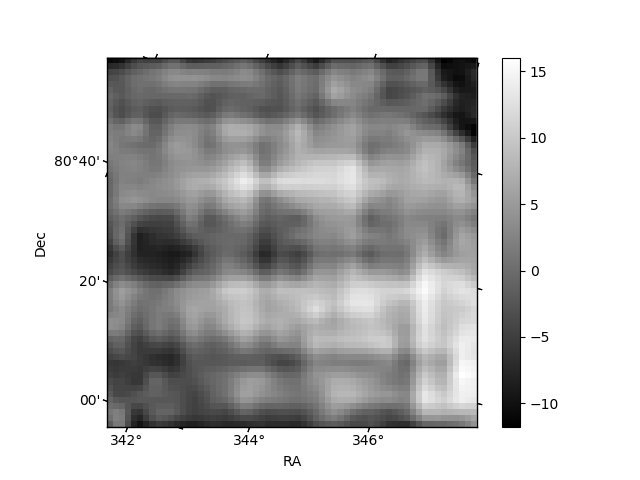
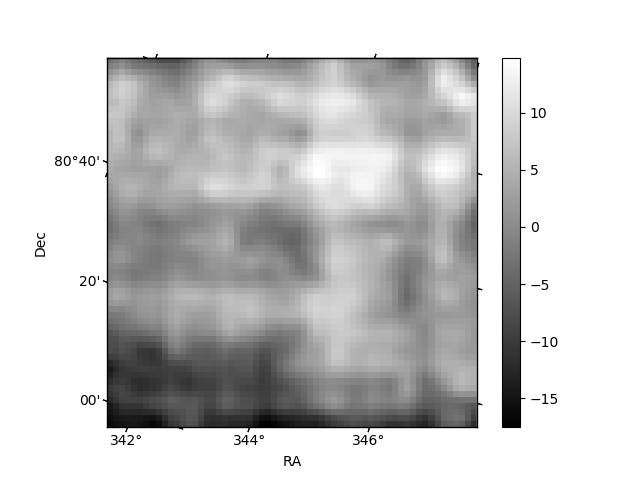
Histogram calculated using DETX and DETY for each event in the final _common_clean file
| Quadrant A | 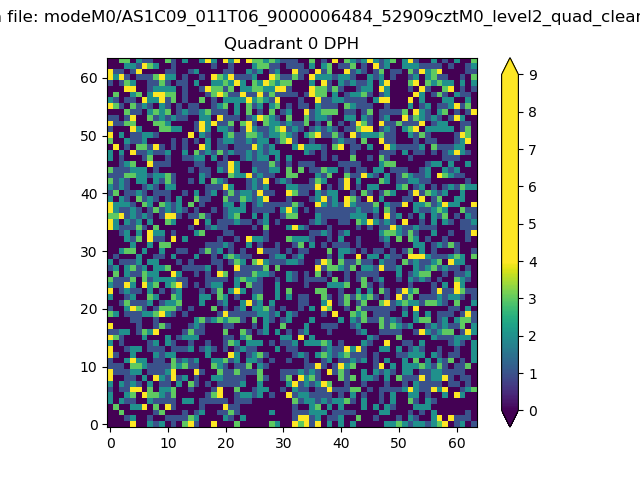 |
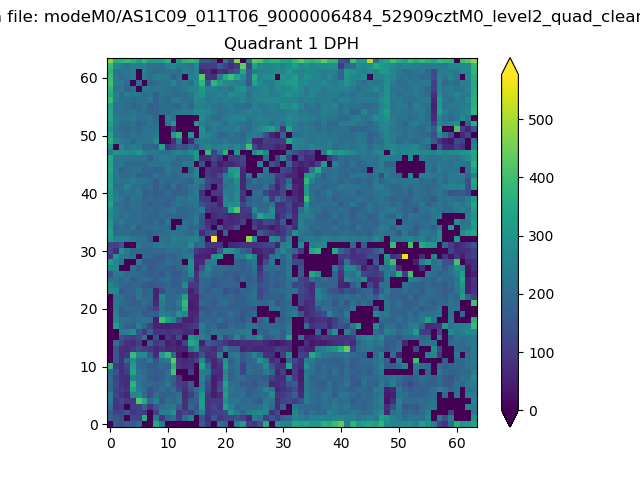 |
Quadrant B |
|---|---|---|---|
| Quadrant D | 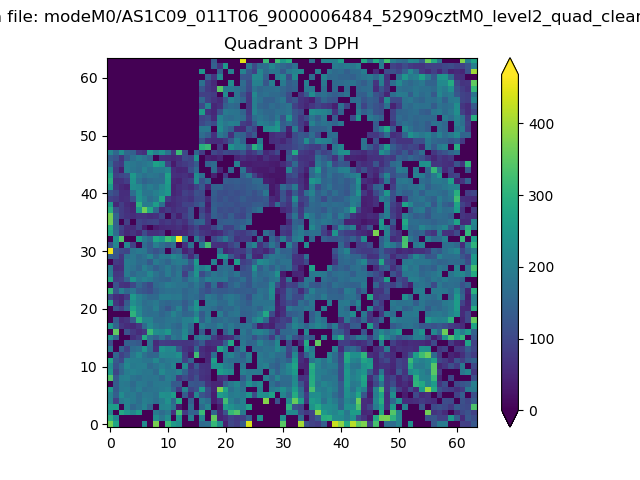 |
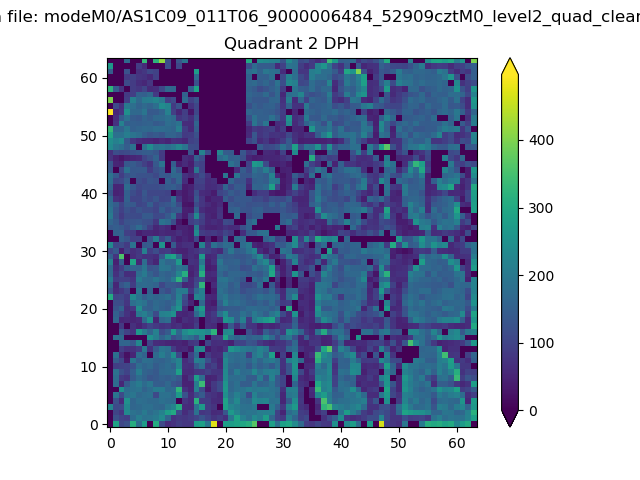 |
Quadrant C |
| Plot type | Count rate plots | Images |
|---|---|---|
| Comparison with Poisson distribution Blue bars denote a histogram of data divided into 1 sec bins. Red curve is a Poisson curve with rate = median count rate of data. |
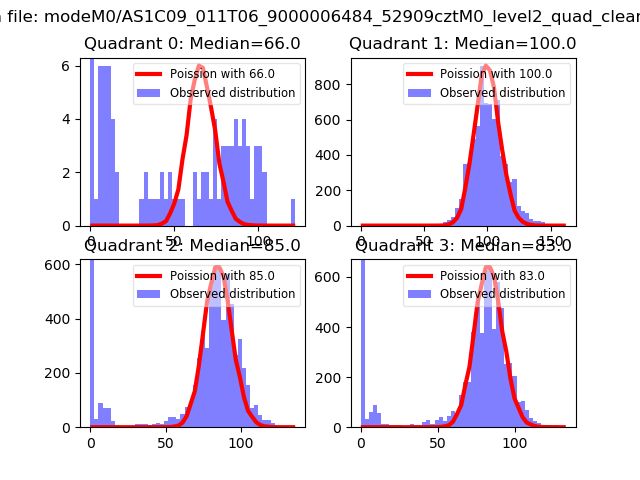 |
 |
| Quadrant-wise count rates Data is divided into 100 sec bins |
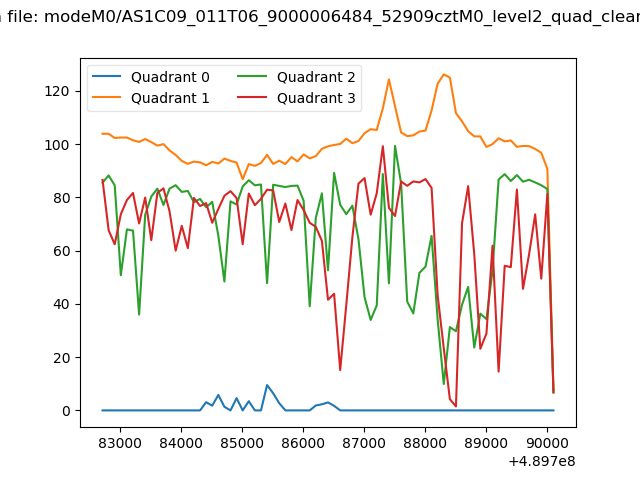 |
|
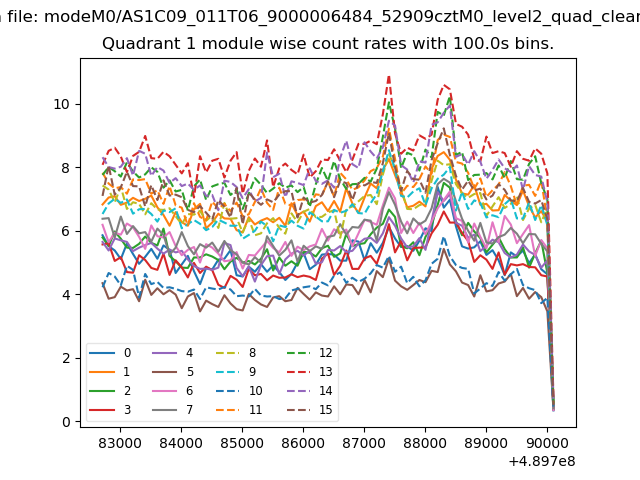
| Module-wise count rates for Quadrant A Data is divided into 100 sec bins |
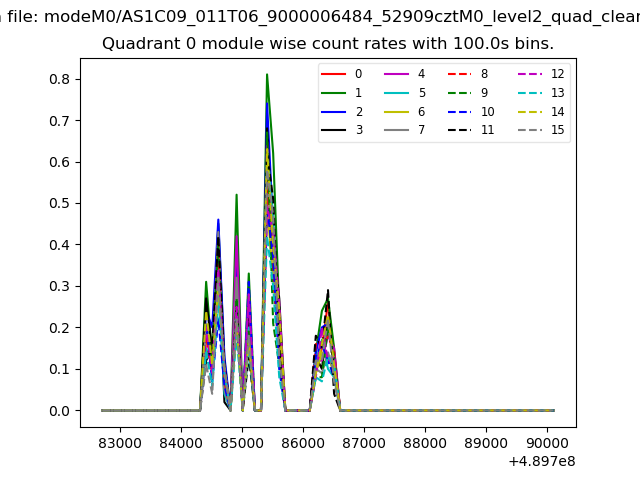 |
 |
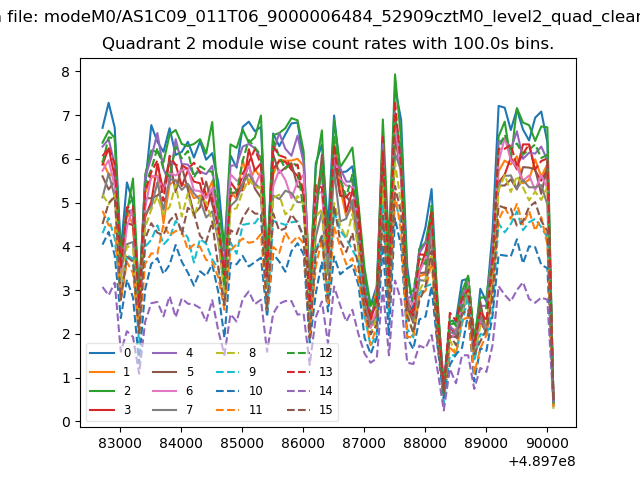
| Module-wise count rates for Quadrant B Data is divided into 100 sec bins |
 |
 |
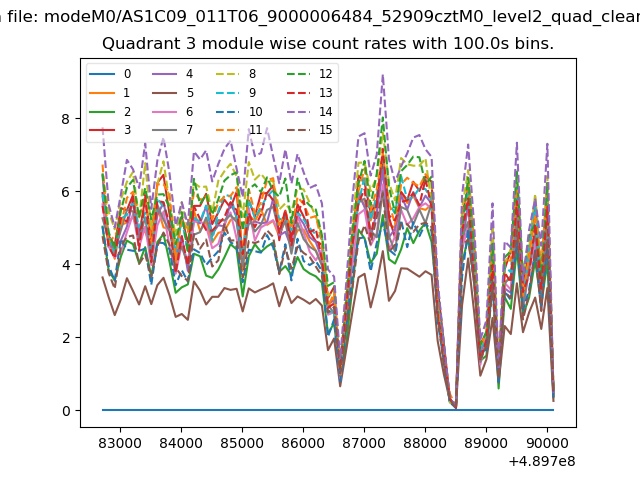
| Module-wise count rates for Quadrant C Data is divided into 100 sec bins |
 |
 |
| Module-wise count rates for Quadrant D Data is divided into 100 sec bins |
 |
 |
| Parameter | Plot |
|---|---|
| CZT HV Monitor | 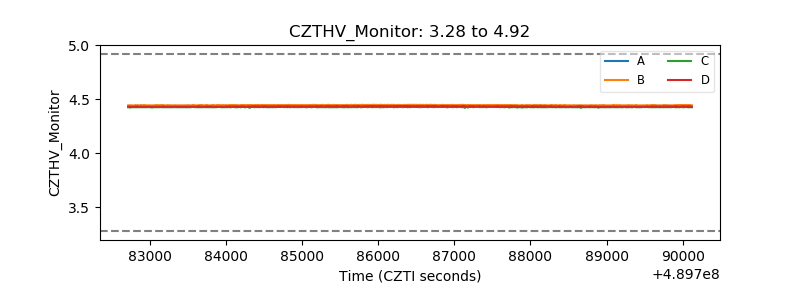 |
| D_VDD | 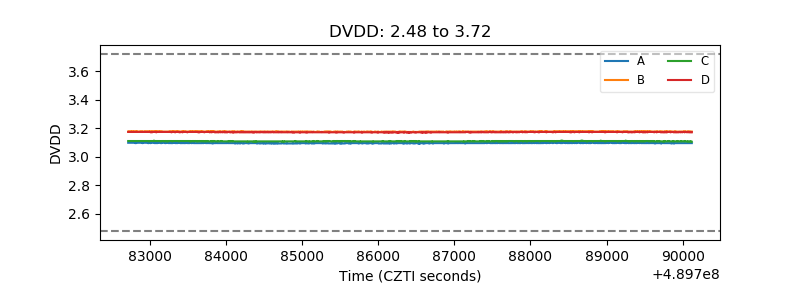 |
| Temperature 1 | 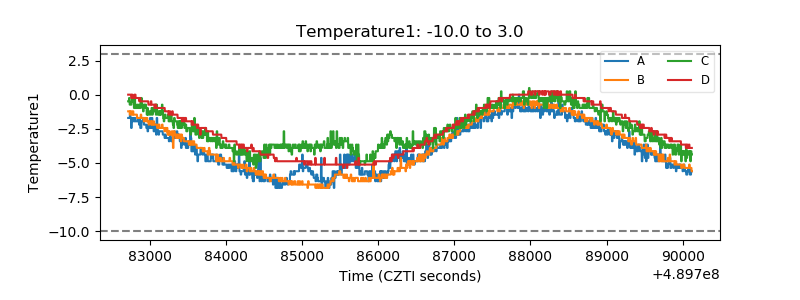 |
| Veto HV Monitor |  |
| Veto LLD | 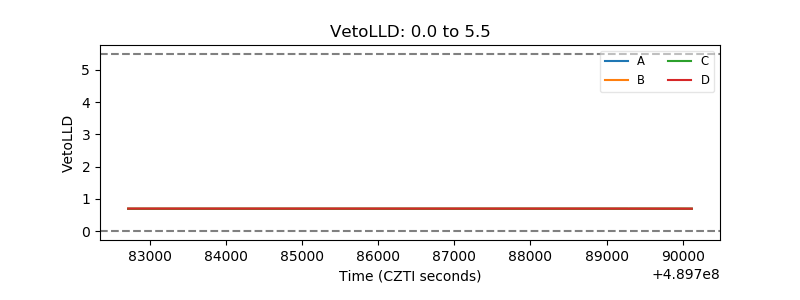 |
| Alpha Counter | 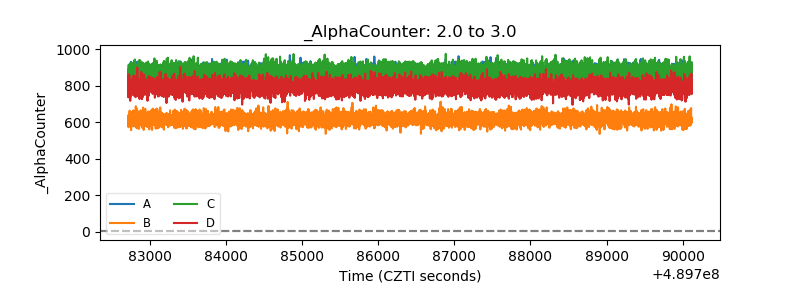 |
| _CPM_Rate | 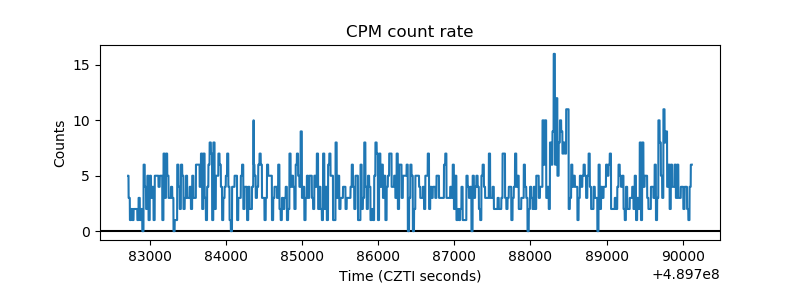 |
| CZT Counter | 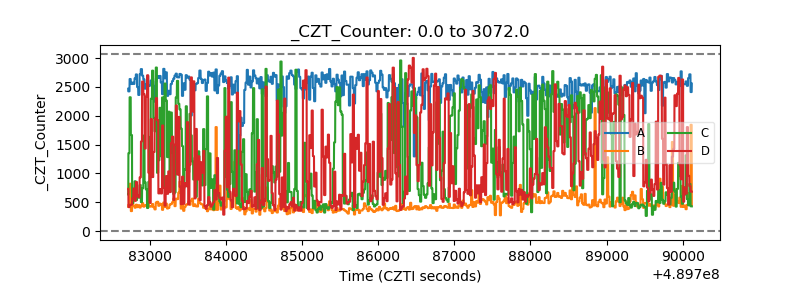 |
| +2.5 Volts monitor |  |
| +5 Volts monitor |  |
| _ROLL_ROT | 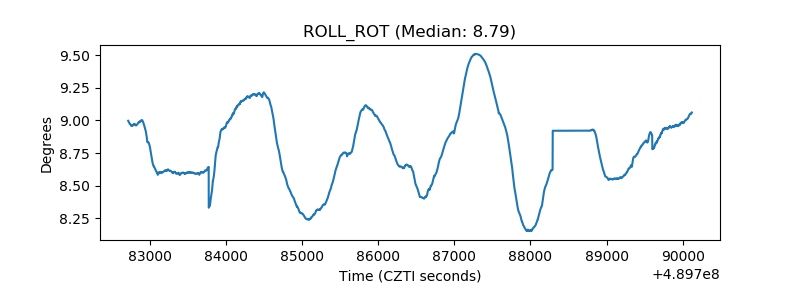 |
| _Roll_DEC | 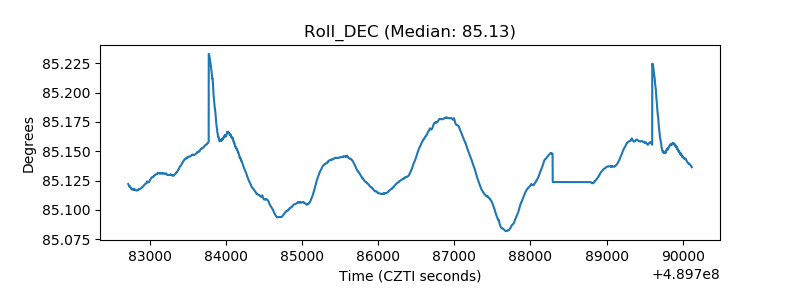 |
| _Roll_RA | 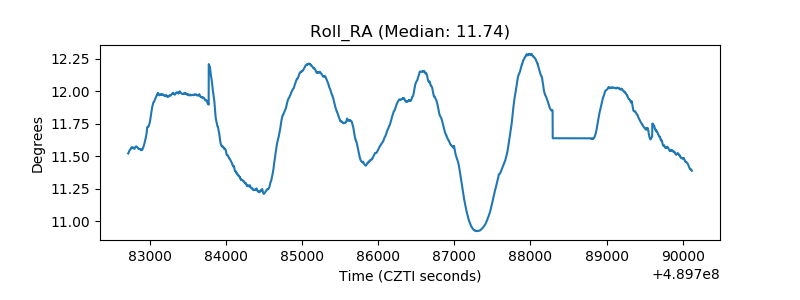 |
| Veto Counter | 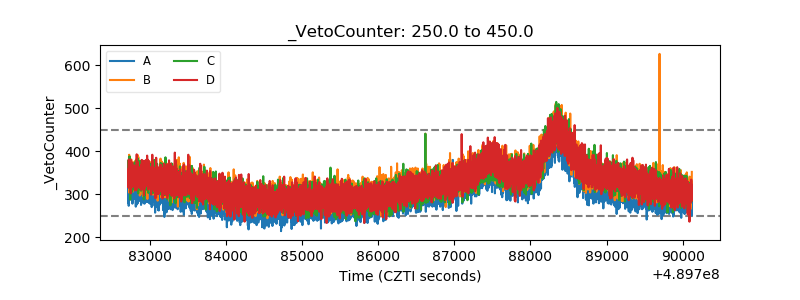 |