| Param | Original file | Final file |
|---|---|---|
| Filename | modeM0/AS1C09_011T06_9000006484_52912cztM0_level2.fits | modeM0/AS1C09_011T06_9000006484_52912cztM0_level2_quad_clean.evt |
| Size (bytes) | 1,973,615,040 | 128,266,560 |
| Size | 1.8 GB | 122.3 MB |
| Events in quadrant A | 33,756,956 | 1,444 |
| Events in quadrant B | 13,148,432 | 922,657 |
| Events in quadrant C | 9,745,340 | 1,122,085 |
| Events in quadrant D | 15,367,952 | 907,639 |
| Mode M9 | |||
|---|---|---|---|
| Quadrant | BADHDUFLAG | Total packets | Discarded packets |
| A | 0 | 3 | 0 |
| B | 0 | 3 | 0 |
| C | 0 | 3 | 0 |
| D | 0 | 3 | 0 |
| Mode M0 | |||
|---|---|---|---|
| Quadrant | BADHDUFLAG | Total packets | Discarded packets |
| A | 0 | 108953 | 1 |
| B | 0 | 48623 | 1 |
| C | 0 | 38511 | 1 |
| D | 0 | 55205 | 1 |
| Mode SS | |||
|---|---|---|---|
| Quadrant | BADHDUFLAG | Total packets | Discarded packets |
| A | 0 | 272 | 0 |
| B | 0 | 272 | 0 |
| C | 0 | 272 | 0 |
| D | 0 | 272 | 0 |
| Quadrant | Total seconds | Saturated seconds | Saturation percentage |
|---|---|---|---|
| A | 13443 | 13432 | 99.918173% |
| B | 13443 | 4109 | 30.566094% |
| C | 13444 | 967 | 7.192800% |
| D | 13443 | 2916 | 21.691587% |
Noise dominated data is calculated using 1-second bins in cleaned event files. If a bin has >2000 counts, and if more than 50% of those come from <1% of pixels, then it is considered to be noise-dominated and hence unusable.
| Quadrant | # 1 sec bins | Bins with >0 counts | Bins with >2000 counts | High rate bins dominated by noise | Noise dominated (total time) | Noise dominated (detector-on time) | Marked lightcurve |
|---|---|---|---|---|---|---|---|
| A | 13803 | 13444 | 12713 | 12713 | 92.10% | 94.56% | 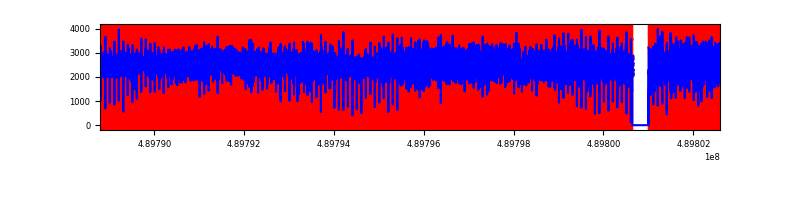 |
| B | 13803 | 13443 | 1909 | 1909 | 13.83% | 14.20% | 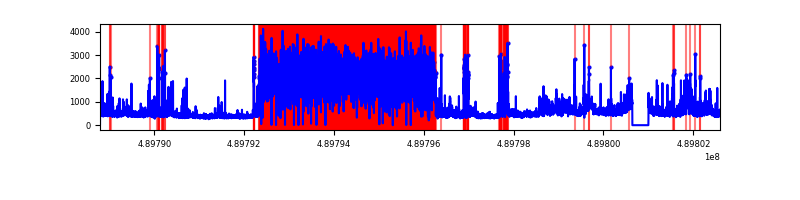 |
| C | 13804 | 13445 | 647 | 647 | 4.69% | 4.81% | 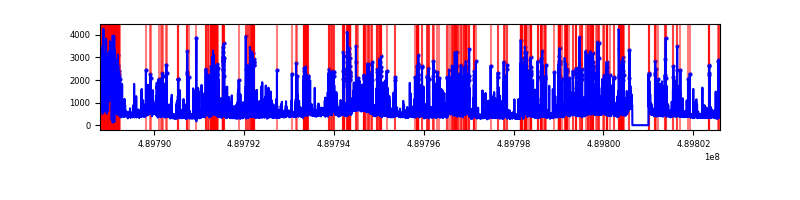 |
| D | 13803 | 13444 | 2467 | 2467 | 17.87% | 18.35% | 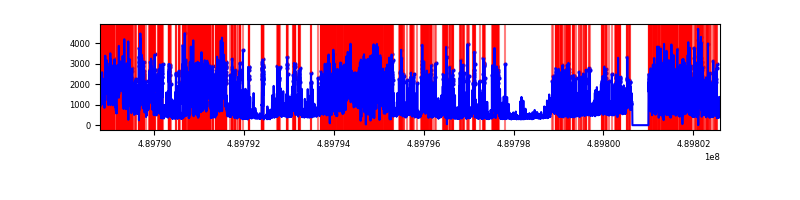 |
Top three noisy pixels from each quadrant. If the there are fewer than three noisy pixels in the level2.evt file, extra rows are filled as -1
| Pixel properties | Quadrant properties | ||||||
|---|---|---|---|---|---|---|---|
| Quadrant | DetID | PixID | Counts | Sigma | Mean | Median | Sigma |
| A | 9 | 191 | 31600315 | 362054.98 | 338 | 330 | 87.3 |
| A | 12 | 17 | 255527 | 2923.9 | 338 | 330 | 87.3 |
| A | 4 | 238 | 160702 | 1837.45 | 338 | 330 | 87.3 |
| B | 12 | 32 | 7623337 | 34953.63 | 1035 | 999 | 218.1 |
| B | 7 | 0 | 343204 | 1569.24 | 1035 | 999 | 218.1 |
| B | 10 | 44 | 216078 | 986.28 | 1035 | 999 | 218.1 |
| C | 15 | 224 | 1048247 | 2796.37 | 1359 | 1348 | 374.4 |
| C | 7 | 80 | 846946 | 2258.67 | 1359 | 1348 | 374.4 |
| C | 15 | 178 | 749026 | 1997.12 | 1359 | 1348 | 374.4 |
| D | 8 | 176 | 5179074 | 14463.01 | 1241 | 1186 | 358.0 |
| D | 15 | 125 | 1287207 | 3592.15 | 1241 | 1186 | 358.0 |
| D | 2 | 249 | 1205057 | 3362.68 | 1241 | 1186 | 358.0 |
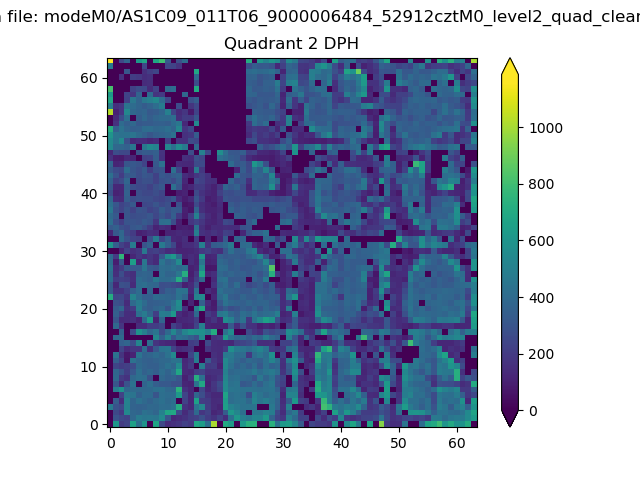
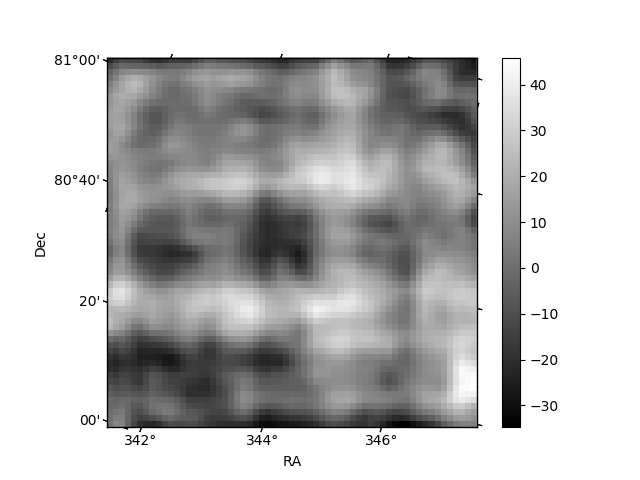
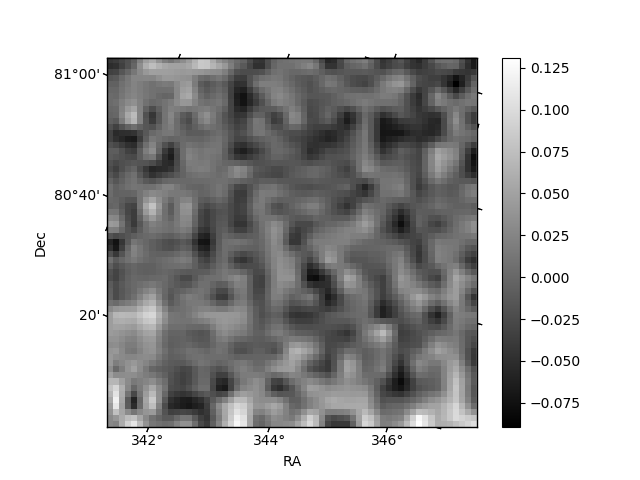
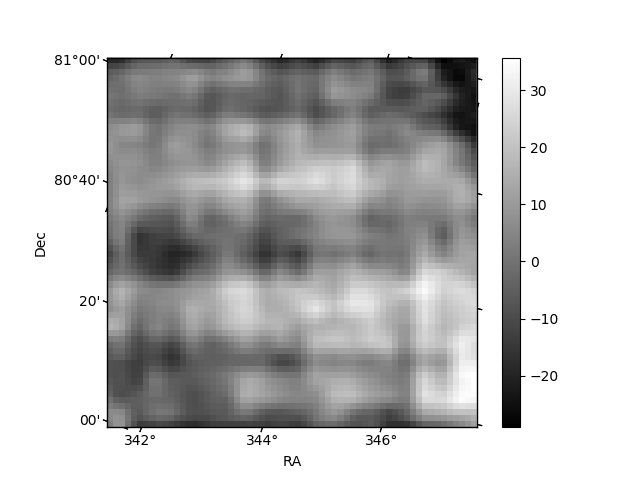
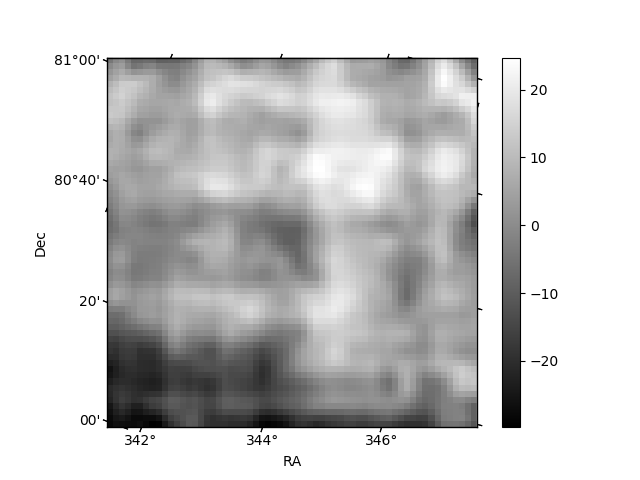
Histogram calculated using DETX and DETY for each event in the final _common_clean file
| Quadrant A | 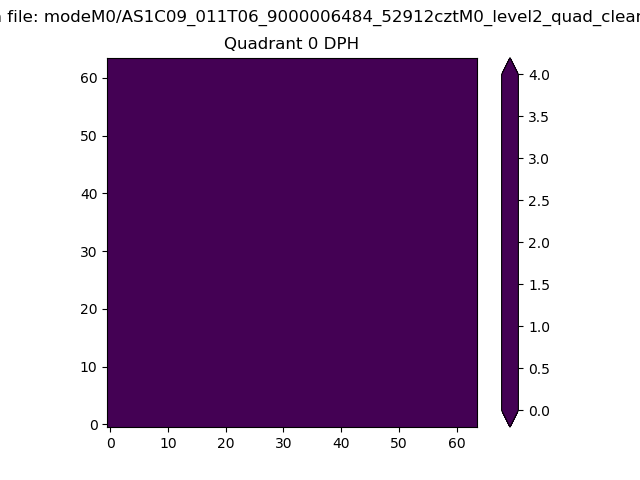 |
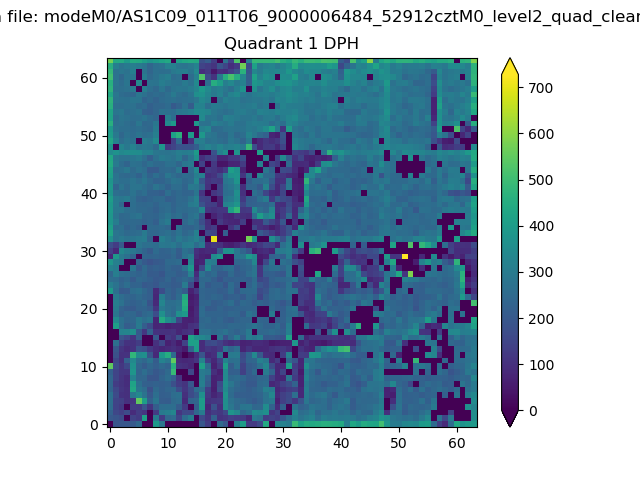 |
Quadrant B |
|---|---|---|---|
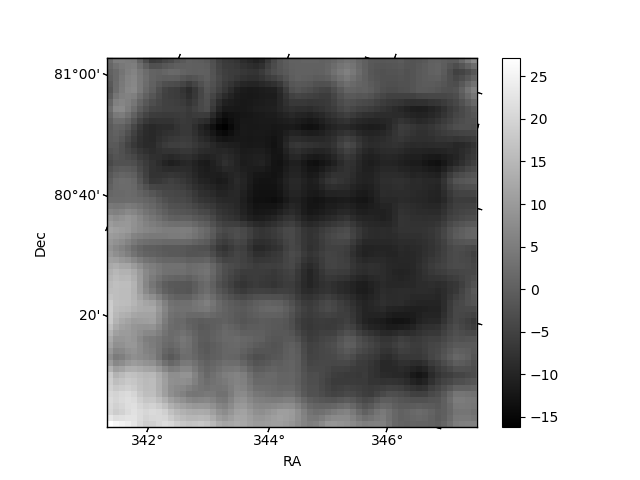
| Quadrant D | 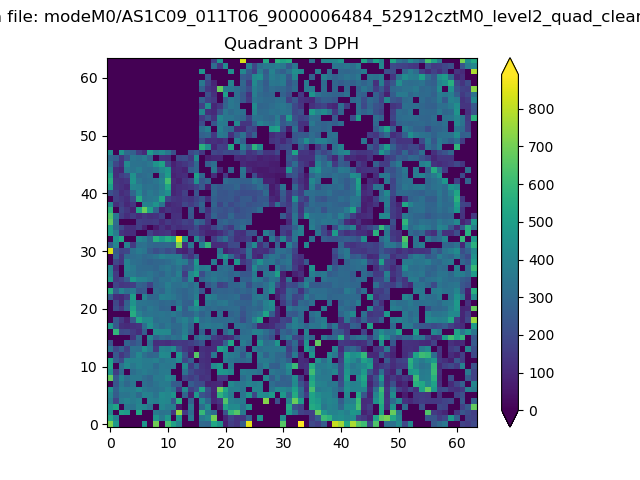 |
 |
Quadrant C |
| Plot type | Count rate plots | Images |
|---|---|---|
| Comparison with Poisson distribution Blue bars denote a histogram of data divided into 1 sec bins. Red curve is a Poisson curve with rate = median count rate of data. |
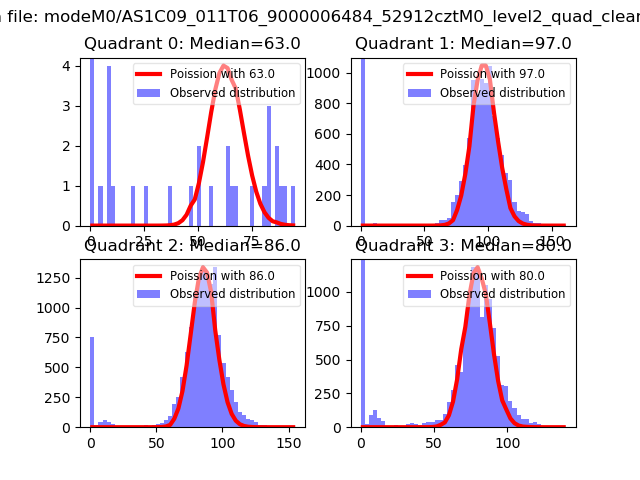 |
 |
| Quadrant-wise count rates Data is divided into 100 sec bins |
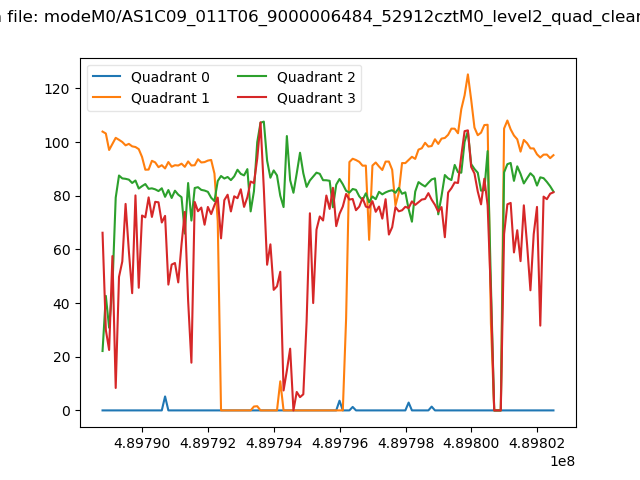 |
|
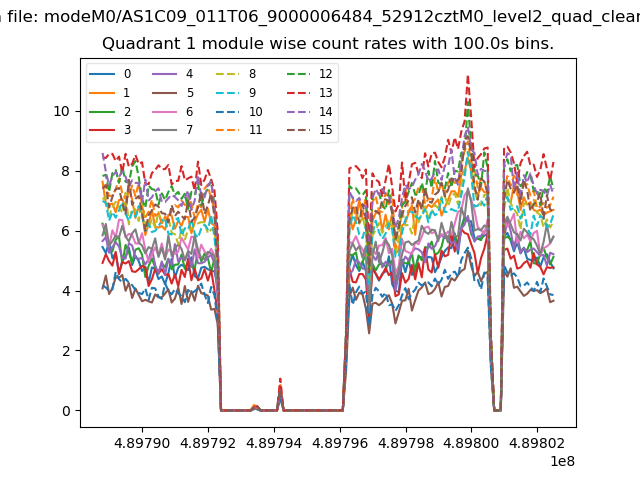
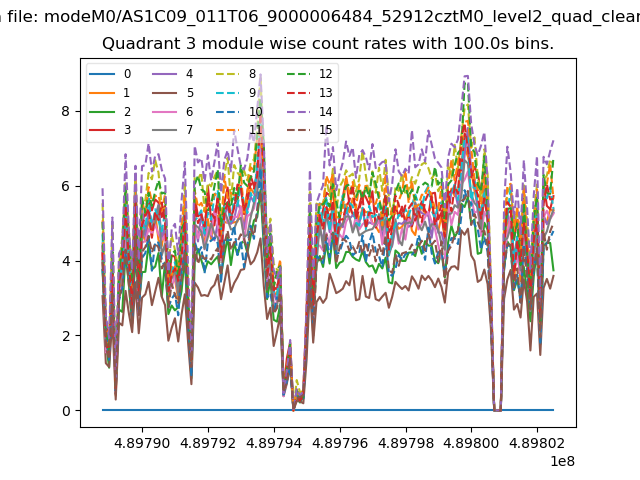
| Module-wise count rates for Quadrant A Data is divided into 100 sec bins |
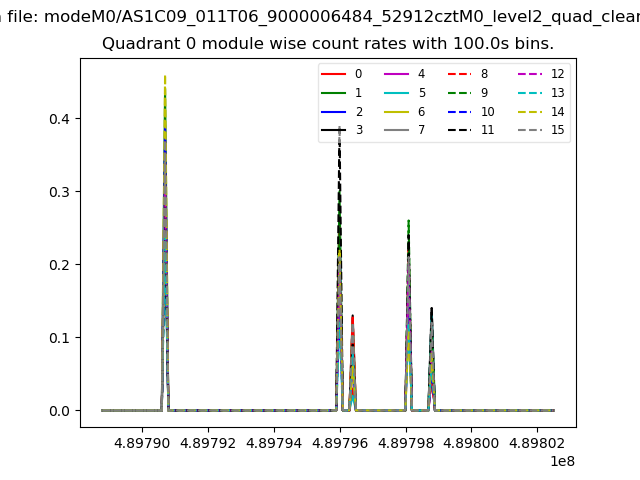 |
 |
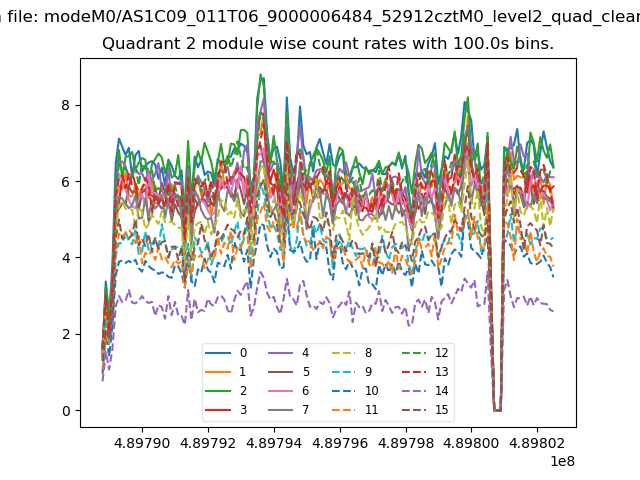
| Module-wise count rates for Quadrant B Data is divided into 100 sec bins |
 |
 |
| Module-wise count rates for Quadrant C Data is divided into 100 sec bins |
 |
 |
| Module-wise count rates for Quadrant D Data is divided into 100 sec bins |
 |
 |
| Parameter | Plot |
|---|---|
| CZT HV Monitor | 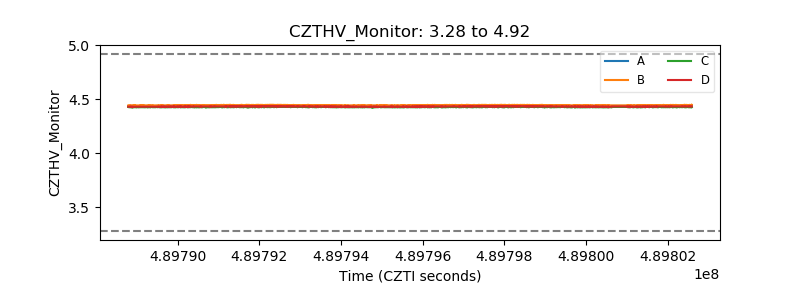 |
| D_VDD | 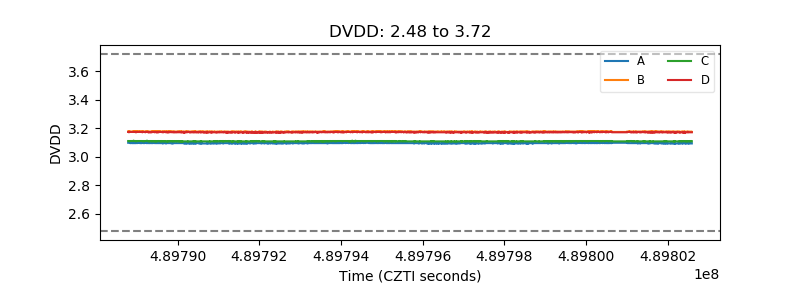 |
| Temperature 1 | 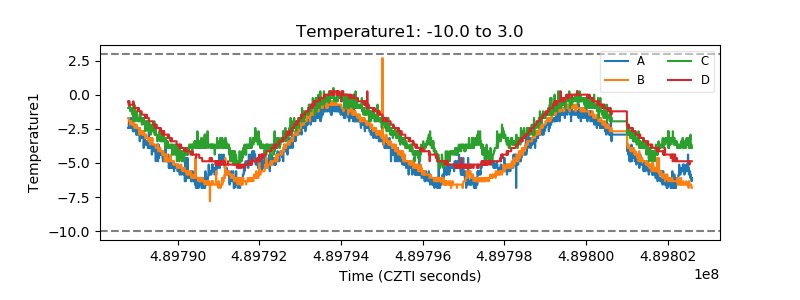 |
| Veto HV Monitor | 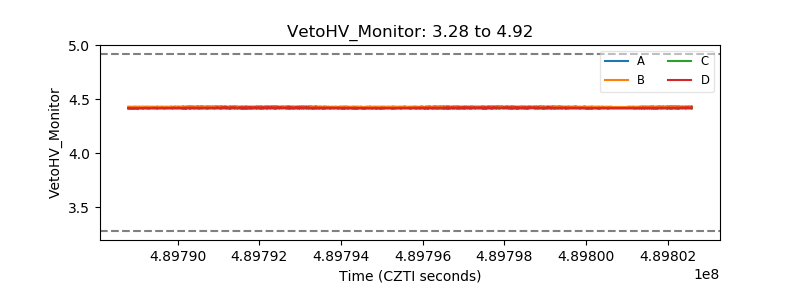 |
| Veto LLD | 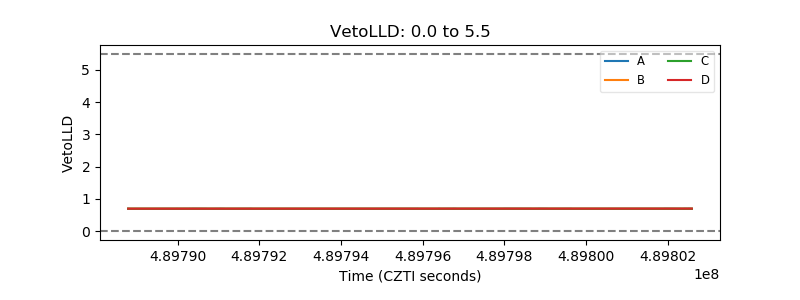 |
| Alpha Counter | 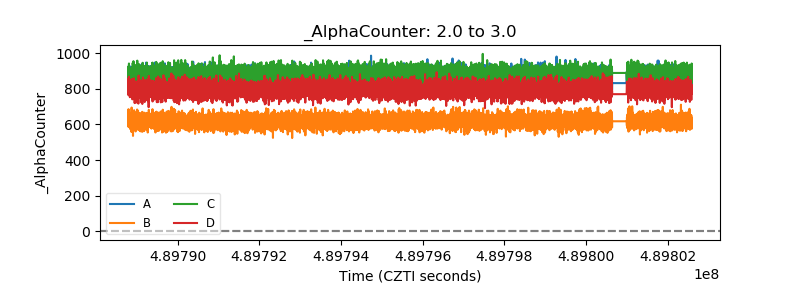 |
| _CPM_Rate | 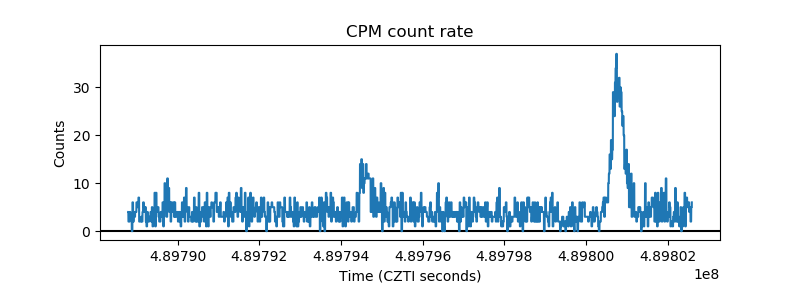 |
| CZT Counter | 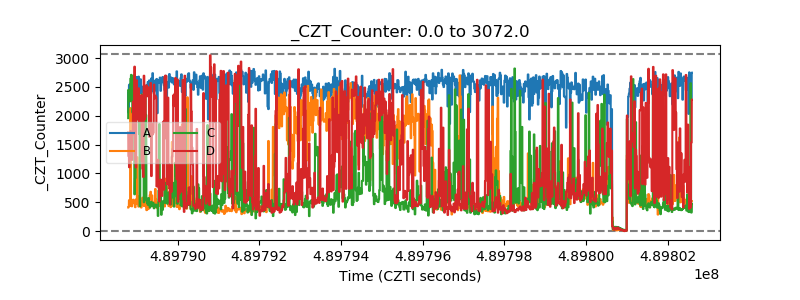 |
| +2.5 Volts monitor |  |
| +5 Volts monitor |  |
| _ROLL_ROT | 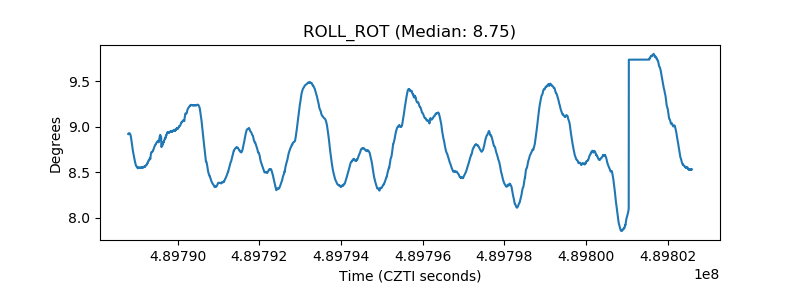 |
| _Roll_DEC | 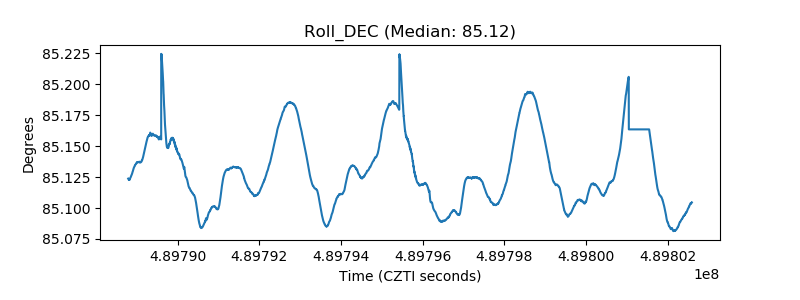 |
| _Roll_RA | 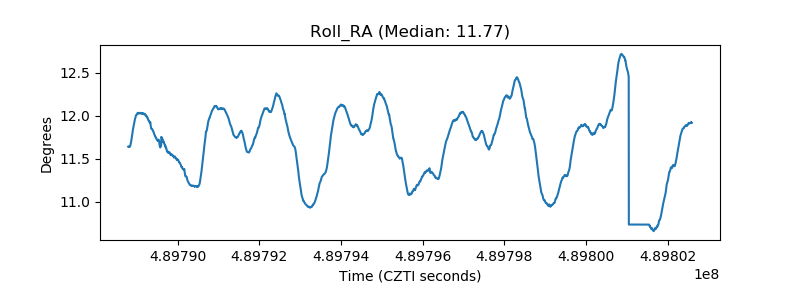 |
| Veto Counter | 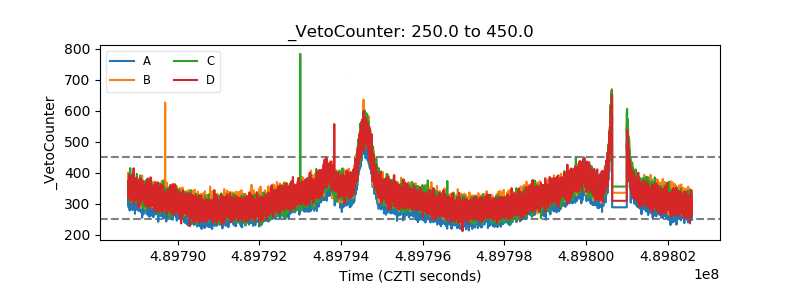 |