| Param | Original file | Final file |
|---|---|---|
| Filename | modeM0/AS1C09_011T06_9000006484_52914cztM0_level2.fits | modeM0/AS1C09_011T06_9000006484_52914cztM0_level2_quad_clean.evt |
| Size (bytes) | 1,098,789,120 | 70,462,080 |
| Size | 1.0 GB | 67.2 MB |
| Events in quadrant A | 16,451,513 | 128,270 |
| Events in quadrant B | 3,640,792 | 643,206 |
| Events in quadrant C | 5,361,993 | 553,291 |
| Events in quadrant D | 14,722,484 | 353,557 |
| Mode M9 | |||
|---|---|---|---|
| Quadrant | BADHDUFLAG | Total packets | Discarded packets |
| A | 0 | 9 | 0 |
| B | 0 | 9 | 0 |
| C | 0 | 9 | 0 |
| D | 0 | 9 | 0 |
| Mode M0 | |||
|---|---|---|---|
| Quadrant | BADHDUFLAG | Total packets | Discarded packets |
| A | 0 | 53189 | 0 |
| B | 0 | 15513 | 0 |
| C | 0 | 20504 | 0 |
| D | 0 | 48124 | 0 |
| Mode SS | |||
|---|---|---|---|
| Quadrant | BADHDUFLAG | Total packets | Discarded packets |
| A | 0 | 132 | 0 |
| B | 0 | 132 | 0 |
| C | 0 | 132 | 0 |
| D | 0 | 132 | 0 |
| Quadrant | Total seconds | Saturated seconds | Saturation percentage |
|---|---|---|---|
| A | 6421 | 6421 | 100.000000% |
| B | 6451 | 189 | 2.929778% |
| C | 6446 | 599 | 9.292585% |
| D | 6429 | 4793 | 74.552808% |
Noise dominated data is calculated using 1-second bins in cleaned event files. If a bin has >2000 counts, and if more than 50% of those come from <1% of pixels, then it is considered to be noise-dominated and hence unusable.
| Quadrant | # 1 sec bins | Bins with >0 counts | Bins with >2000 counts | High rate bins dominated by noise | Noise dominated (total time) | Noise dominated (detector-on time) | Marked lightcurve |
|---|---|---|---|---|---|---|---|
| A | 7405 | 6437 | 5974 | 5974 | 80.68% | 92.81% | 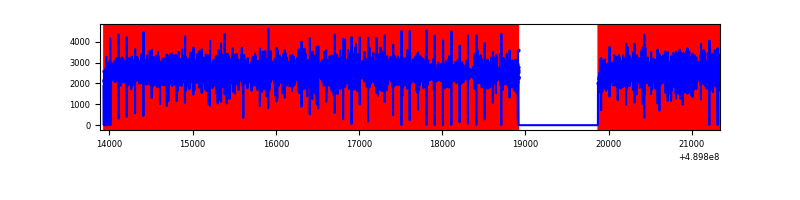 |
| B | 7434 | 6468 | 105 | 105 | 1.41% | 1.62% | 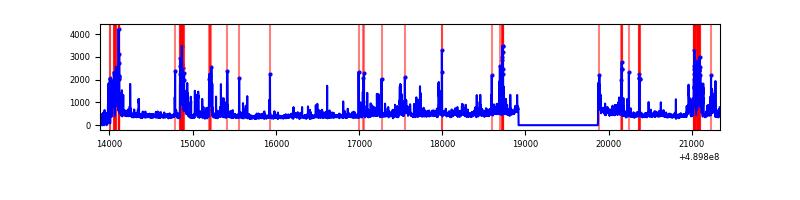 |
| C | 7449 | 6466 | 542 | 542 | 7.28% | 8.38% | 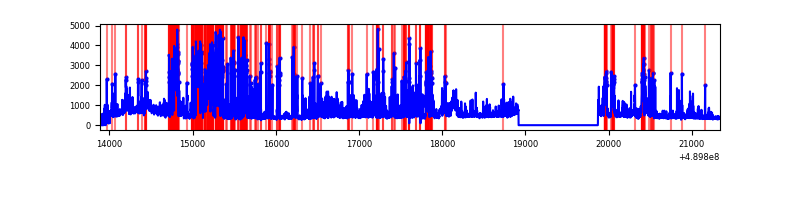 |
| D | 7418 | 6446 | 4683 | 4683 | 63.13% | 72.65% | 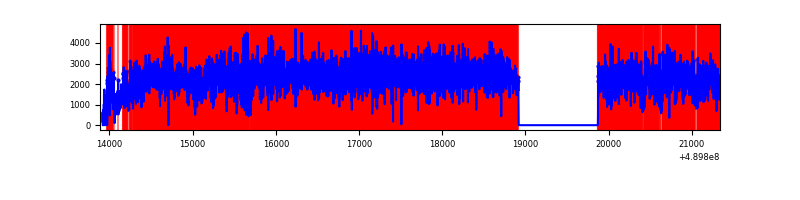 |
Top three noisy pixels from each quadrant. If the there are fewer than three noisy pixels in the level2.evt file, extra rows are filled as -1
| Pixel properties | Quadrant properties | ||||||
|---|---|---|---|---|---|---|---|
| Quadrant | DetID | PixID | Counts | Sigma | Mean | Median | Sigma |
| A | 9 | 191 | 15643324 | 383894.33 | 154 | 150 | 40.7 |
| A | 12 | 17 | 59374 | 1453.4 | 154 | 150 | 40.7 |
| A | 5 | 241 | 28070 | 685.18 | 154 | 150 | 40.7 |
| B | 1 | 255 | 618920 | 4440.32 | 655 | 631 | 139.2 |
| B | 0 | 213 | 129732 | 927.15 | 655 | 631 | 139.2 |
| B | 0 | 182 | 106524 | 760.48 | 655 | 631 | 139.2 |
| C | 7 | 80 | 1839461 | 10803.67 | 616 | 610 | 170.2 |
| C | 13 | 3 | 384268 | 2254.08 | 616 | 610 | 170.2 |
| C | 12 | 254 | 149274 | 873.44 | 616 | 610 | 170.2 |
| D | 15 | 78 | 9766315 | 81444.78 | 413 | 394 | 119.9 |
| D | 8 | 176 | 1872205 | 15610.33 | 413 | 394 | 119.9 |
| D | 8 | 48 | 900330 | 7505.19 | 413 | 394 | 119.9 |
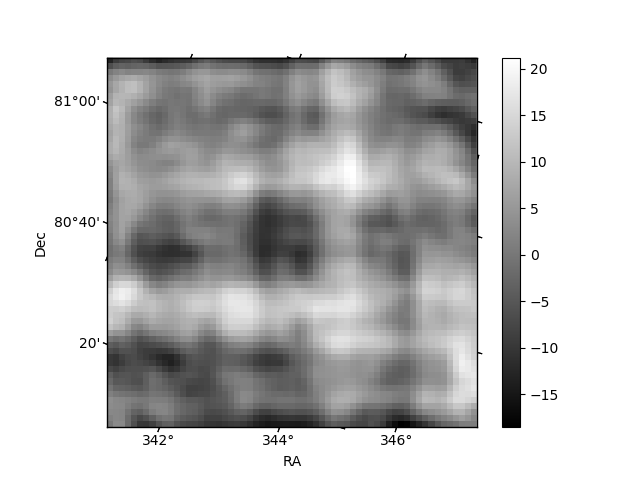
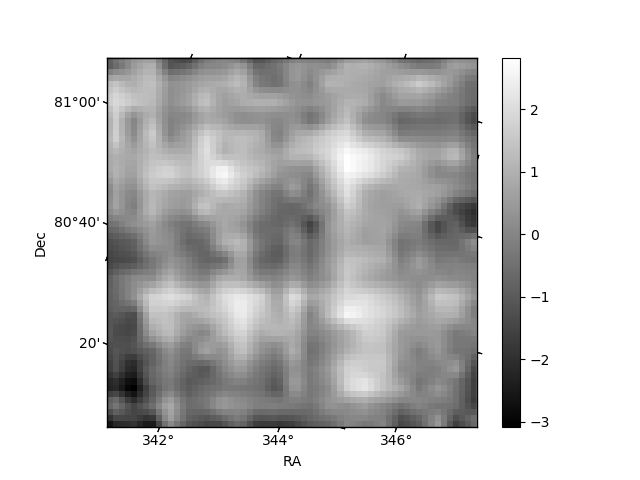
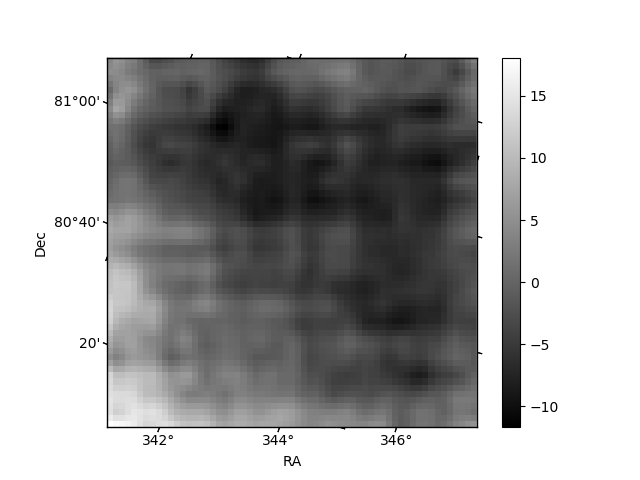
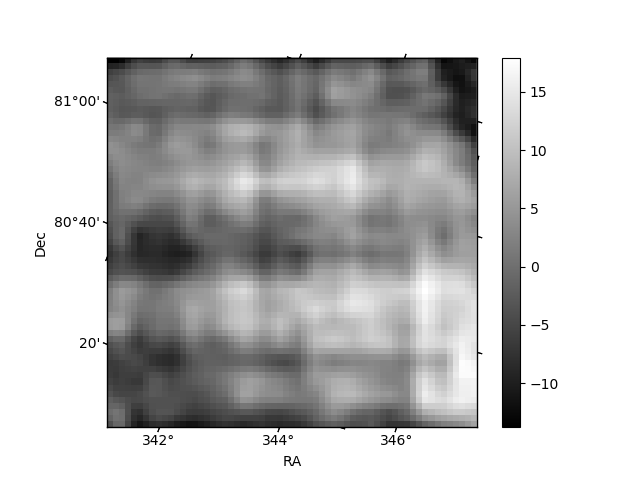
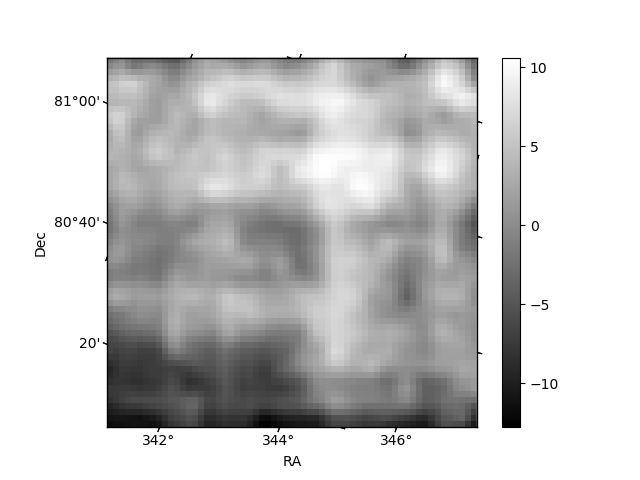
Histogram calculated using DETX and DETY for each event in the final _common_clean file
| Quadrant A | 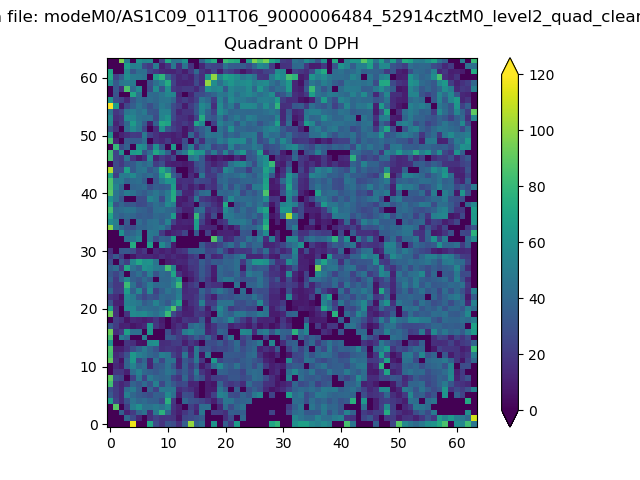 |
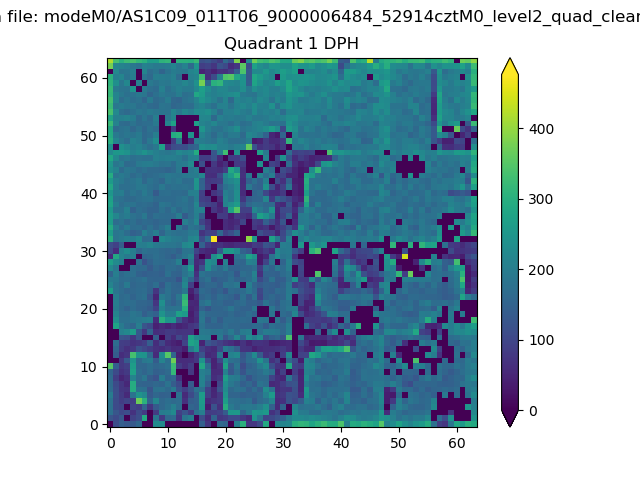 |
Quadrant B |
|---|---|---|---|
| Quadrant D | 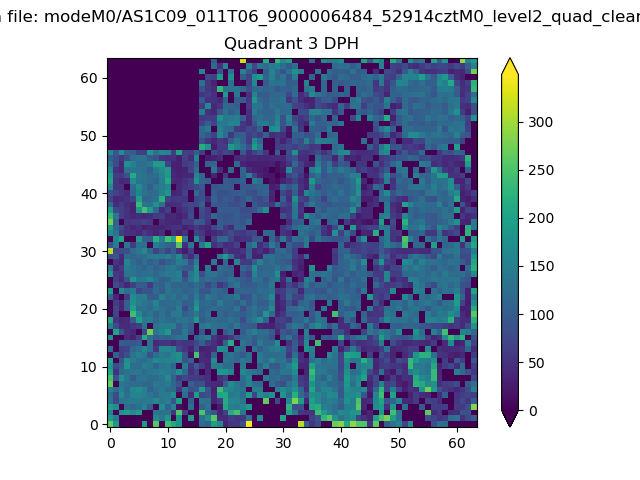 |
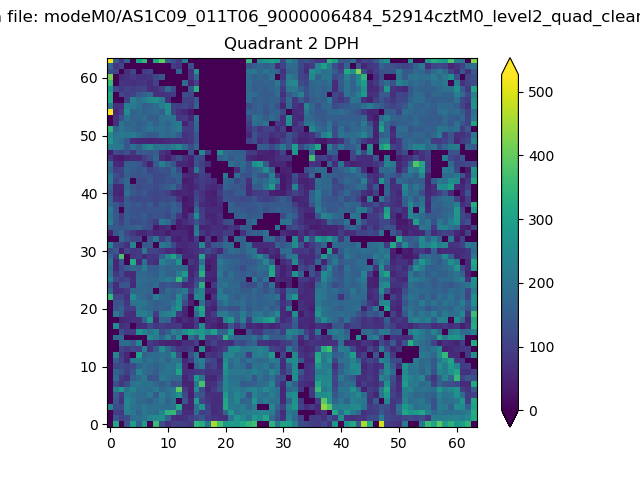 |
Quadrant C |
| Plot type | Count rate plots | Images |
|---|---|---|
| Comparison with Poisson distribution Blue bars denote a histogram of data divided into 1 sec bins. Red curve is a Poisson curve with rate = median count rate of data. |
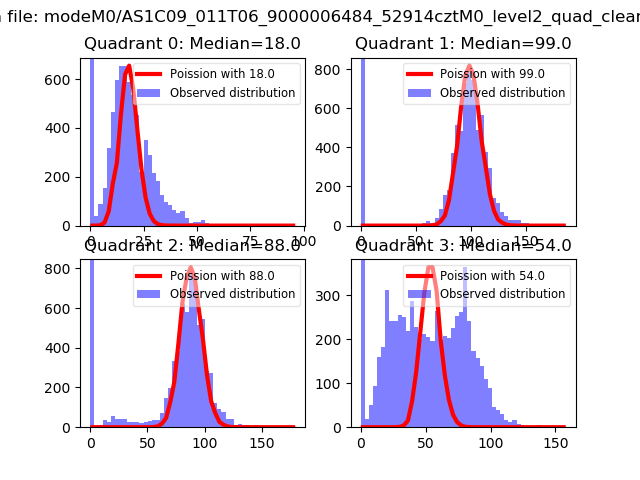 |
 |
| Quadrant-wise count rates Data is divided into 100 sec bins |
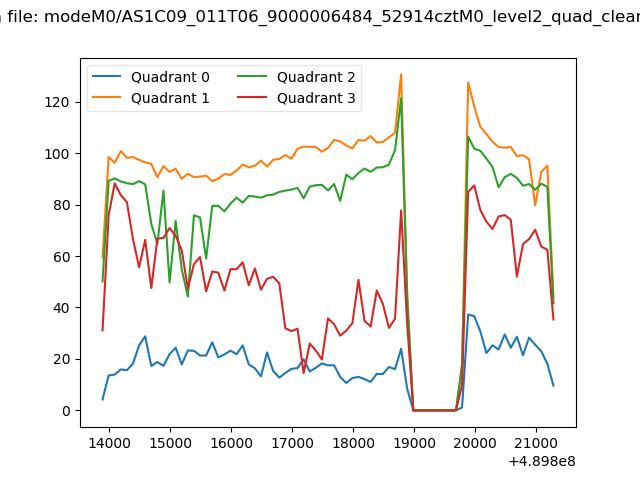 |
|
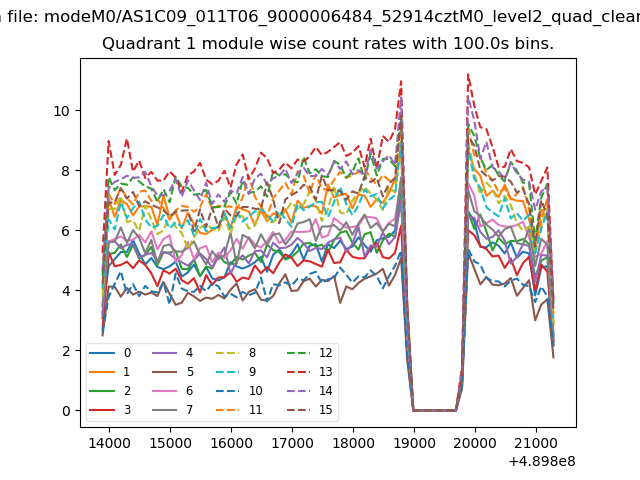
| Module-wise count rates for Quadrant A Data is divided into 100 sec bins |
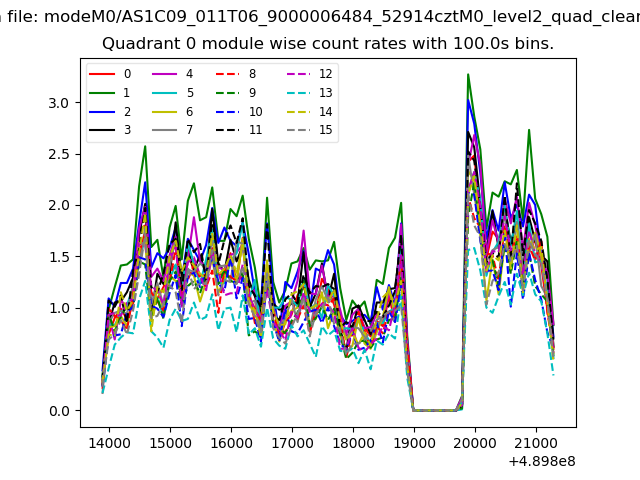 |
 |
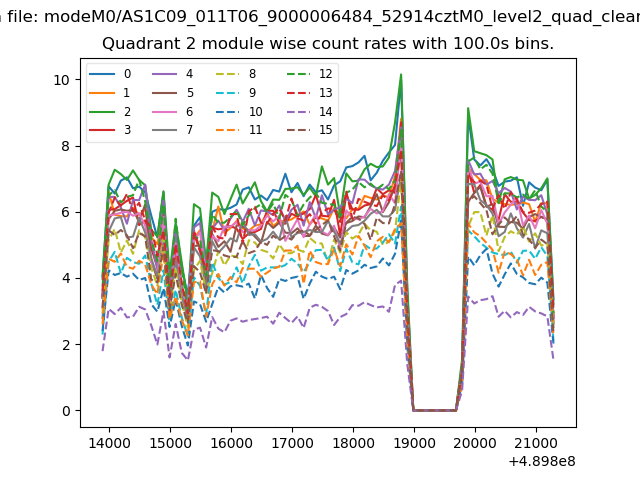
| Module-wise count rates for Quadrant B Data is divided into 100 sec bins |
 |
 |
| Module-wise count rates for Quadrant C Data is divided into 100 sec bins |
 |
 |
| Module-wise count rates for Quadrant D Data is divided into 100 sec bins |
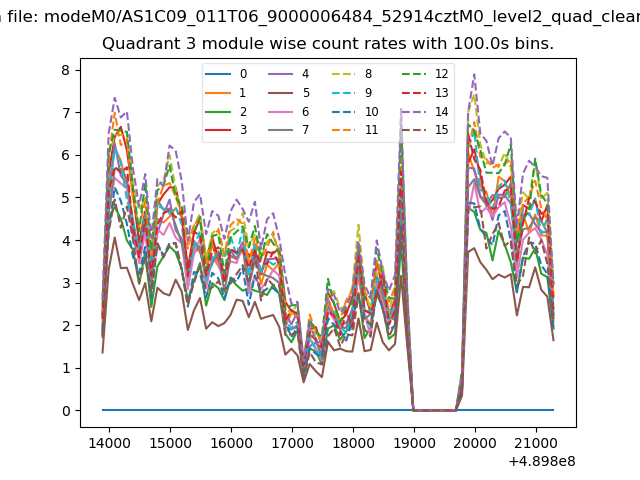 |
 |
| Parameter | Plot |
|---|---|
| CZT HV Monitor | 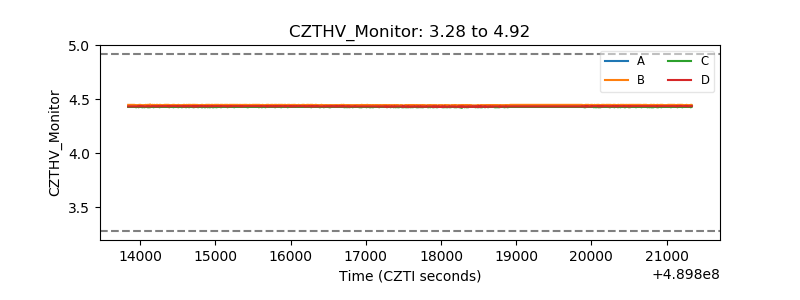 |
| D_VDD | 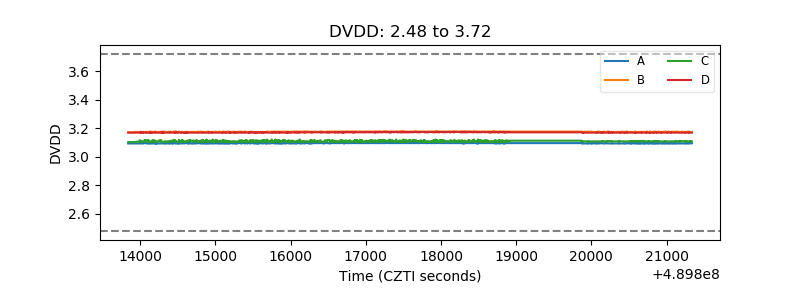 |
| Temperature 1 | 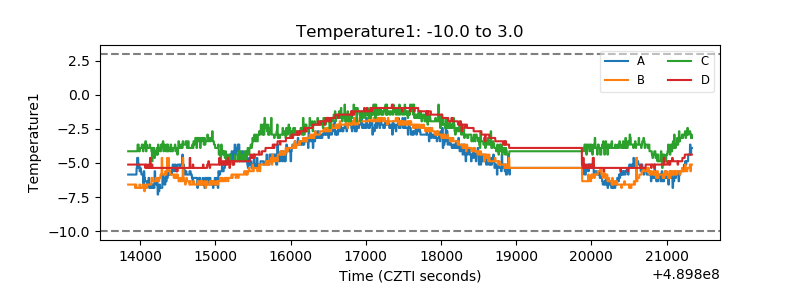 |
| Veto HV Monitor | 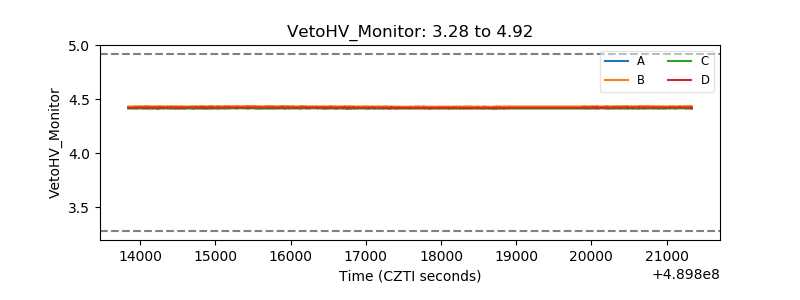 |
| Veto LLD | 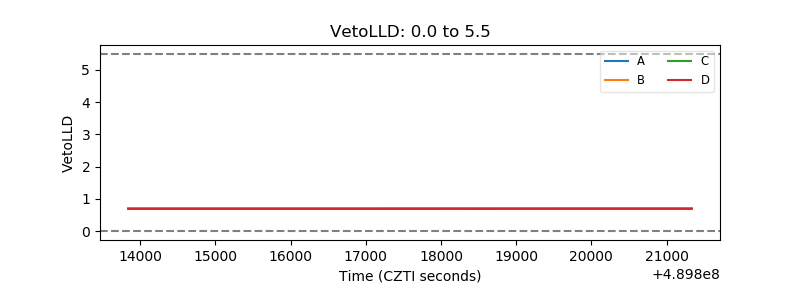 |
| Alpha Counter | 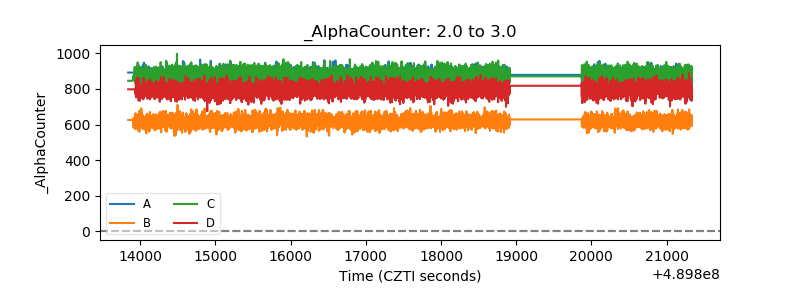 |
| _CPM_Rate | 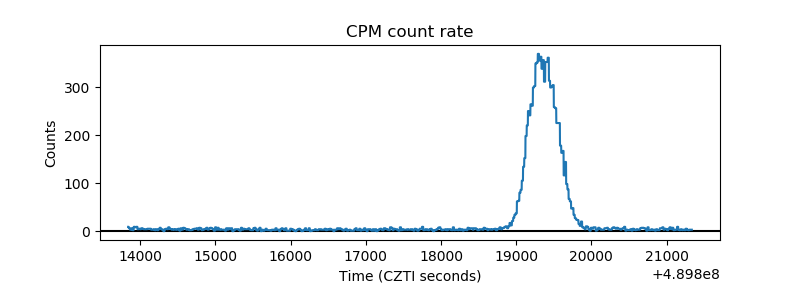 |
| CZT Counter | 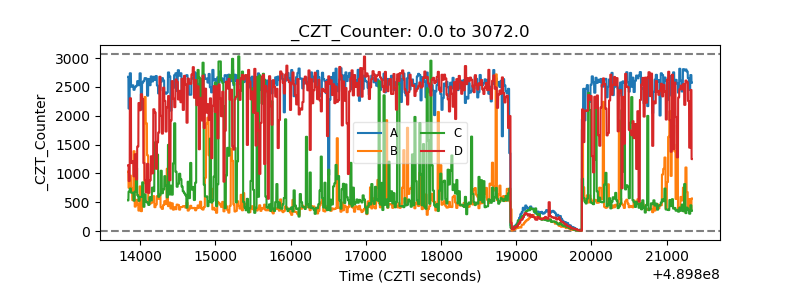 |
| +2.5 Volts monitor |  |
| +5 Volts monitor | 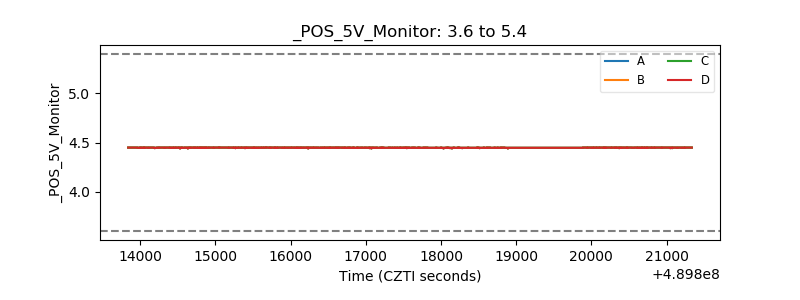 |
| _ROLL_ROT | 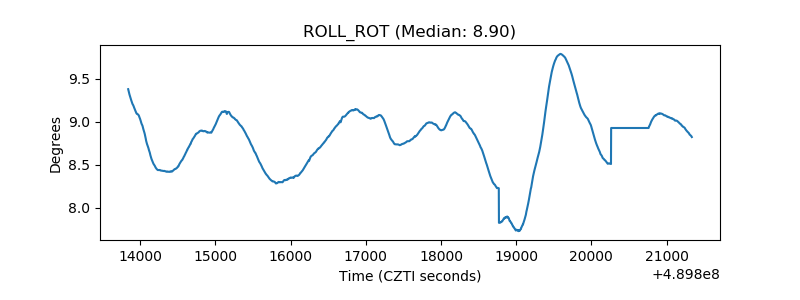 |
| _Roll_DEC | 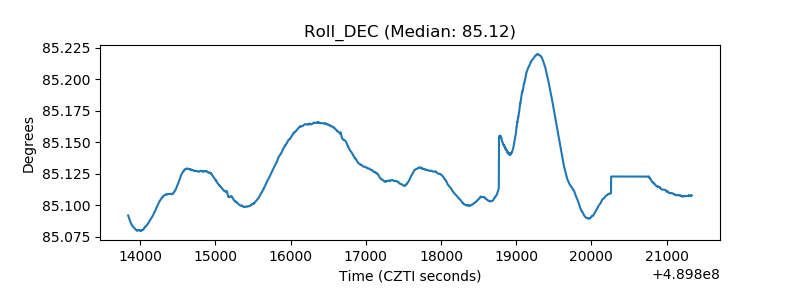 |
| _Roll_RA | 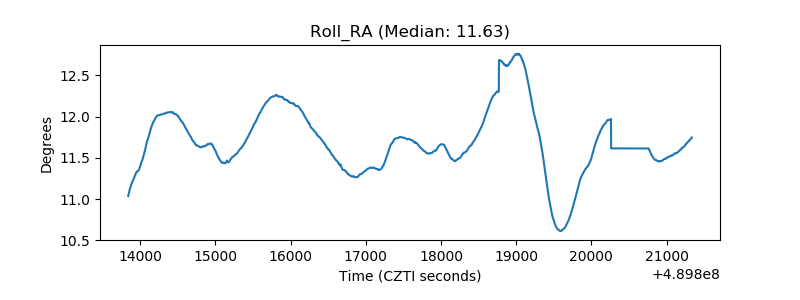 |
| Veto Counter | 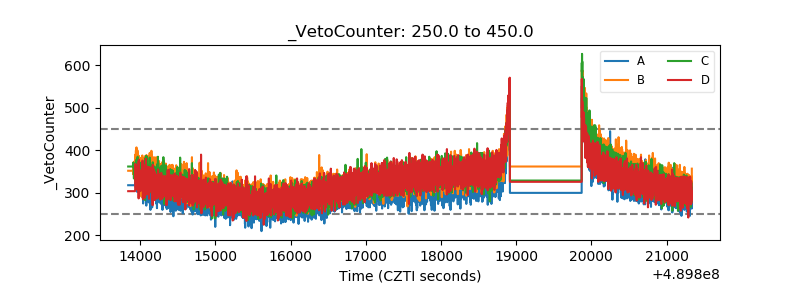 |