| Param | Original file | Final file |
|---|---|---|
| Filename | modeM0/AS1C09_011T06_9000006484_52916cztM0_level2.fits | modeM0/AS1C09_011T06_9000006484_52916cztM0_level2_quad_clean.evt |
| Size (bytes) | 918,990,720 | 54,901,440 |
| Size | 876.4 MB | 52.4 MB |
| Events in quadrant A | 14,239,791 | 20,063 |
| Events in quadrant B | 3,740,325 | 551,887 |
| Events in quadrant C | 3,424,788 | 503,831 |
| Events in quadrant D | 12,176,619 | 191,680 |
| Mode M9 | |||
|---|---|---|---|
| Quadrant | BADHDUFLAG | Total packets | Discarded packets |
| A | 0 | 10 | 0 |
| B | 0 | 10 | 0 |
| C | 0 | 10 | 0 |
| D | 0 | 10 | 0 |
| Mode M0 | |||
|---|---|---|---|
| Quadrant | BADHDUFLAG | Total packets | Discarded packets |
| A | 0 | 46680 | 424 |
| B | 0 | 15161 | 59 |
| C | 0 | 14563 | 84 |
| D | 0 | 40401 | 402 |
| Mode SS | |||
|---|---|---|---|
| Quadrant | BADHDUFLAG | Total packets | Discarded packets |
| A | 0 | 116 | 0 |
| B | 0 | 116 | 2 |
| C | 0 | 116 | 2 |
| D | 0 | 116 | 2 |
| Quadrant | Total seconds | Saturated seconds | Saturation percentage |
|---|---|---|---|
| A | 5635 | 5476 | 97.178350% |
| B | 5659 | 372 | 6.573600% |
| C | 5648 | 156 | 2.762040% |
| D | 5633 | 3739 | 66.376709% |
Noise dominated data is calculated using 1-second bins in cleaned event files. If a bin has >2000 counts, and if more than 50% of those come from <1% of pixels, then it is considered to be noise-dominated and hence unusable.
| Quadrant | # 1 sec bins | Bins with >0 counts | Bins with >2000 counts | High rate bins dominated by noise | Noise dominated (total time) | Noise dominated (detector-on time) | Marked lightcurve |
|---|---|---|---|---|---|---|---|
| A | 6680 | 5650 | 4993 | 4993 | 74.75% | 88.37% | 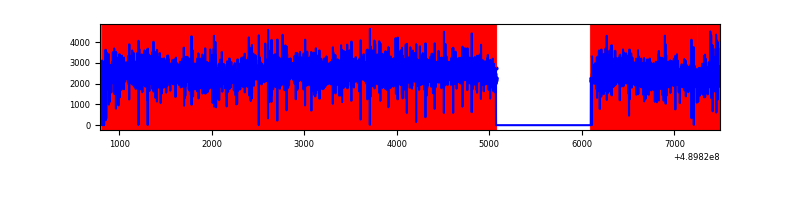 |
| B | 6698 | 5670 | 251 | 251 | 3.75% | 4.43% | 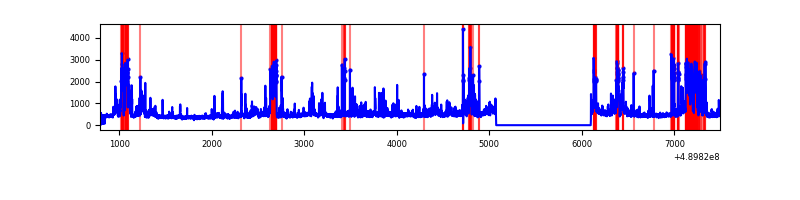 |
| C | 6694 | 5659 | 82 | 82 | 1.22% | 1.45% | 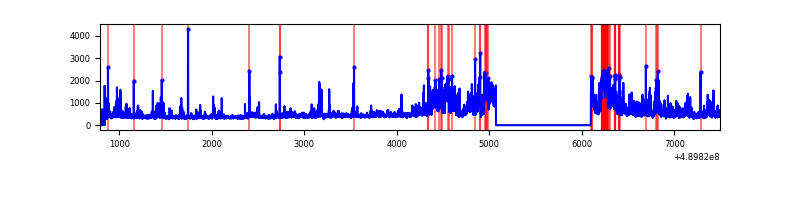 |
| D | 6683 | 5648 | 3733 | 3733 | 55.86% | 66.09% | 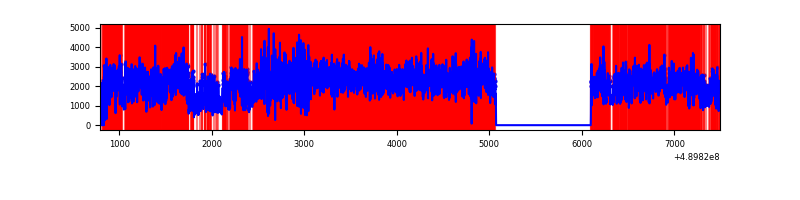 |
Top three noisy pixels from each quadrant. If the there are fewer than three noisy pixels in the level2.evt file, extra rows are filled as -1
| Pixel properties | Quadrant properties | ||||||
|---|---|---|---|---|---|---|---|
| Quadrant | DetID | PixID | Counts | Sigma | Mean | Median | Sigma |
| A | 9 | 191 | 13083282 | 231750.92 | 219 | 214 | 56.5 |
| A | 12 | 17 | 78355 | 1384.17 | 219 | 214 | 56.5 |
| A | 12 | 115 | 67689 | 1195.24 | 219 | 214 | 56.5 |
| B | 1 | 255 | 845923 | 6839.72 | 574 | 553 | 123.6 |
| B | 12 | 32 | 173743 | 1401.25 | 574 | 553 | 123.6 |
| B | 5 | 185 | 158390 | 1277.03 | 574 | 553 | 123.6 |
| C | 7 | 80 | 672781 | 4359.46 | 563 | 559 | 154.2 |
| C | 1 | 45 | 133553 | 862.49 | 563 | 559 | 154.2 |
| C | 12 | 254 | 73398 | 472.37 | 563 | 559 | 154.2 |
| D | 15 | 78 | 7908886 | 65859.47 | 416 | 397 | 120.1 |
| D | 8 | 176 | 1732570 | 14425.01 | 416 | 397 | 120.1 |
| D | 15 | 125 | 281178 | 2338.26 | 416 | 397 | 120.1 |
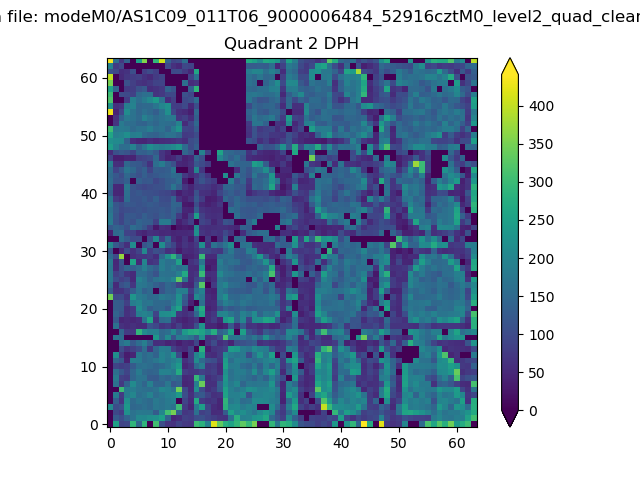
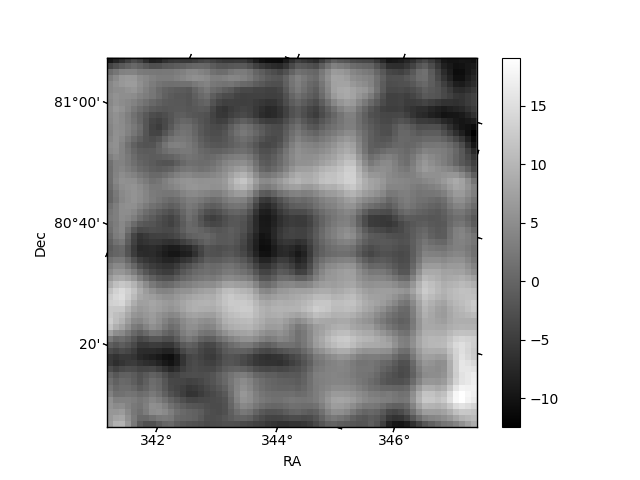
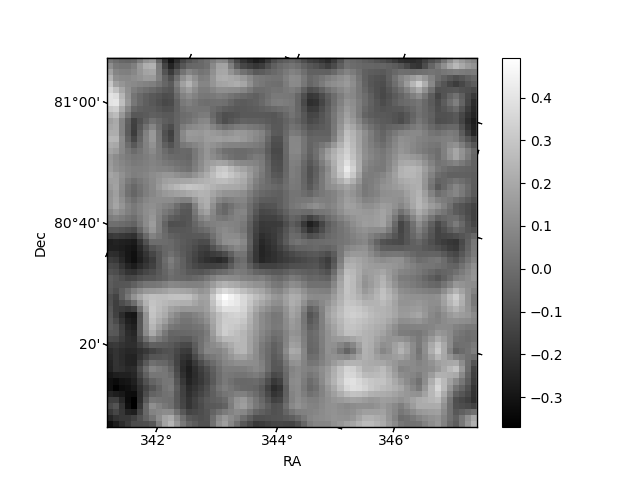
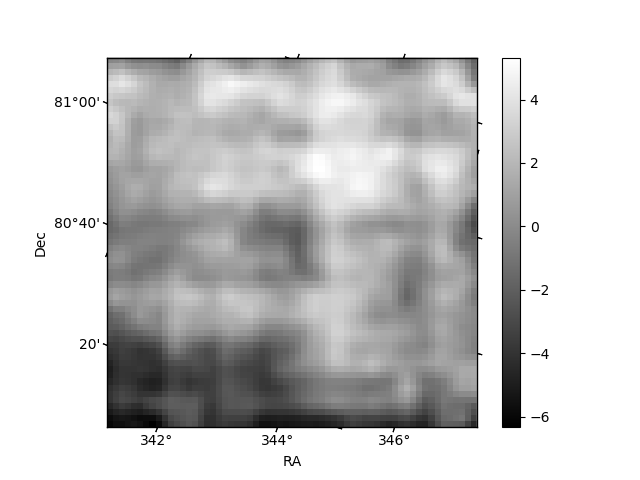
Histogram calculated using DETX and DETY for each event in the final _common_clean file
| Quadrant A | 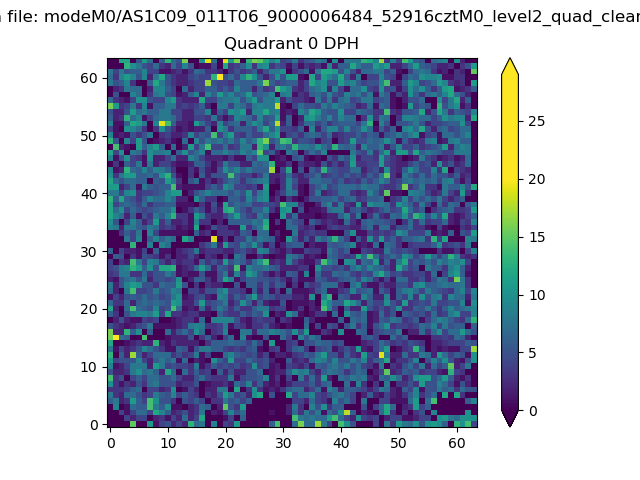 |
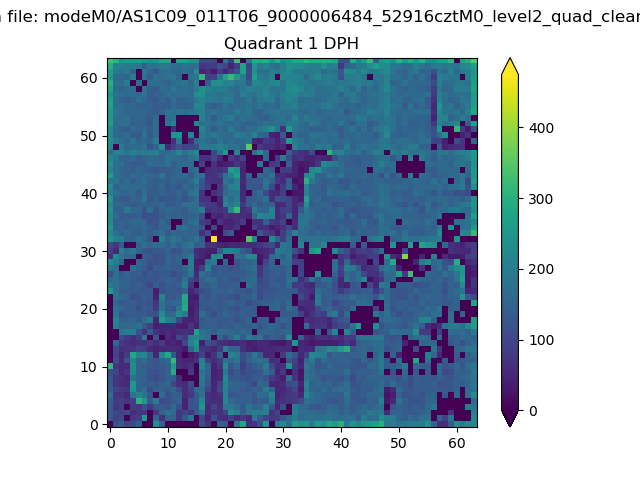 |
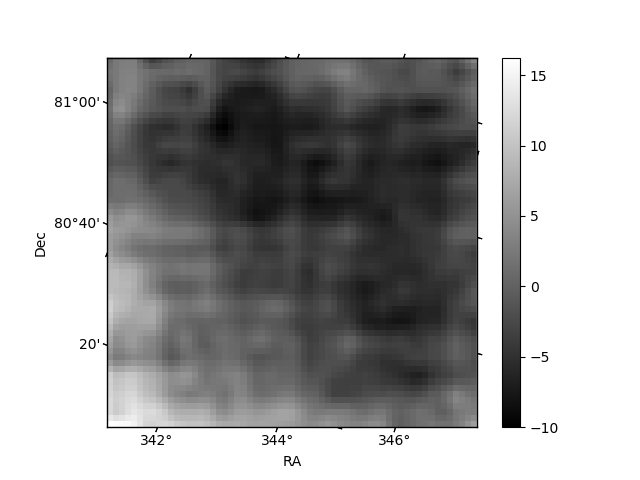
Quadrant B |
|---|---|---|---|
| Quadrant D | 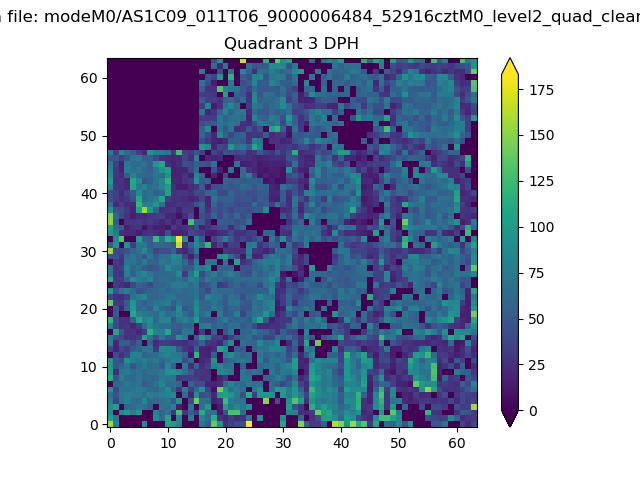 |
 |
Quadrant C |
| Plot type | Count rate plots | Images |
|---|---|---|
| Comparison with Poisson distribution Blue bars denote a histogram of data divided into 1 sec bins. Red curve is a Poisson curve with rate = median count rate of data. |
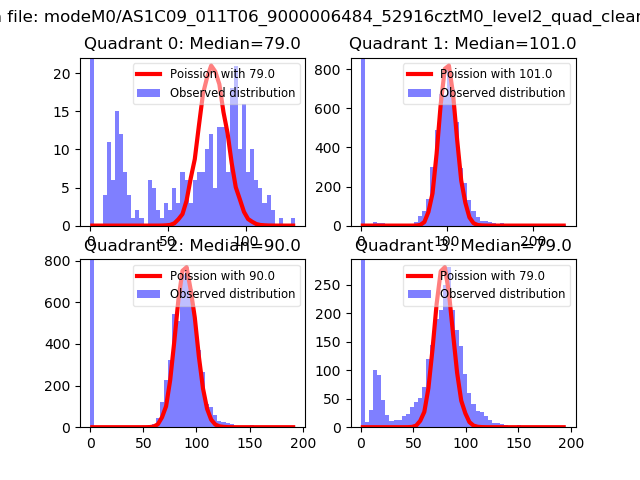 |
 |
| Quadrant-wise count rates Data is divided into 100 sec bins |
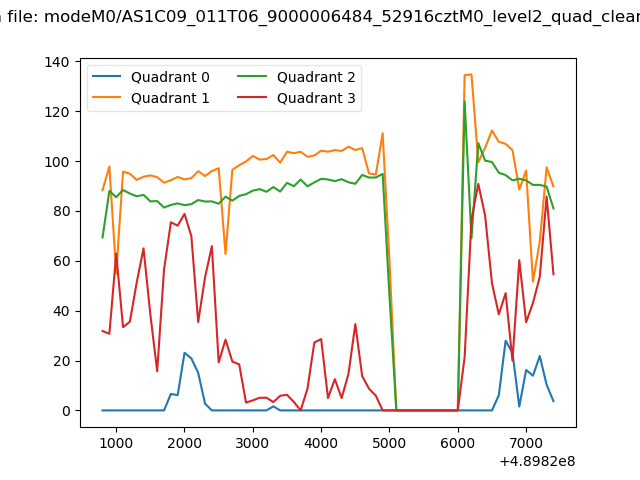 |
|
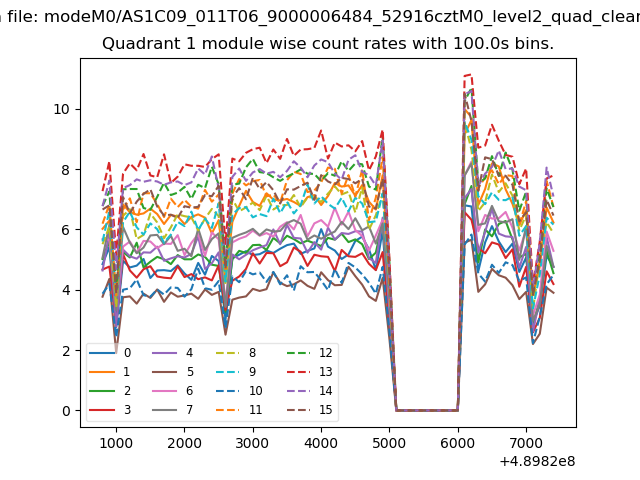
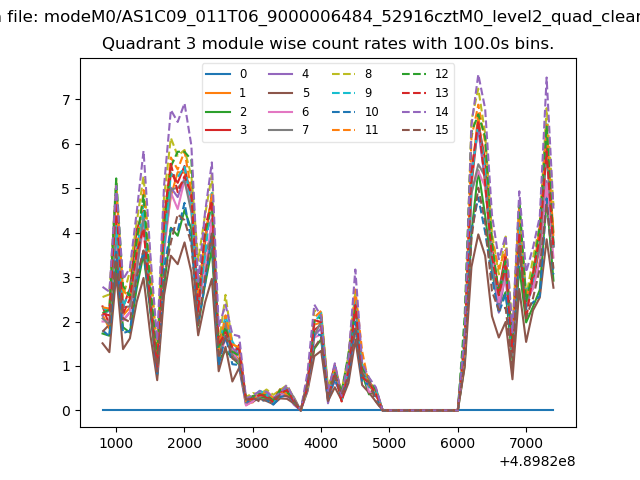
| Module-wise count rates for Quadrant A Data is divided into 100 sec bins |
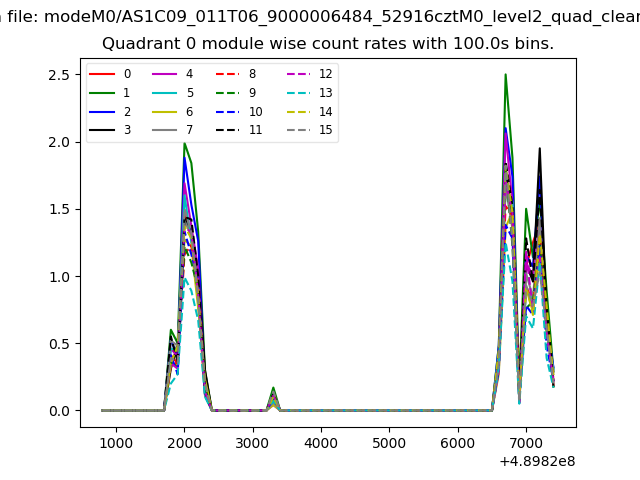 |
 |
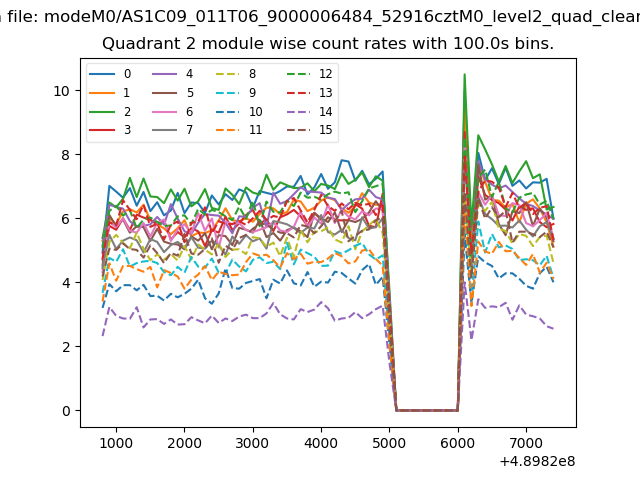
| Module-wise count rates for Quadrant B Data is divided into 100 sec bins |
 |
 |
| Module-wise count rates for Quadrant C Data is divided into 100 sec bins |
 |
 |
| Module-wise count rates for Quadrant D Data is divided into 100 sec bins |
 |
 |
| Parameter | Plot |
|---|---|
| CZT HV Monitor | 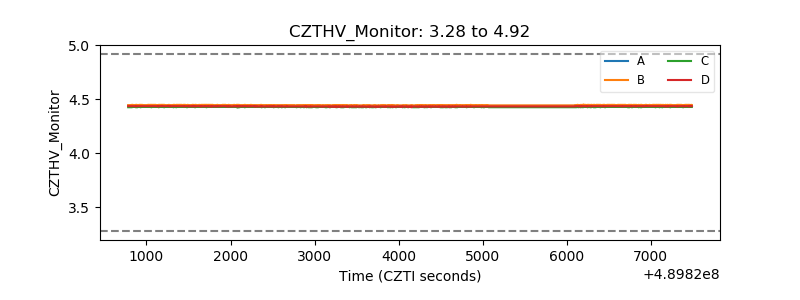 |
| D_VDD | 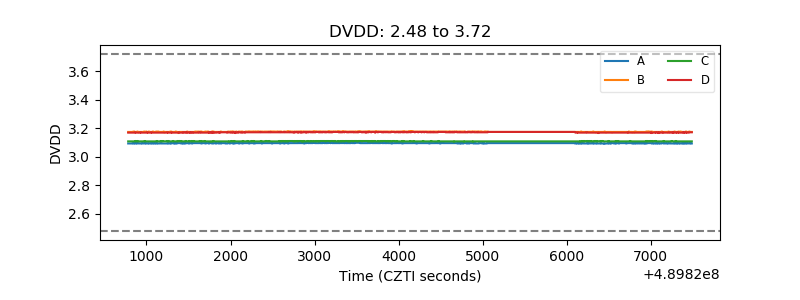 |
| Temperature 1 | 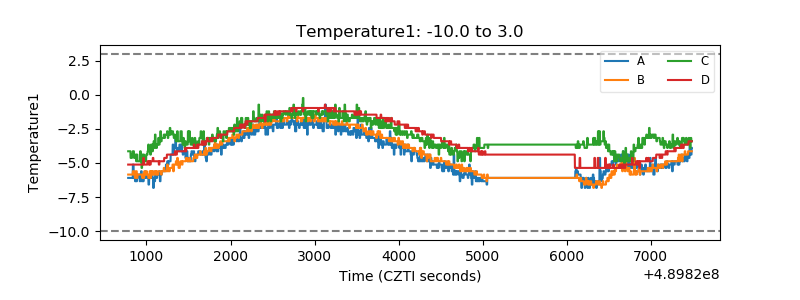 |
| Veto HV Monitor | 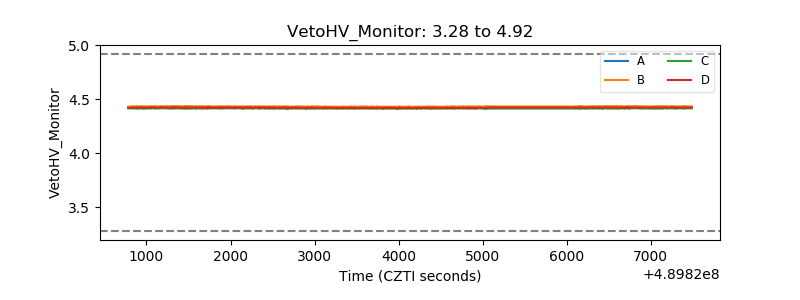 |
| Veto LLD | 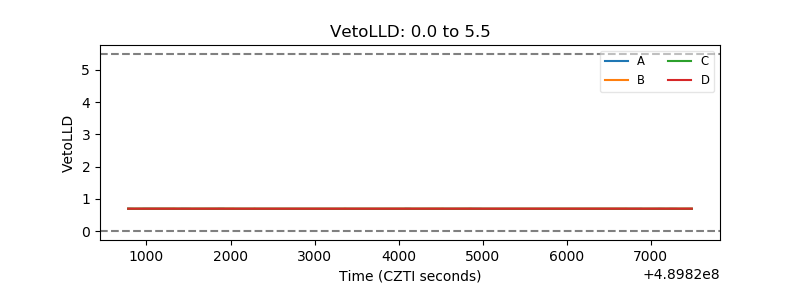 |
| Alpha Counter | 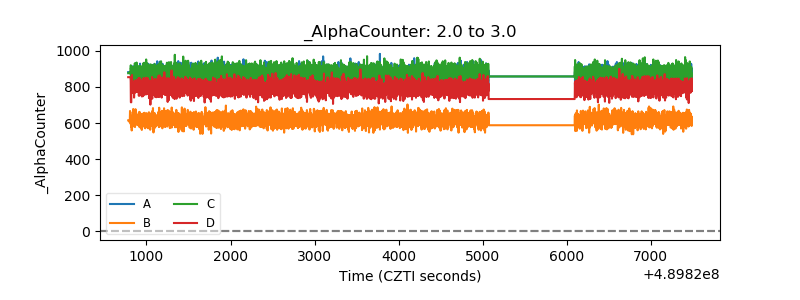 |
| _CPM_Rate | 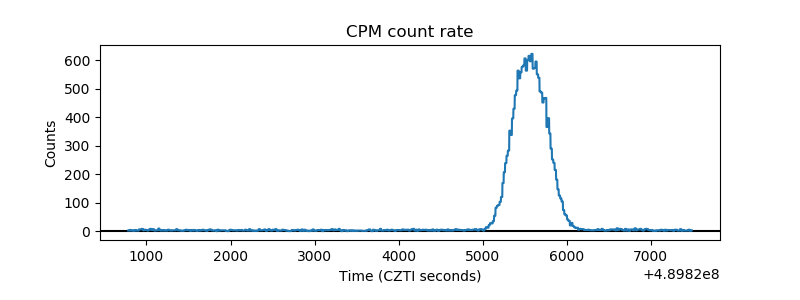 |
| CZT Counter | 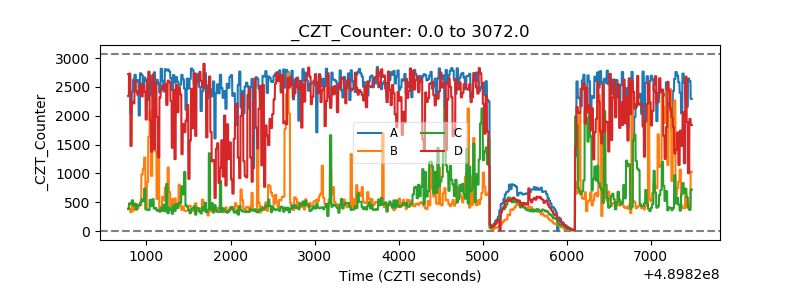 |
| +2.5 Volts monitor |  |
| +5 Volts monitor |  |
| _ROLL_ROT | 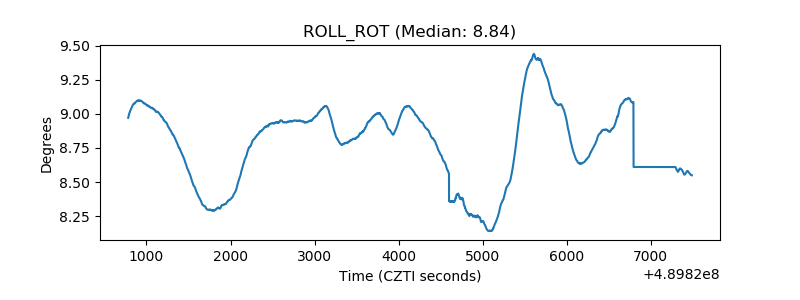 |
| _Roll_DEC | 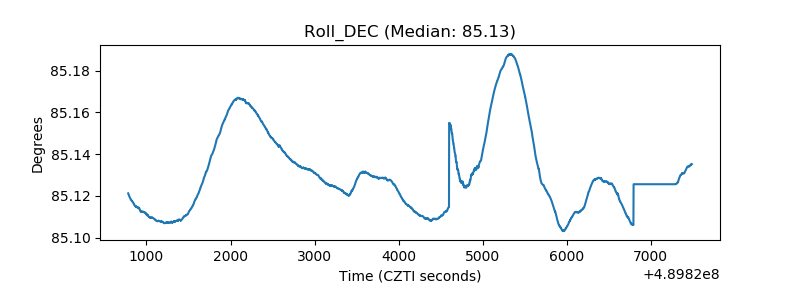 |
| _Roll_RA | 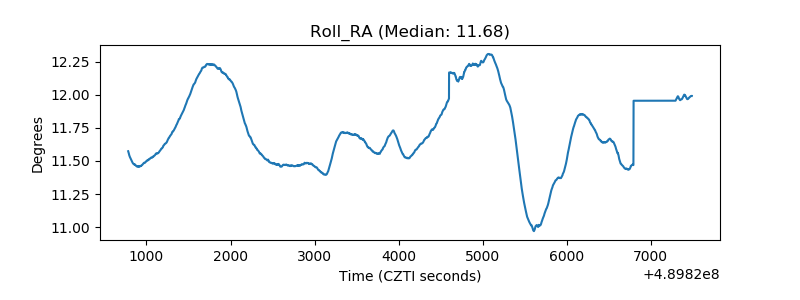 |
| Veto Counter | 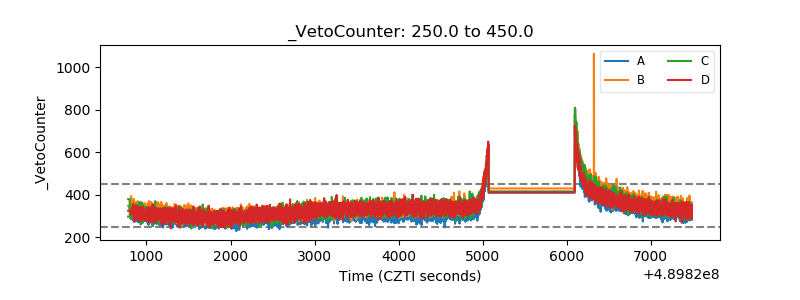 |