| Param | Original file | Final file |
|---|---|---|
| Filename | modeM0/AS1C09_011T06_9000006484_52917cztM0_level2.fits | modeM0/AS1C09_011T06_9000006484_52917cztM0_level2_quad_clean.evt |
| Size (bytes) | 843,056,640 | 59,189,760 |
| Size | 804.0 MB | 56.4 MB |
| Events in quadrant A | 12,859,053 | 82,374 |
| Events in quadrant B | 3,803,970 | 550,985 |
| Events in quadrant C | 3,565,112 | 496,922 |
| Events in quadrant D | 10,556,602 | 279,204 |
| Mode M9 | |||
|---|---|---|---|
| Quadrant | BADHDUFLAG | Total packets | Discarded packets |
| A | 0 | 12 | 0 |
| B | 0 | 12 | 0 |
| C | 0 | 12 | 0 |
| D | 0 | 12 | 0 |
| Mode M0 | |||
|---|---|---|---|
| Quadrant | BADHDUFLAG | Total packets | Discarded packets |
| A | 0 | 42704 | 740 |
| B | 0 | 15569 | 491 |
| C | 0 | 14570 | 151 |
| D | 0 | 35779 | 682 |
| Mode SS | |||
|---|---|---|---|
| Quadrant | BADHDUFLAG | Total packets | Discarded packets |
| A | 0 | 114 | 2 |
| B | 0 | 114 | 4 |
| C | 0 | 114 | 2 |
| D | 0 | 114 | 0 |
| Quadrant | Total seconds | Saturated seconds | Saturation percentage |
|---|---|---|---|
| A | 5452 | 4789 | 87.839325% |
| B | 5460 | 338 | 6.190476% |
| C | 5480 | 180 | 3.284672% |
| D | 5452 | 2684 | 49.229640% |
Noise dominated data is calculated using 1-second bins in cleaned event files. If a bin has >2000 counts, and if more than 50% of those come from <1% of pixels, then it is considered to be noise-dominated and hence unusable.
| Quadrant | # 1 sec bins | Bins with >0 counts | Bins with >2000 counts | High rate bins dominated by noise | Noise dominated (total time) | Noise dominated (detector-on time) | Marked lightcurve |
|---|---|---|---|---|---|---|---|
| A | 6700 | 5468 | 4184 | 4184 | 62.45% | 76.52% | 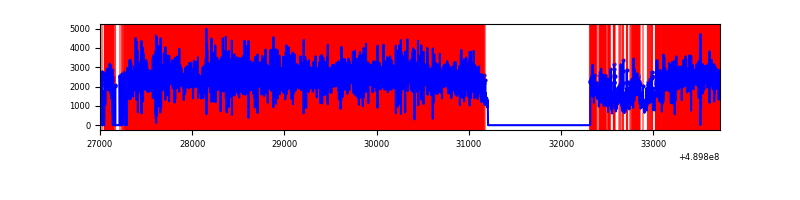 |
| B | 6722 | 5479 | 207 | 207 | 3.08% | 3.78% | 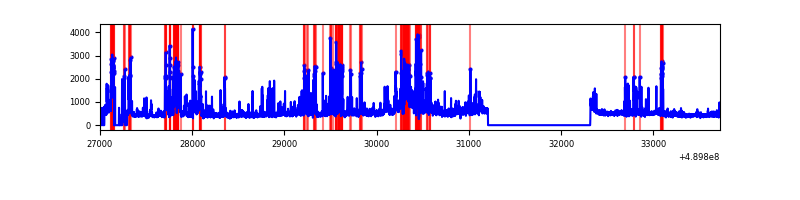 |
| C | 6711 | 5501 | 159 | 159 | 2.37% | 2.89% | 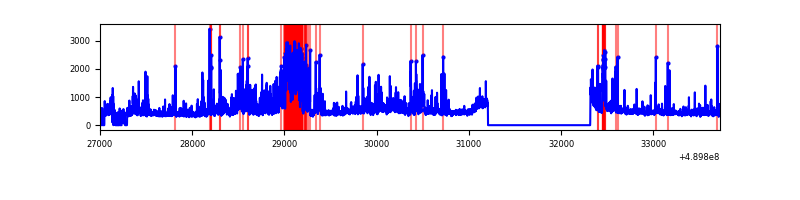 |
| D | 6702 | 5473 | 2671 | 2671 | 39.85% | 48.80% | 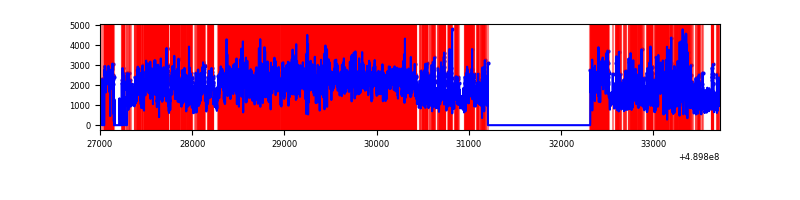 |
Top three noisy pixels from each quadrant. If the there are fewer than three noisy pixels in the level2.evt file, extra rows are filled as -1
| Pixel properties | Quadrant properties | ||||||
|---|---|---|---|---|---|---|---|
| Quadrant | DetID | PixID | Counts | Sigma | Mean | Median | Sigma |
| A | 9 | 191 | 11249376 | 138936.64 | 320 | 312 | 81.0 |
| A | 12 | 17 | 130632 | 1609.58 | 320 | 312 | 81.0 |
| A | 15 | 184 | 39545 | 484.56 | 320 | 312 | 81.0 |
| B | 1 | 255 | 434721 | 3617.65 | 563 | 544 | 120.0 |
| B | 5 | 185 | 360540 | 2999.56 | 563 | 544 | 120.0 |
| B | 5 | 172 | 304601 | 2533.46 | 563 | 544 | 120.0 |
| C | 7 | 80 | 898222 | 5952.44 | 551 | 544 | 150.8 |
| C | 13 | 3 | 106361 | 701.67 | 551 | 544 | 150.8 |
| C | 1 | 45 | 70893 | 466.48 | 551 | 544 | 150.8 |
| D | 15 | 78 | 5071064 | 38047.74 | 462 | 441 | 133.3 |
| D | 8 | 176 | 2121899 | 15918.49 | 462 | 441 | 133.3 |
| D | 10 | 172 | 423701 | 3175.96 | 462 | 441 | 133.3 |
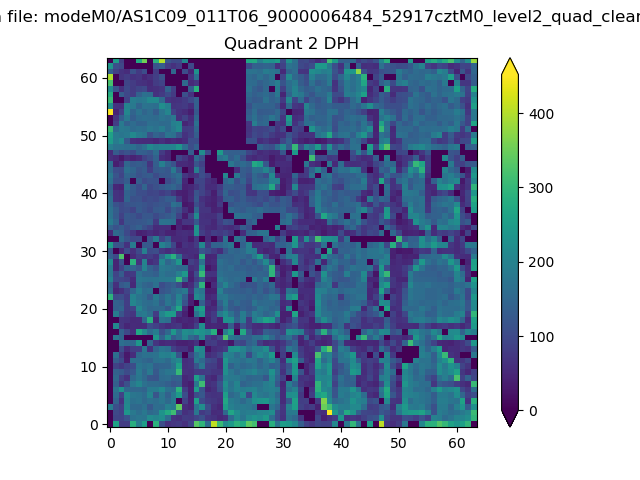
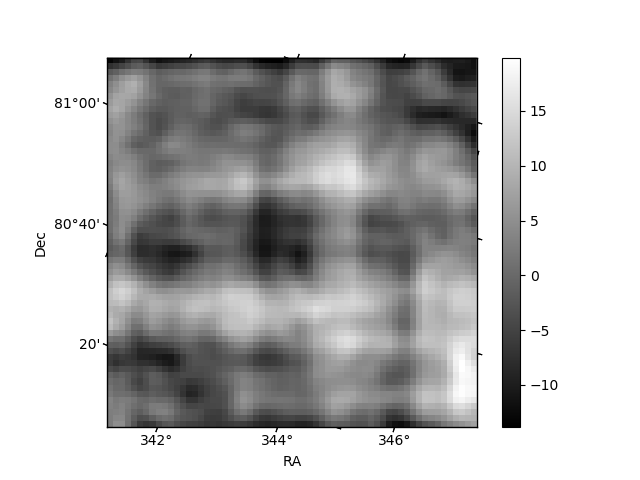
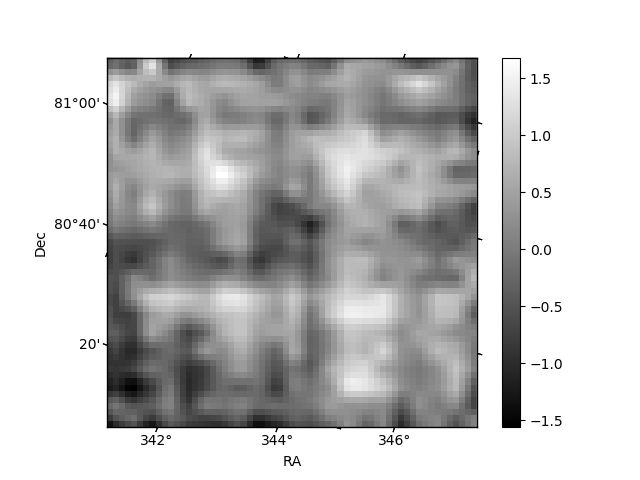
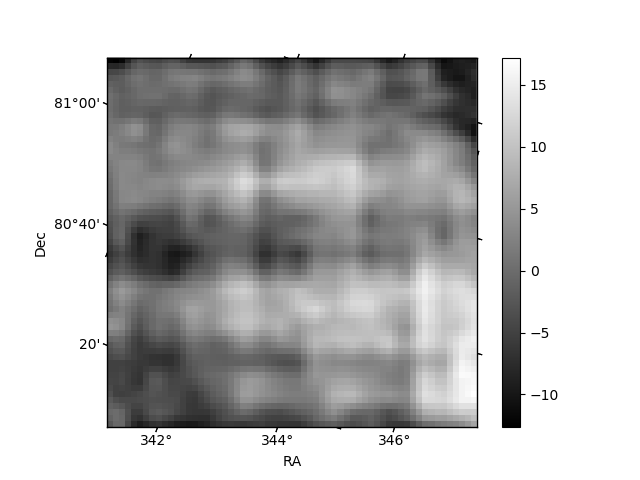
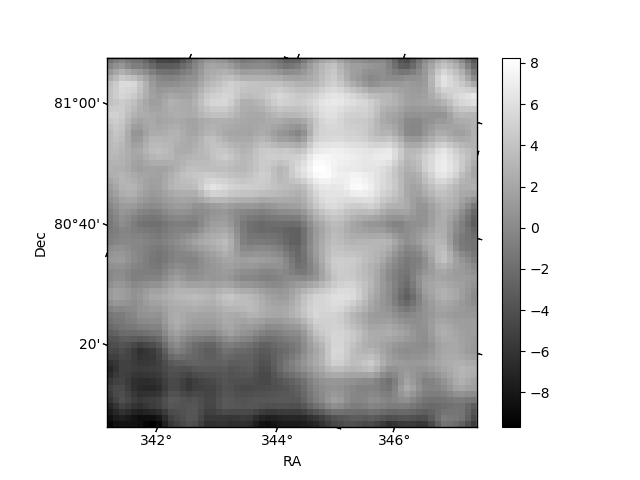
Histogram calculated using DETX and DETY for each event in the final _common_clean file
| Quadrant A | 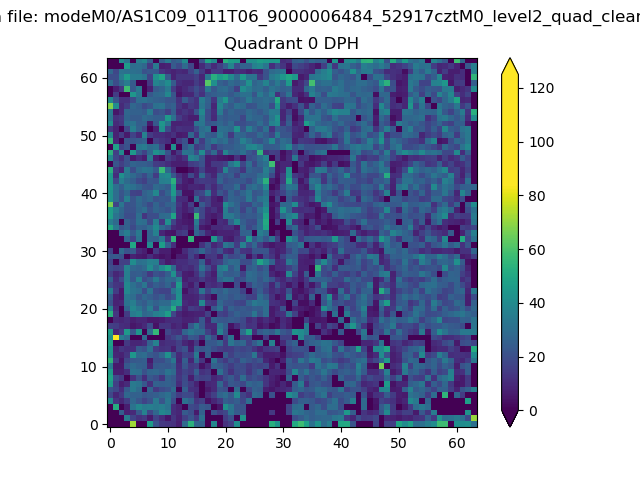 |
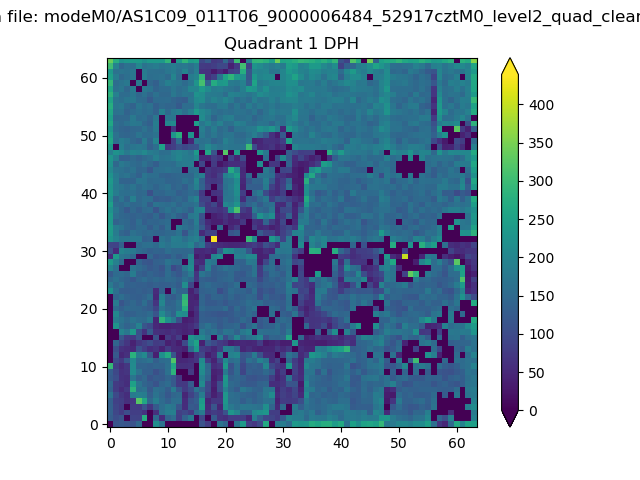 |
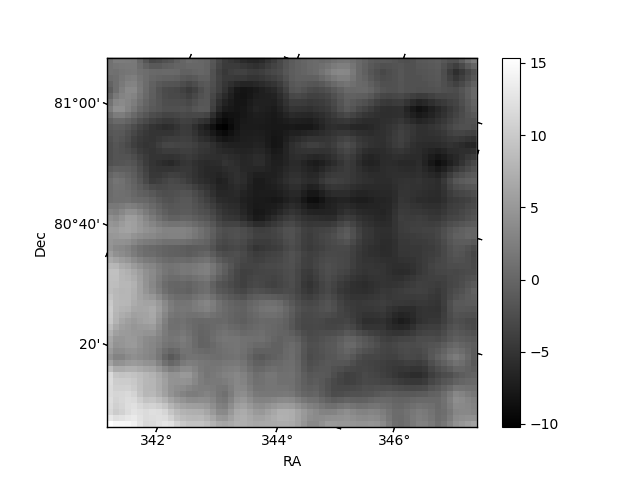
Quadrant B |
|---|---|---|---|
| Quadrant D | 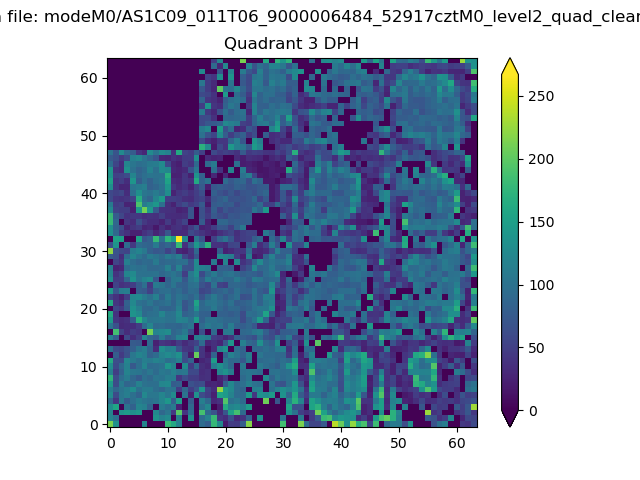 |
 |
Quadrant C |
| Plot type | Count rate plots | Images |
|---|---|---|
| Comparison with Poisson distribution Blue bars denote a histogram of data divided into 1 sec bins. Red curve is a Poisson curve with rate = median count rate of data. |
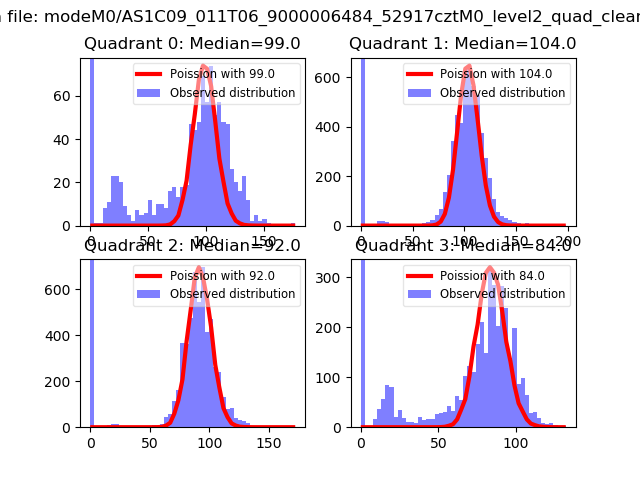 |
 |
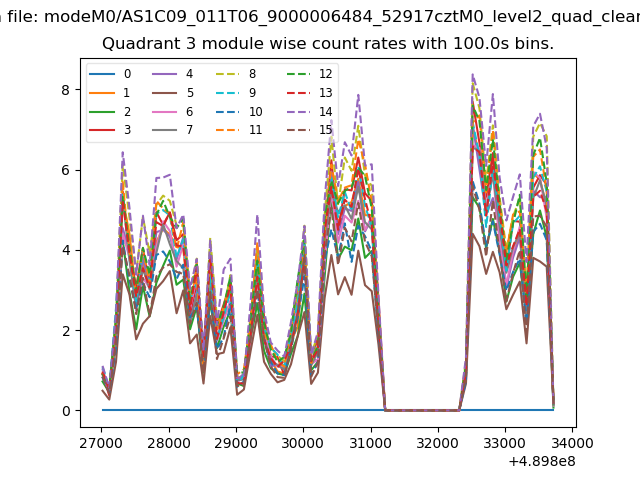
| Quadrant-wise count rates Data is divided into 100 sec bins |
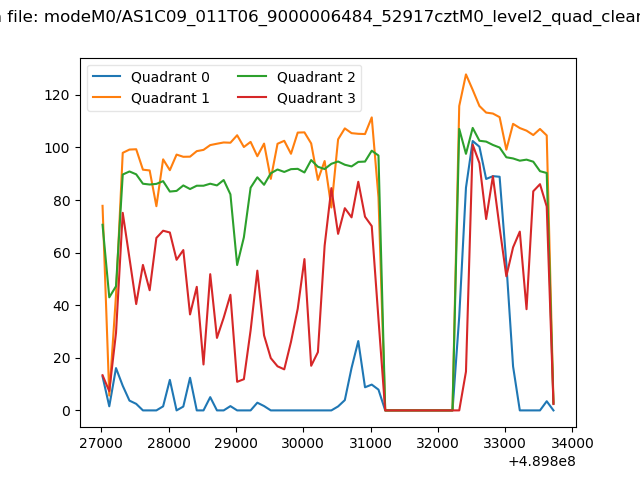 |
|
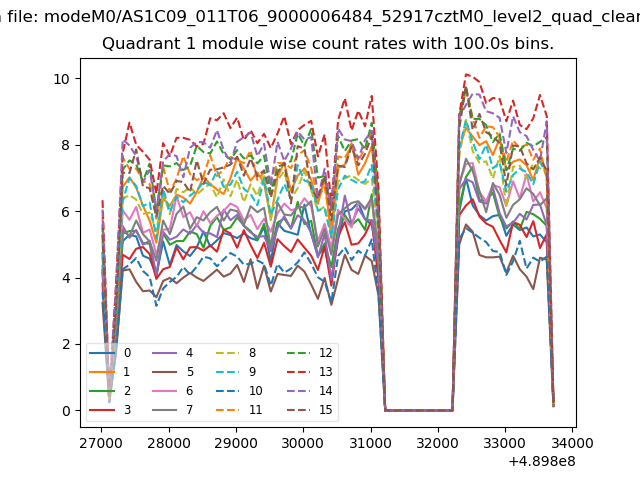
| Module-wise count rates for Quadrant A Data is divided into 100 sec bins |
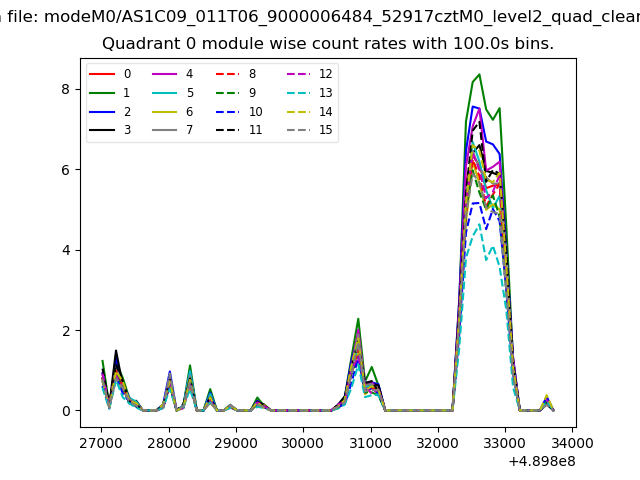 |
 |
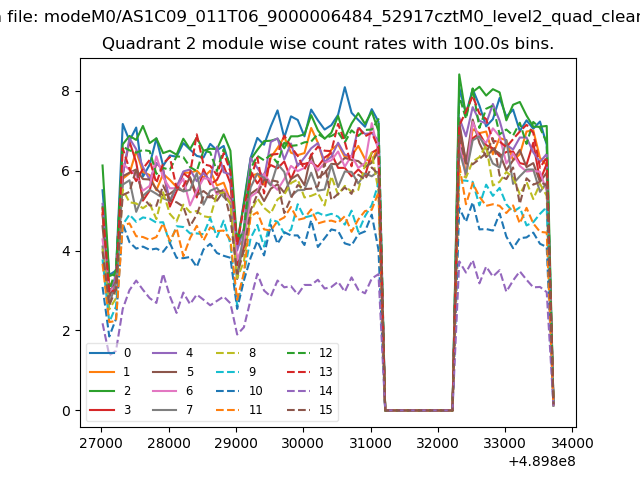
| Module-wise count rates for Quadrant B Data is divided into 100 sec bins |
 |
 |
| Module-wise count rates for Quadrant C Data is divided into 100 sec bins |
 |
 |
| Module-wise count rates for Quadrant D Data is divided into 100 sec bins |
 |
 |
| Parameter | Plot |
|---|---|
| CZT HV Monitor |  |
| D_VDD | 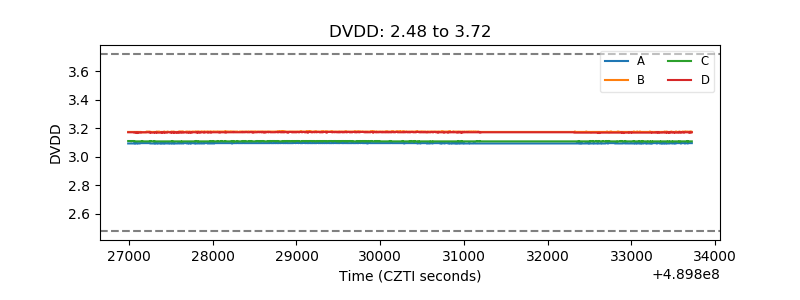 |
| Temperature 1 | 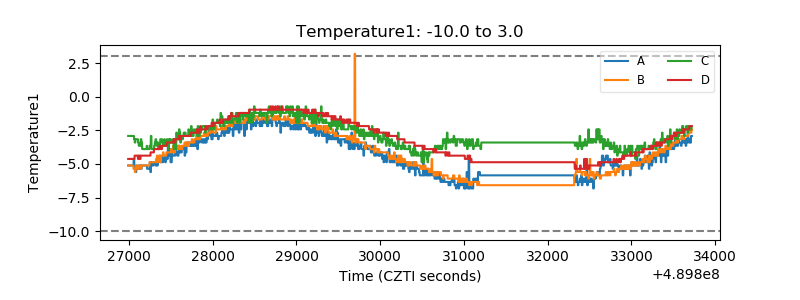 |
| Veto HV Monitor | 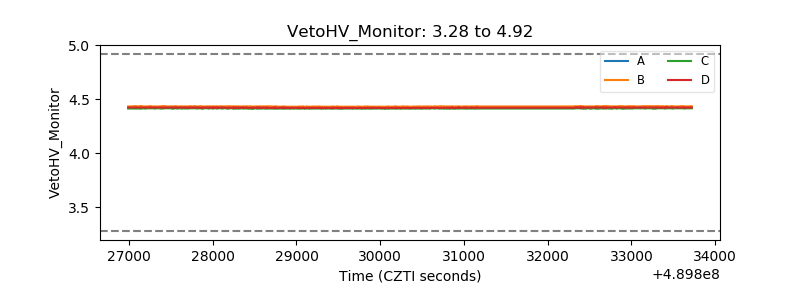 |
| Veto LLD | 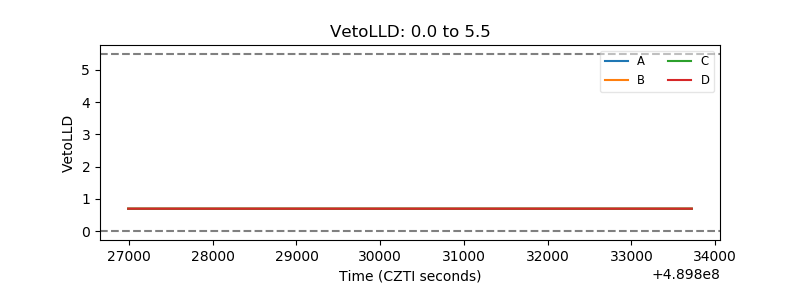 |
| Alpha Counter | 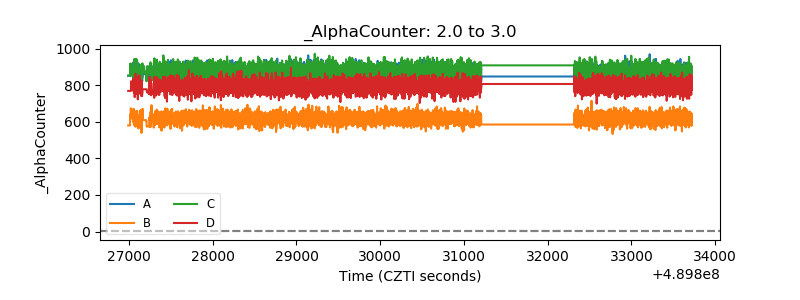 |
| _CPM_Rate | 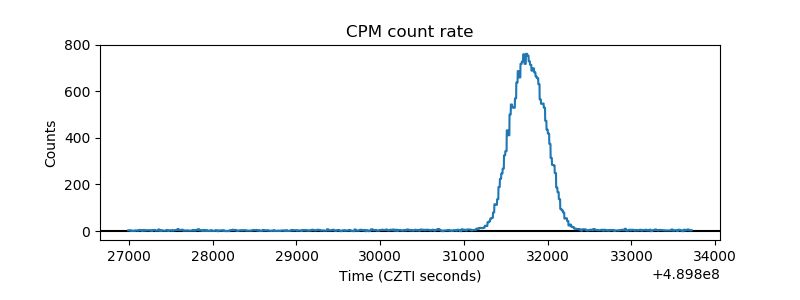 |
| CZT Counter | 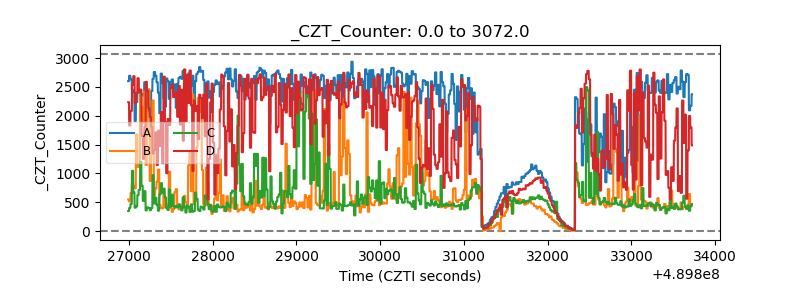 |
| +2.5 Volts monitor | 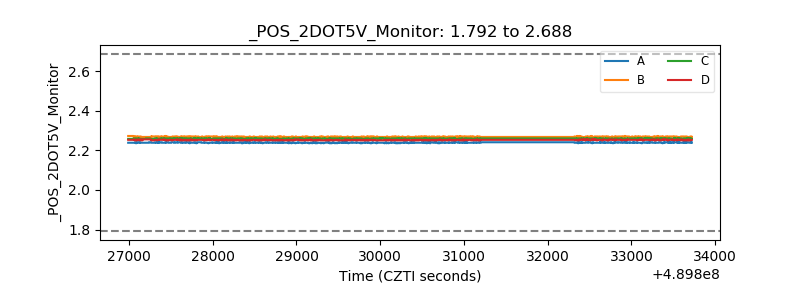 |
| +5 Volts monitor | 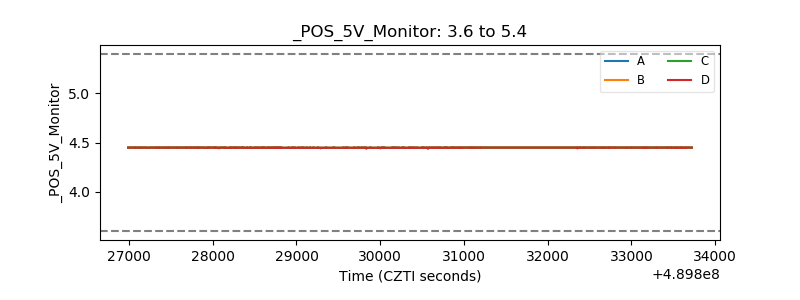 |
| _ROLL_ROT | 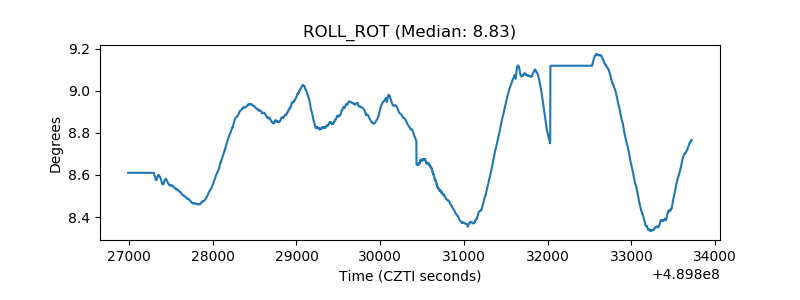 |
| _Roll_DEC | 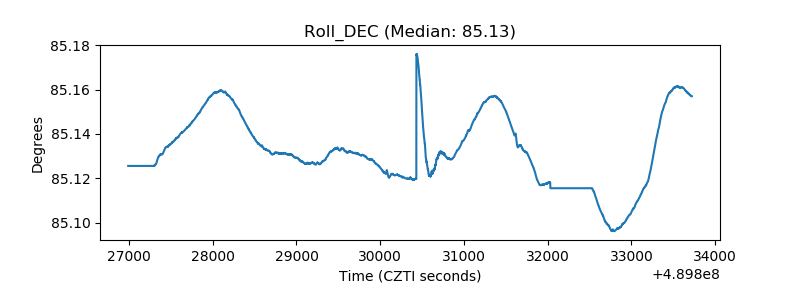 |
| _Roll_RA | 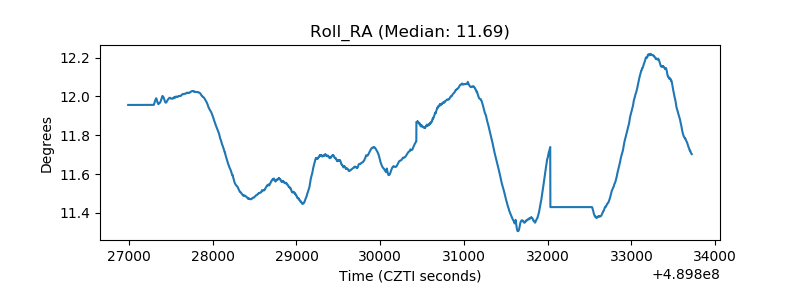 |
| Veto Counter | 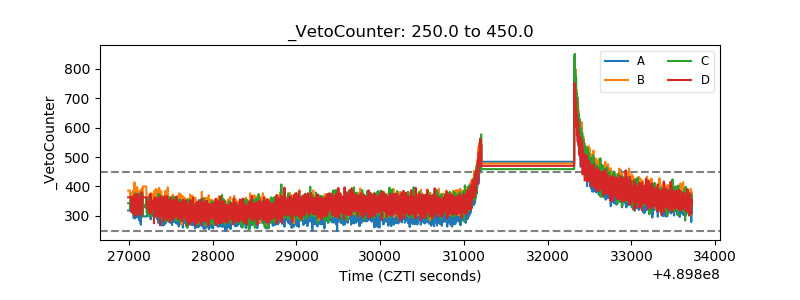 |