| Param | Original file | Final file |
|---|---|---|
| Filename | modeM0/AS1C09_011T06_9000006484_52919cztM0_level2.fits | modeM0/AS1C09_011T06_9000006484_52919cztM0_level2_quad_clean.evt |
| Size (bytes) | 893,445,120 | 63,400,320 |
| Size | 852.1 MB | 60.5 MB |
| Events in quadrant A | 14,749,636 | 9,228 |
| Events in quadrant B | 3,585,542 | 611,734 |
| Events in quadrant C | 5,680,698 | 481,868 |
| Events in quadrant D | 8,603,138 | 406,876 |
| Mode M9 | |||
|---|---|---|---|
| Quadrant | BADHDUFLAG | Total packets | Discarded packets |
| A | 0 | 11 | 0 |
| B | 0 | 11 | 0 |
| C | 0 | 11 | 0 |
| D | 0 | 11 | 0 |
| Mode M0 | |||
|---|---|---|---|
| Quadrant | BADHDUFLAG | Total packets | Discarded packets |
| A | 0 | 47891 | 7 |
| B | 0 | 14656 | 1 |
| C | 0 | 20952 | 1 |
| D | 0 | 29657 | 2 |
| Mode SS | |||
|---|---|---|---|
| Quadrant | BADHDUFLAG | Total packets | Discarded packets |
| A | 0 | 120 | 0 |
| B | 0 | 120 | 0 |
| C | 0 | 120 | 0 |
| D | 0 | 120 | 0 |
| Quadrant | Total seconds | Saturated seconds | Saturation percentage |
|---|---|---|---|
| A | 5860 | 5799 | 98.959044% |
| B | 5861 | 161 | 2.746972% |
| C | 5861 | 822 | 14.024910% |
| D | 5860 | 1595 | 27.218430% |
Noise dominated data is calculated using 1-second bins in cleaned event files. If a bin has >2000 counts, and if more than 50% of those come from <1% of pixels, then it is considered to be noise-dominated and hence unusable.
| Quadrant | # 1 sec bins | Bins with >0 counts | Bins with >2000 counts | High rate bins dominated by noise | Noise dominated (total time) | Noise dominated (detector-on time) | Marked lightcurve |
|---|---|---|---|---|---|---|---|
| A | 6981 | 5862 | 5199 | 5199 | 74.47% | 88.69% | 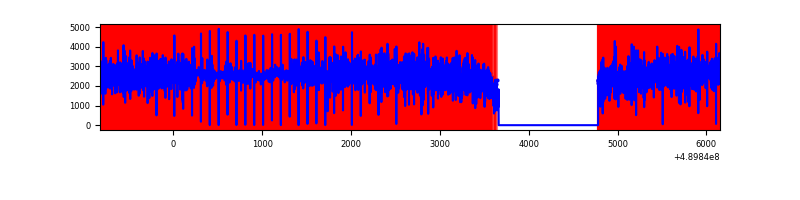 |
| B | 6981 | 5862 | 25 | 25 | 0.36% | 0.43% | 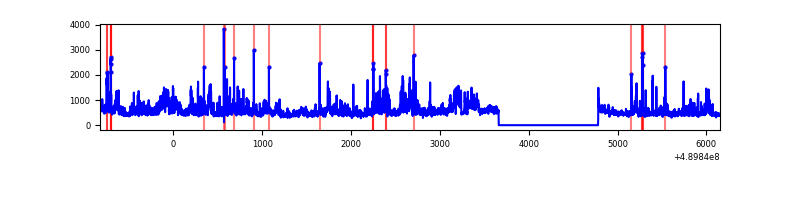 |
| C | 6981 | 5862 | 739 | 739 | 10.59% | 12.61% | 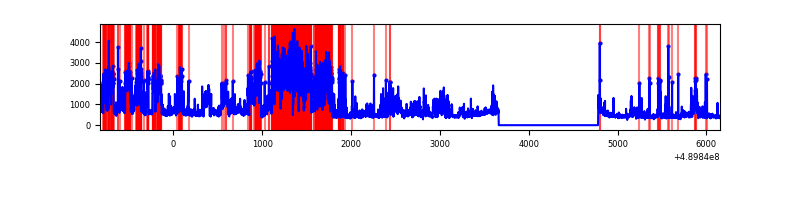 |
| D | 6980 | 5861 | 1432 | 1432 | 20.52% | 24.43% | 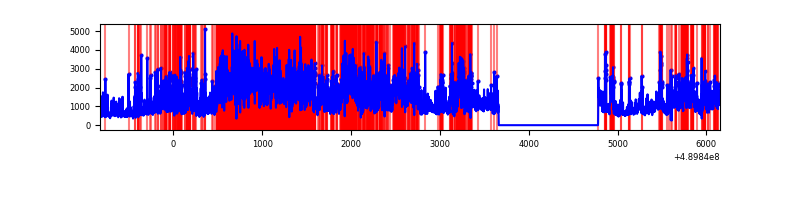 |
Top three noisy pixels from each quadrant. If the there are fewer than three noisy pixels in the level2.evt file, extra rows are filled as -1
| Pixel properties | Quadrant properties | ||||||
|---|---|---|---|---|---|---|---|
| Quadrant | DetID | PixID | Counts | Sigma | Mean | Median | Sigma |
| A | 9 | 191 | 13398824 | 228703.26 | 227 | 221 | 58.6 |
| A | 3 | 78 | 246497 | 4203.73 | 227 | 221 | 58.6 |
| A | 0 | 8 | 47848 | 812.95 | 227 | 221 | 58.6 |
| B | 10 | 254 | 681920 | 5212.52 | 616 | 594 | 130.7 |
| B | 4 | 81 | 89035 | 676.62 | 616 | 594 | 130.7 |
| B | 12 | 32 | 70968 | 538.4 | 616 | 594 | 130.7 |
| C | 7 | 80 | 2626773 | 16859.33 | 574 | 569 | 155.8 |
| C | 2 | 239 | 125573 | 802.48 | 574 | 569 | 155.8 |
| C | 1 | 45 | 113447 | 724.64 | 574 | 569 | 155.8 |
| D | 8 | 176 | 1698039 | 10827.33 | 549 | 522 | 156.8 |
| D | 15 | 78 | 1555026 | 9915.15 | 549 | 522 | 156.8 |
| D | 15 | 125 | 1024370 | 6530.45 | 549 | 522 | 156.8 |
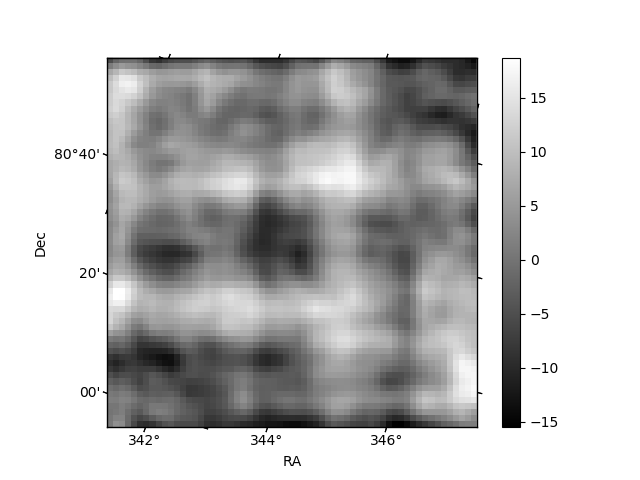
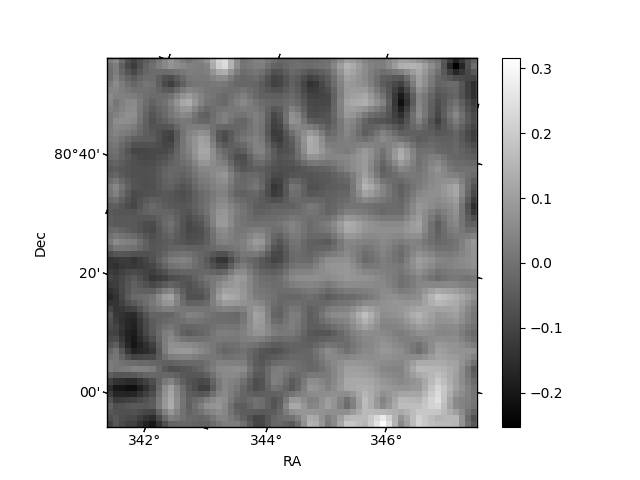
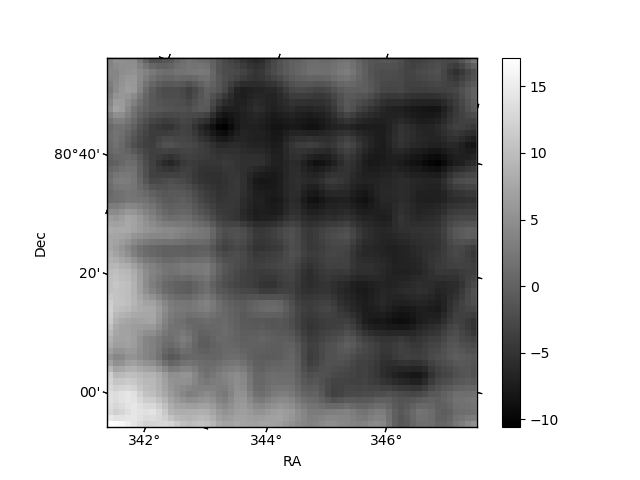
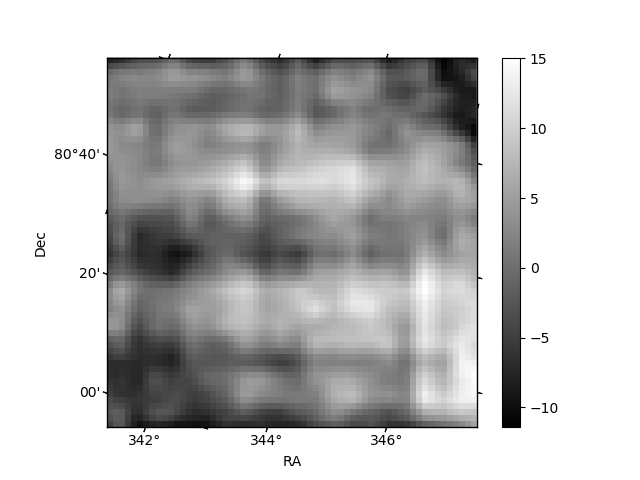
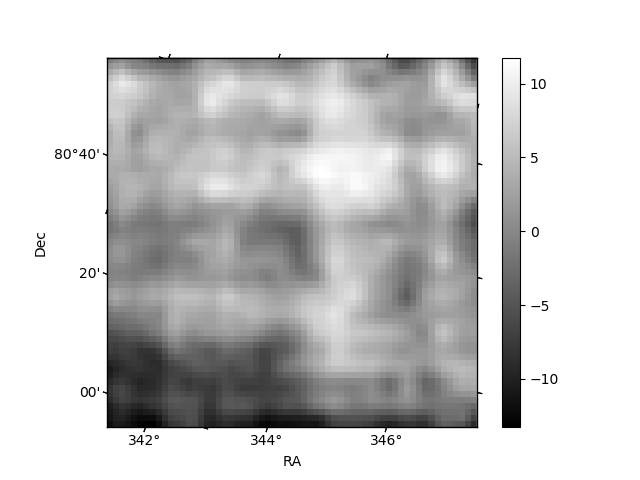
Histogram calculated using DETX and DETY for each event in the final _common_clean file
| Quadrant A | 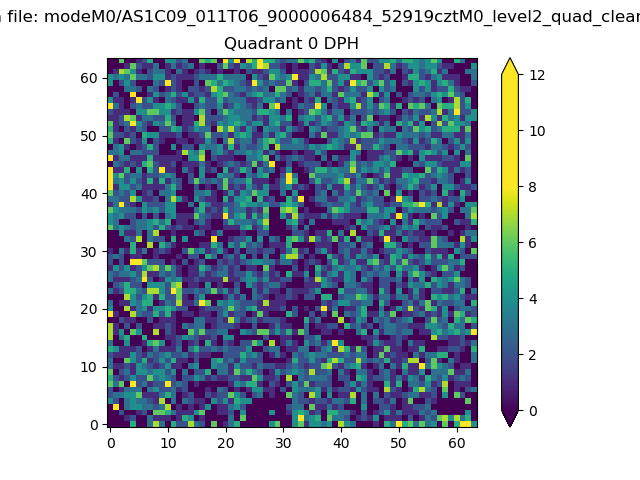 |
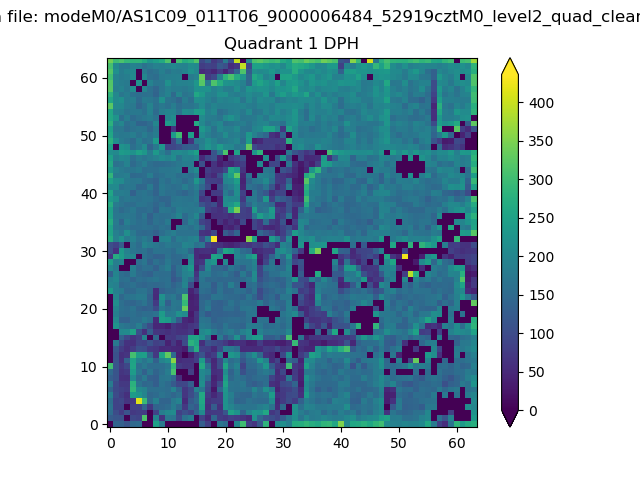 |
Quadrant B |
|---|---|---|---|
| Quadrant D | 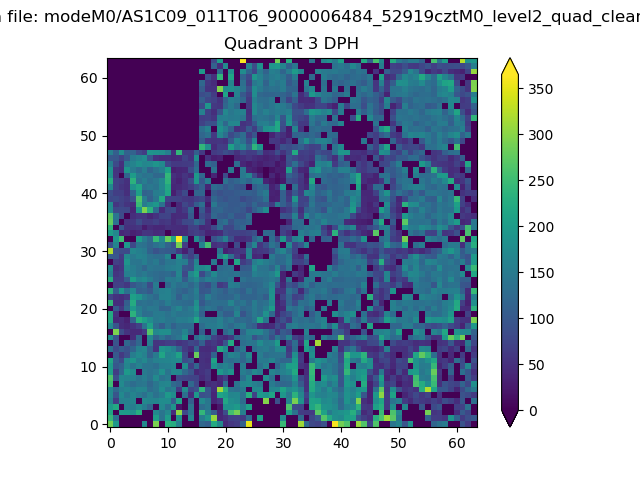 |
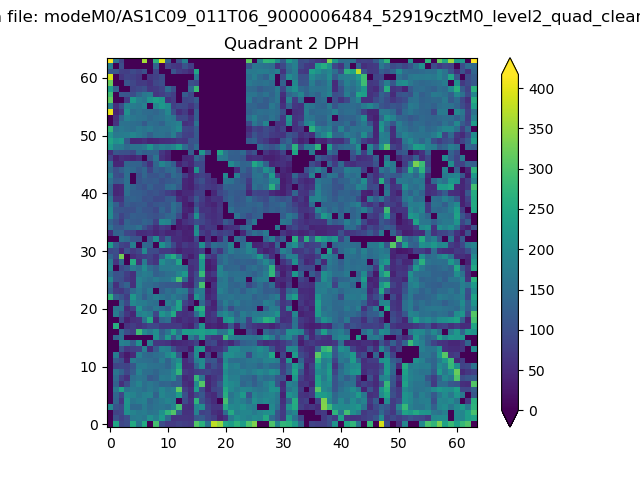 |
Quadrant C |
| Plot type | Count rate plots | Images |
|---|---|---|
| Comparison with Poisson distribution Blue bars denote a histogram of data divided into 1 sec bins. Red curve is a Poisson curve with rate = median count rate of data. |
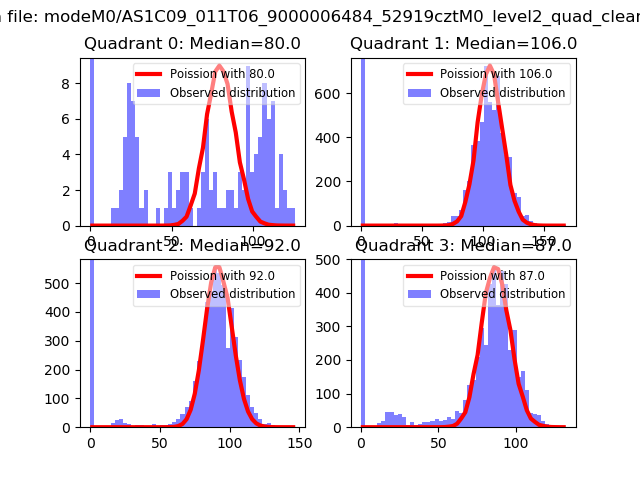 |
 |
| Quadrant-wise count rates Data is divided into 100 sec bins |
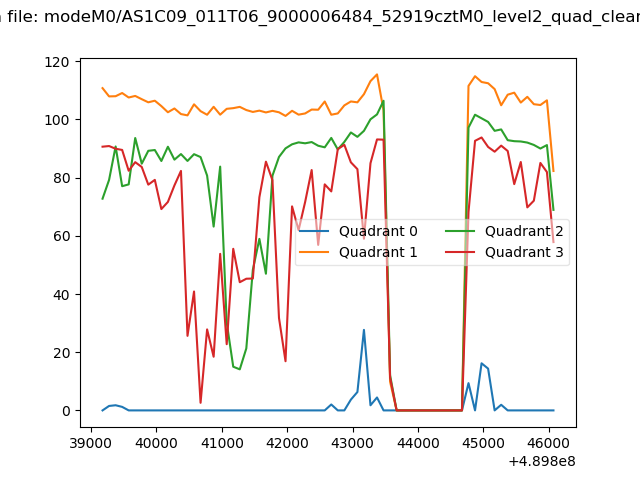 |
|
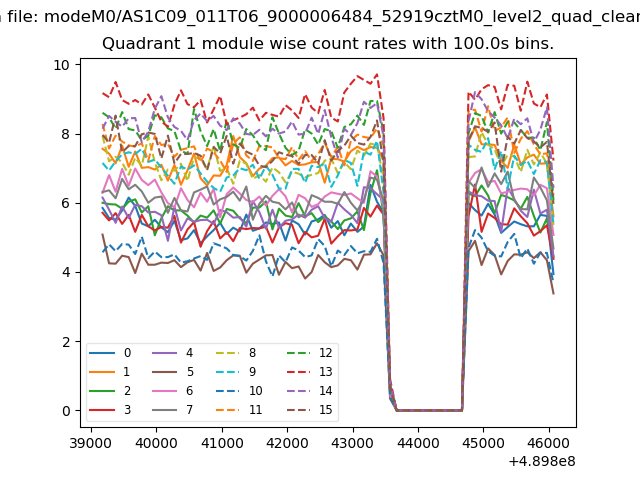
| Module-wise count rates for Quadrant A Data is divided into 100 sec bins |
 |
 |
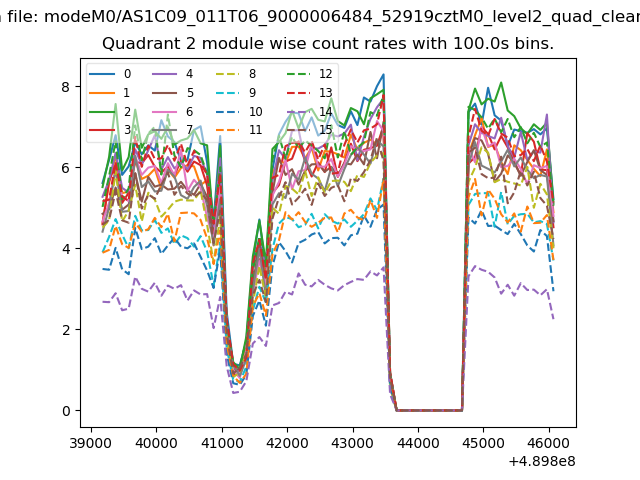
| Module-wise count rates for Quadrant B Data is divided into 100 sec bins |
 |
 |
| Module-wise count rates for Quadrant C Data is divided into 100 sec bins |
 |
 |
| Module-wise count rates for Quadrant D Data is divided into 100 sec bins |
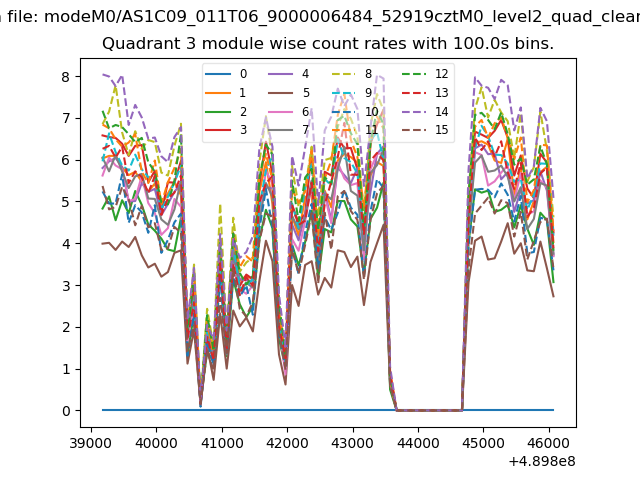 |
 |
| Parameter | Plot |
|---|---|
| CZT HV Monitor | 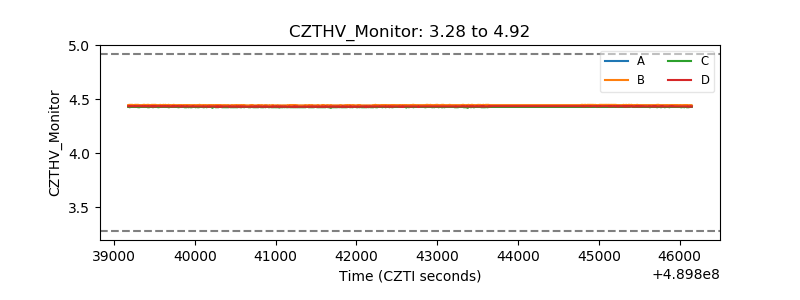 |
| D_VDD | 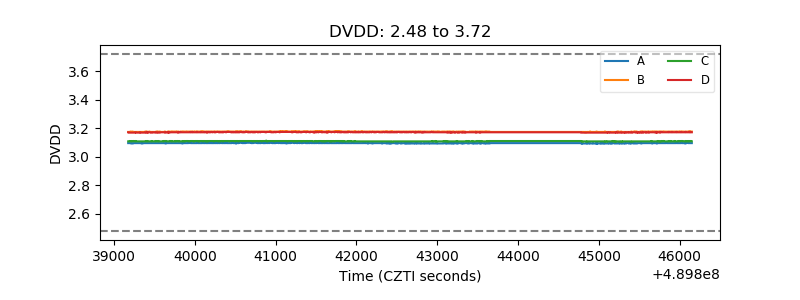 |
| Temperature 1 | 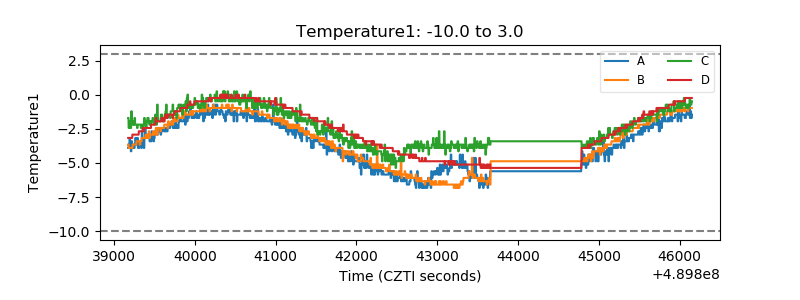 |
| Veto HV Monitor | 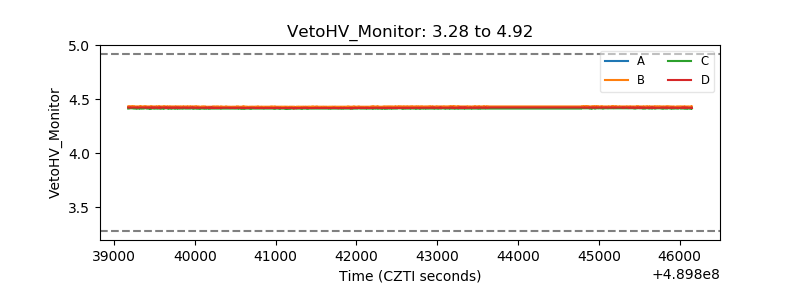 |
| Veto LLD | 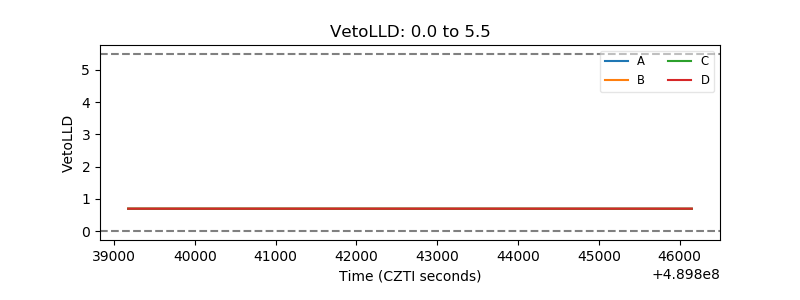 |
| Alpha Counter | 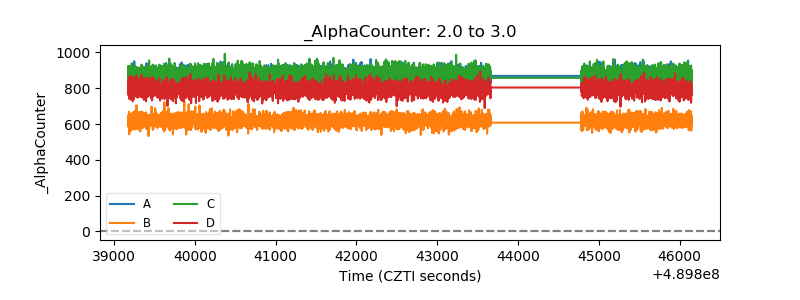 |
| _CPM_Rate | 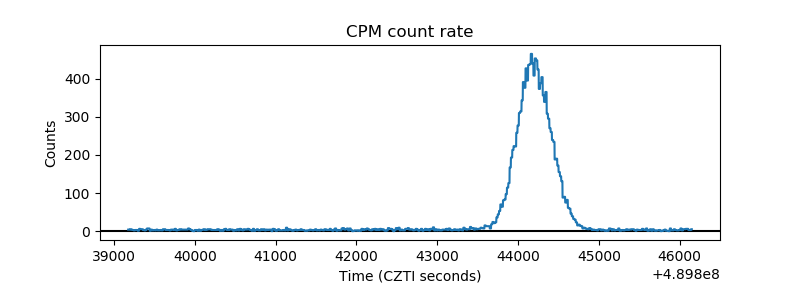 |
| CZT Counter | 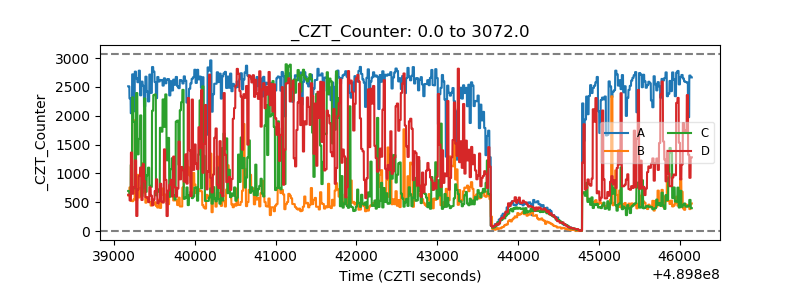 |
| +2.5 Volts monitor |  |
| +5 Volts monitor |  |
| _ROLL_ROT | 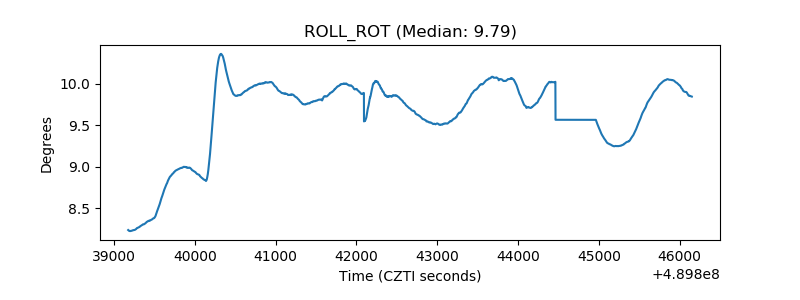 |
| _Roll_DEC | 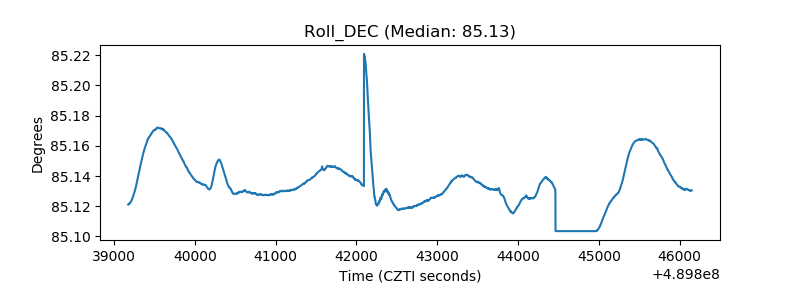 |
| _Roll_RA | 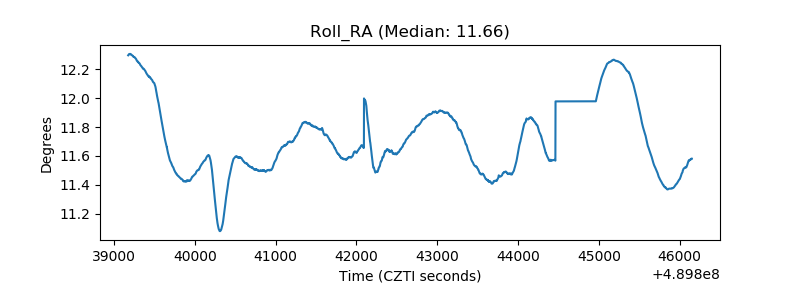 |
| Veto Counter | 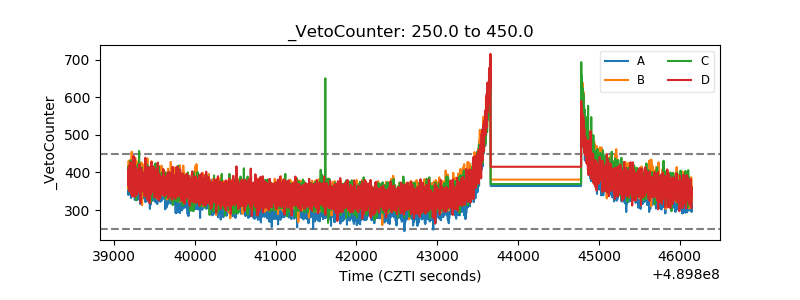 |