| Param | Original file | Final file |
|---|---|---|
| Filename | modeM0/AS1C09_011T06_9000006484_52920cztM0_level2.fits | modeM0/AS1C09_011T06_9000006484_52920cztM0_level2_quad_clean.evt |
| Size (bytes) | 974,433,600 | 71,608,320 |
| Size | 929.3 MB | 68.3 MB |
| Events in quadrant A | 17,022,472 | 4,861 |
| Events in quadrant B | 3,792,466 | 680,431 |
| Events in quadrant C | 4,452,334 | 594,895 |
| Events in quadrant D | 10,286,890 | 422,642 |
| Mode M9 | |||
|---|---|---|---|
| Quadrant | BADHDUFLAG | Total packets | Discarded packets |
| A | 0 | 10 | 0 |
| B | 0 | 10 | 0 |
| C | 0 | 10 | 0 |
| D | 0 | 10 | 0 |
| Mode M0 | |||
|---|---|---|---|
| Quadrant | BADHDUFLAG | Total packets | Discarded packets |
| A | 0 | 55278 | 3 |
| B | 0 | 15724 | 1 |
| C | 0 | 18000 | 1 |
| D | 0 | 35218 | 1 |
| Mode SS | |||
|---|---|---|---|
| Quadrant | BADHDUFLAG | Total packets | Discarded packets |
| A | 0 | 136 | 0 |
| B | 0 | 136 | 0 |
| C | 0 | 136 | 0 |
| D | 0 | 136 | 0 |
| Quadrant | Total seconds | Saturated seconds | Saturation percentage |
|---|---|---|---|
| A | 6670 | 6639 | 99.535232% |
| B | 6671 | 193 | 2.893119% |
| C | 6671 | 295 | 4.422126% |
| D | 6671 | 2177 | 32.633788% |
Noise dominated data is calculated using 1-second bins in cleaned event files. If a bin has >2000 counts, and if more than 50% of those come from <1% of pixels, then it is considered to be noise-dominated and hence unusable.
| Quadrant | # 1 sec bins | Bins with >0 counts | Bins with >2000 counts | High rate bins dominated by noise | Noise dominated (total time) | Noise dominated (detector-on time) | Marked lightcurve |
|---|---|---|---|---|---|---|---|
| A | 7679 | 6668 | 6044 | 6044 | 78.71% | 90.64% | 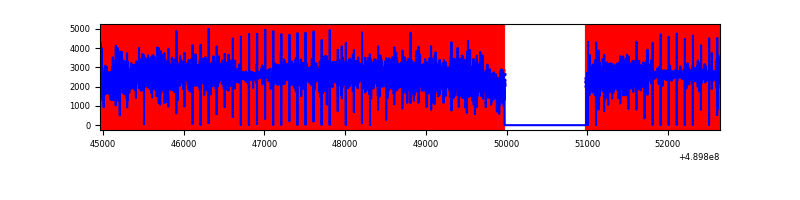 |
| B | 7681 | 6672 | 38 | 38 | 0.49% | 0.57% | 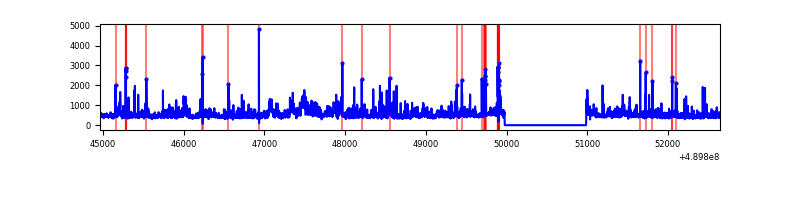 |
| C | 7681 | 6672 | 161 | 161 | 2.10% | 2.41% | 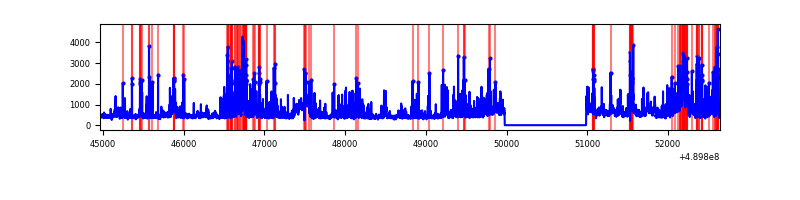 |
| D | 7681 | 6672 | 2107 | 2107 | 27.43% | 31.58% | 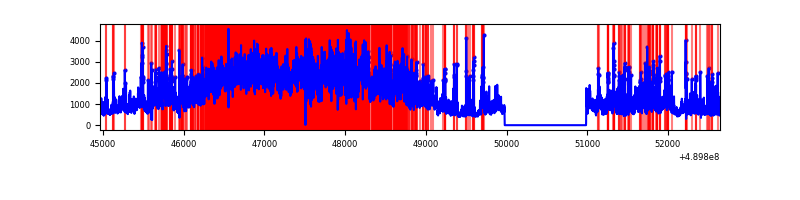 |
Top three noisy pixels from each quadrant. If the there are fewer than three noisy pixels in the level2.evt file, extra rows are filled as -1
| Pixel properties | Quadrant properties | ||||||
|---|---|---|---|---|---|---|---|
| Quadrant | DetID | PixID | Counts | Sigma | Mean | Median | Sigma |
| A | 9 | 191 | 15856251 | 262214.17 | 231 | 225 | 60.5 |
| A | 0 | 8 | 79336 | 1308.27 | 231 | 225 | 60.5 |
| A | 15 | 174 | 35128 | 577.2 | 231 | 225 | 60.5 |
| B | 10 | 254 | 305454 | 2074.1 | 696 | 672 | 146.9 |
| B | 4 | 81 | 213214 | 1446.39 | 696 | 672 | 146.9 |
| B | 12 | 32 | 144662 | 979.88 | 696 | 672 | 146.9 |
| C | 13 | 3 | 278072 | 1505.75 | 679 | 673 | 184.2 |
| C | 7 | 80 | 251910 | 1363.74 | 679 | 673 | 184.2 |
| C | 15 | 224 | 216350 | 1170.72 | 679 | 673 | 184.2 |
| D | 15 | 78 | 3464061 | 19724.62 | 615 | 586 | 175.6 |
| D | 8 | 48 | 2230746 | 12700.85 | 615 | 586 | 175.6 |
| D | 15 | 125 | 762017 | 4336.38 | 615 | 586 | 175.6 |
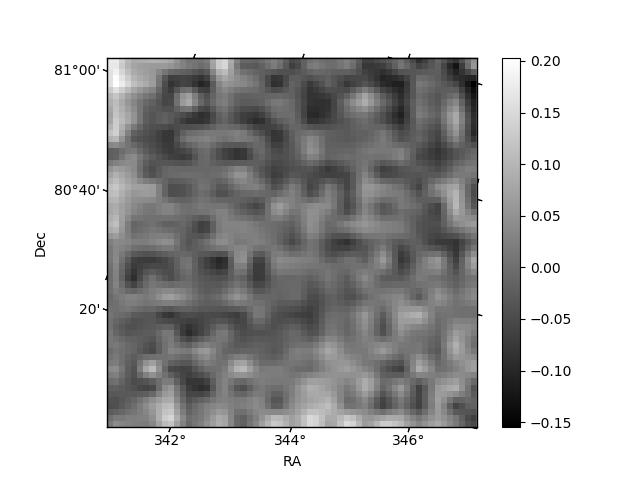
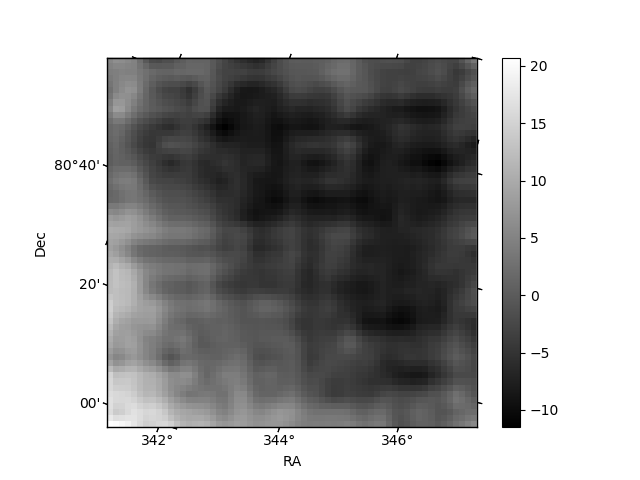
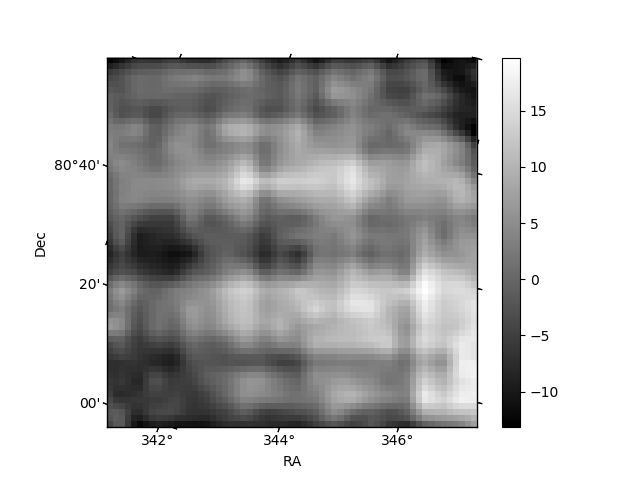
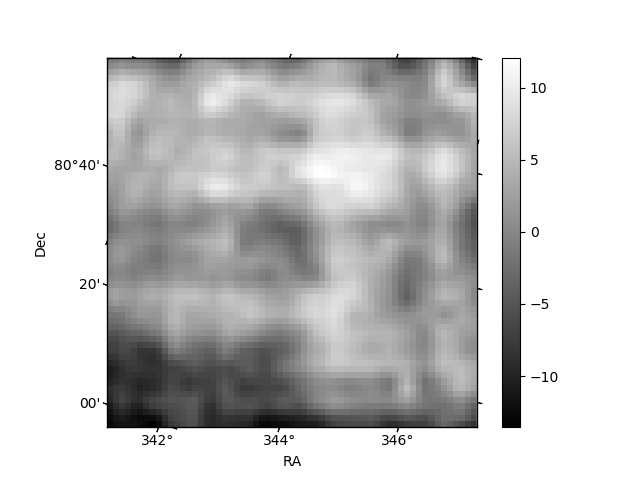
Histogram calculated using DETX and DETY for each event in the final _common_clean file
| Quadrant A | 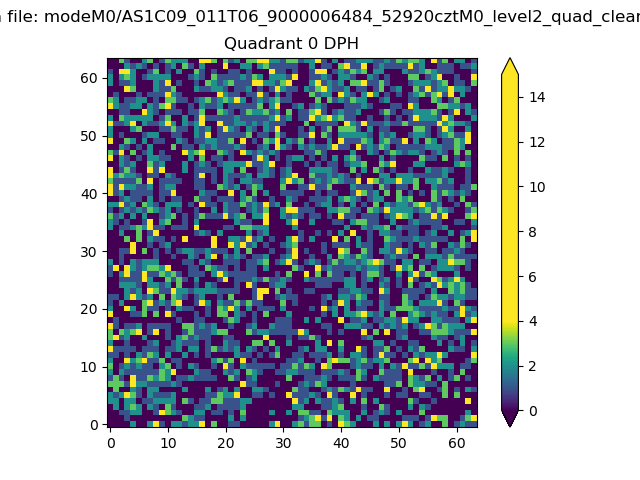 |
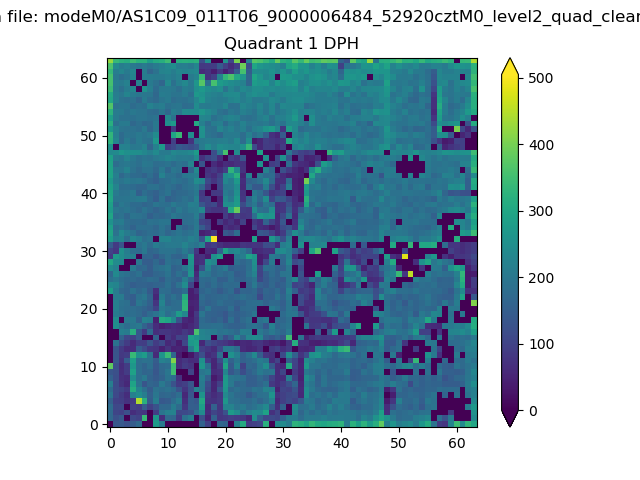 |
Quadrant B |
|---|---|---|---|
| Quadrant D | 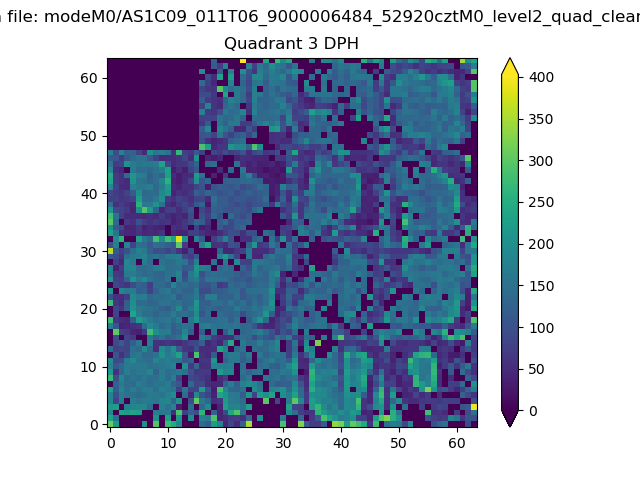 |
 |
Quadrant C |
| Plot type | Count rate plots | Images |
|---|---|---|
| Comparison with Poisson distribution Blue bars denote a histogram of data divided into 1 sec bins. Red curve is a Poisson curve with rate = median count rate of data. |
 |
 |
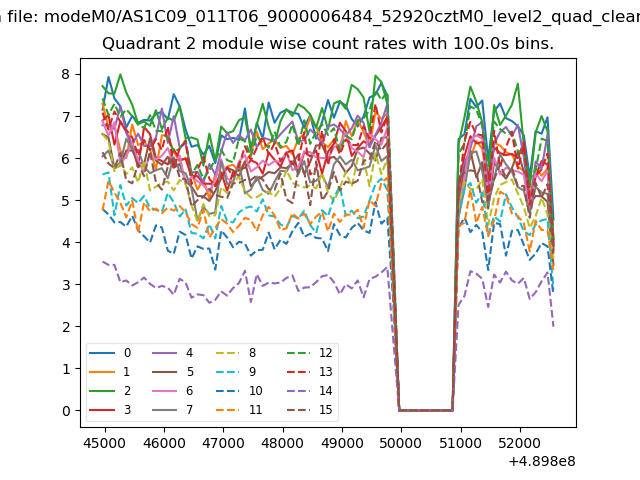
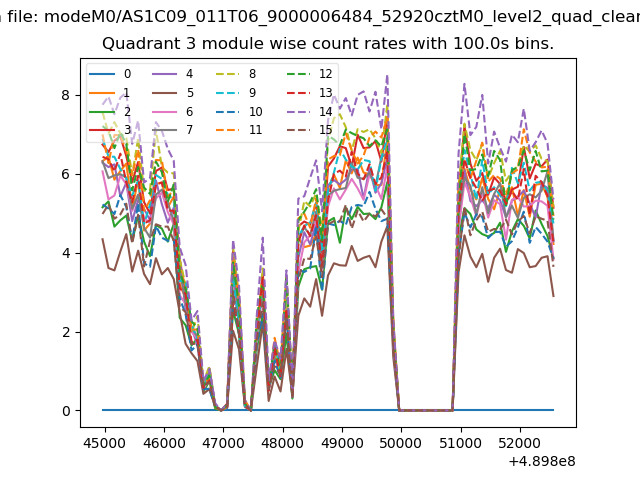
| Quadrant-wise count rates Data is divided into 100 sec bins |
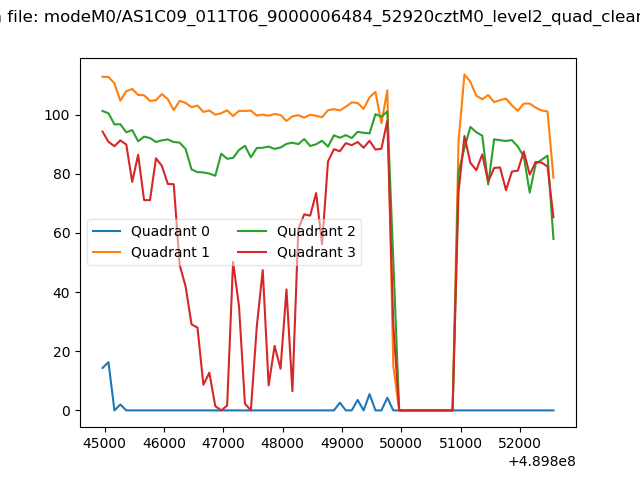 |
|
| Module-wise count rates for Quadrant A Data is divided into 100 sec bins |
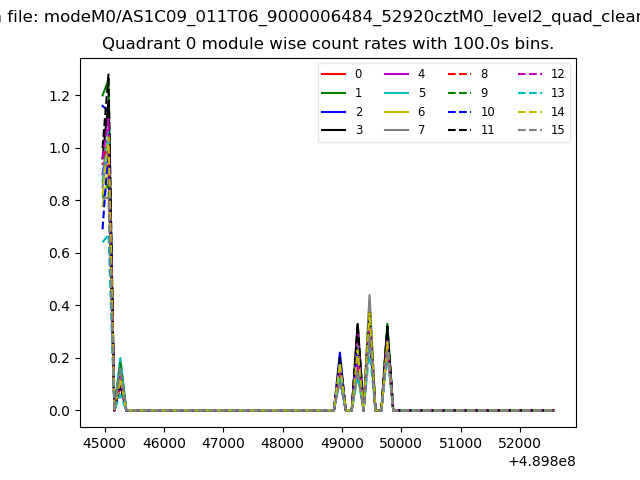 |
 |
| Module-wise count rates for Quadrant B Data is divided into 100 sec bins |
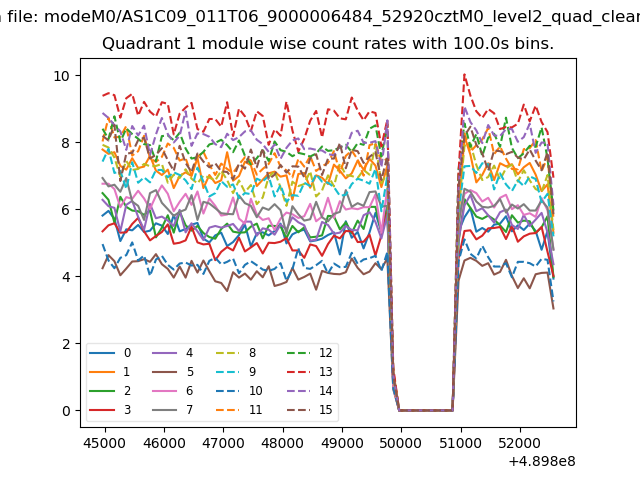 |
 |
| Module-wise count rates for Quadrant C Data is divided into 100 sec bins |
 |
 |
| Module-wise count rates for Quadrant D Data is divided into 100 sec bins |
 |
 |
| Parameter | Plot |
|---|---|
| CZT HV Monitor | 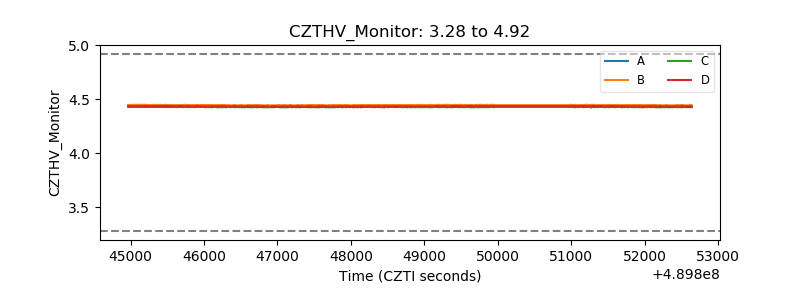 |
| D_VDD | 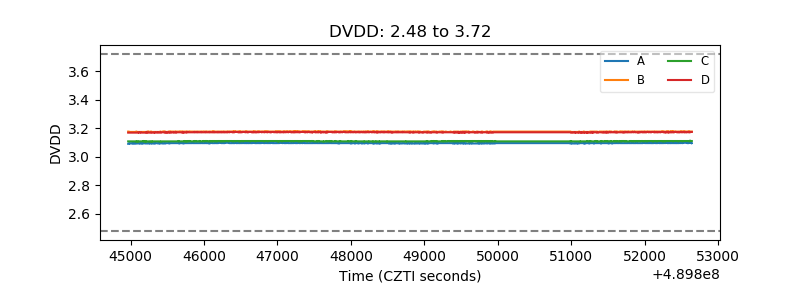 |
| Temperature 1 | 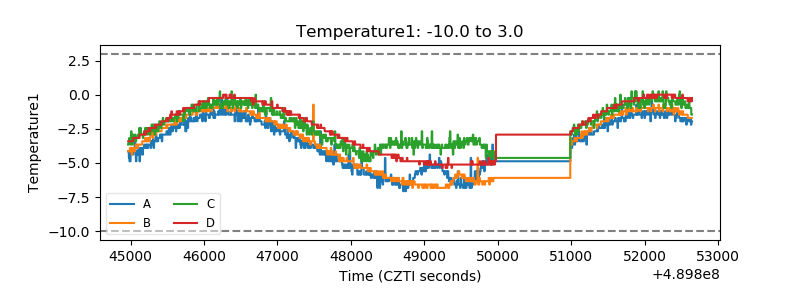 |
| Veto HV Monitor | 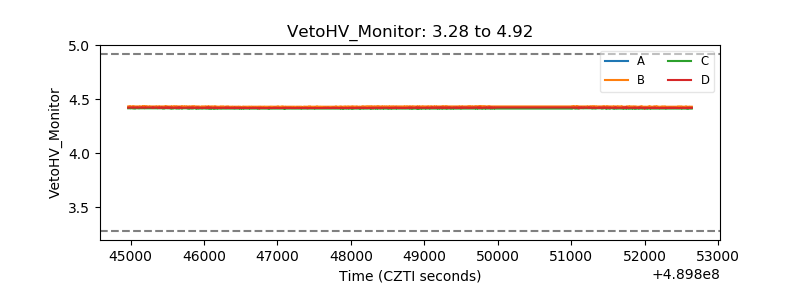 |
| Veto LLD | 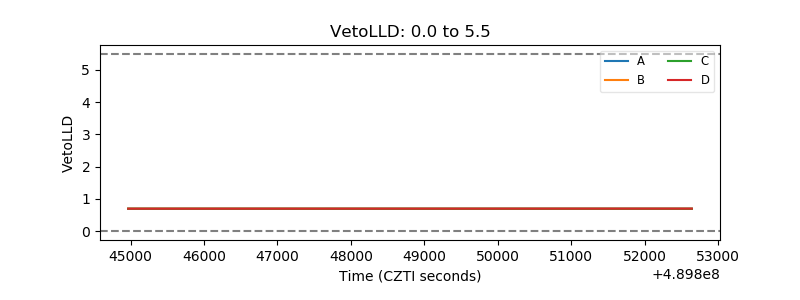 |
| Alpha Counter | 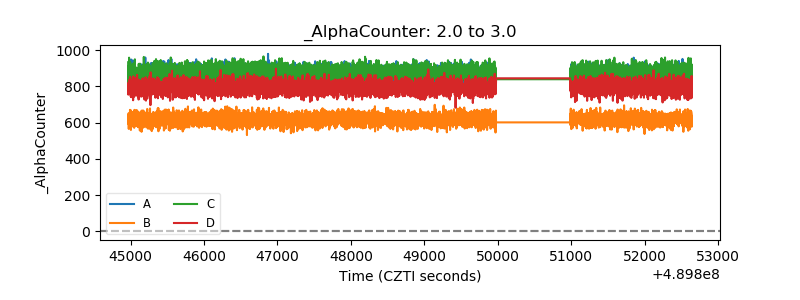 |
| _CPM_Rate | 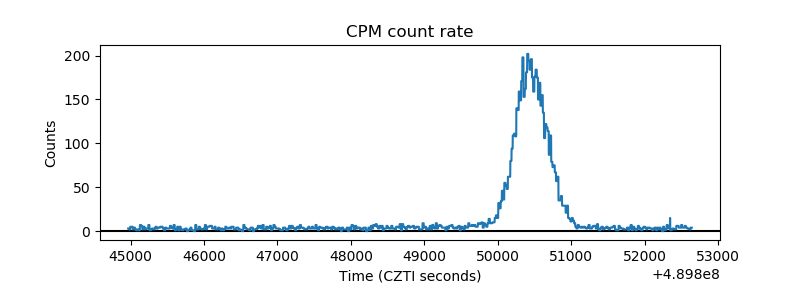 |
| CZT Counter | 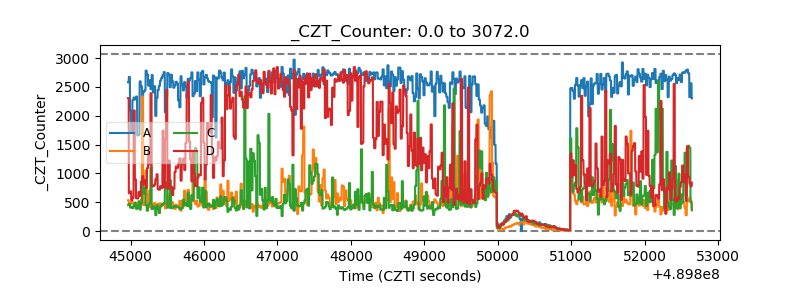 |
| +2.5 Volts monitor |  |
| +5 Volts monitor | 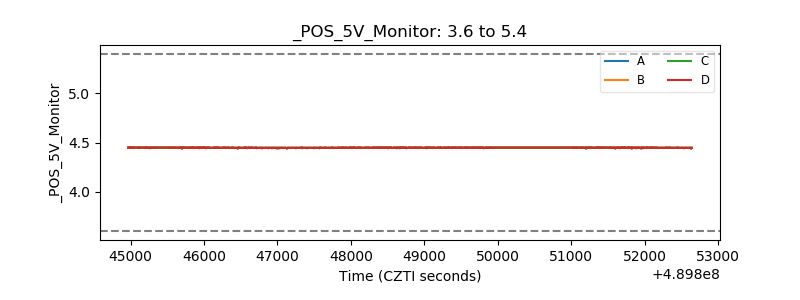 |
| _ROLL_ROT | 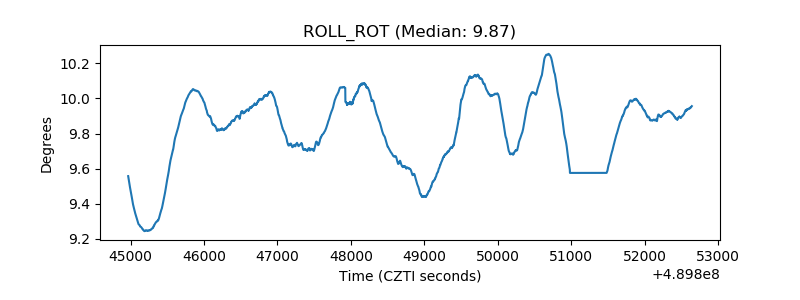 |
| _Roll_DEC | 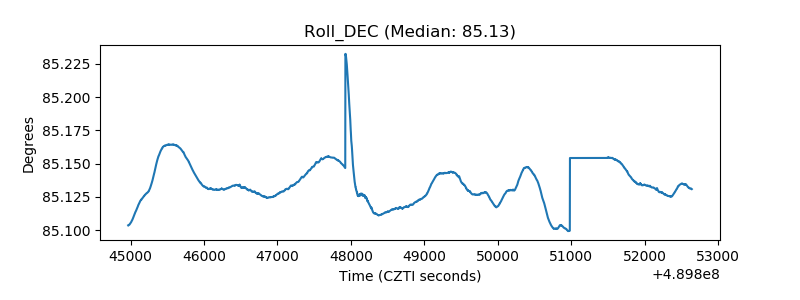 |
| _Roll_RA | 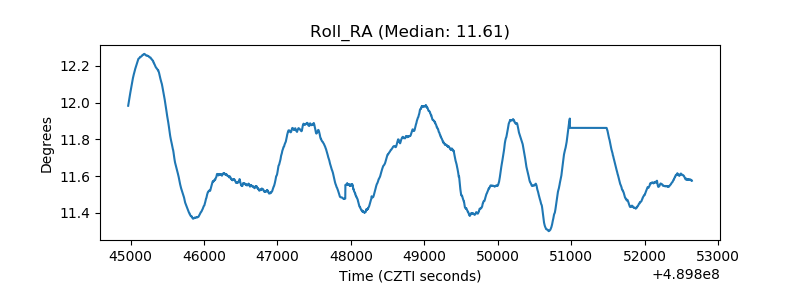 |
| Veto Counter | 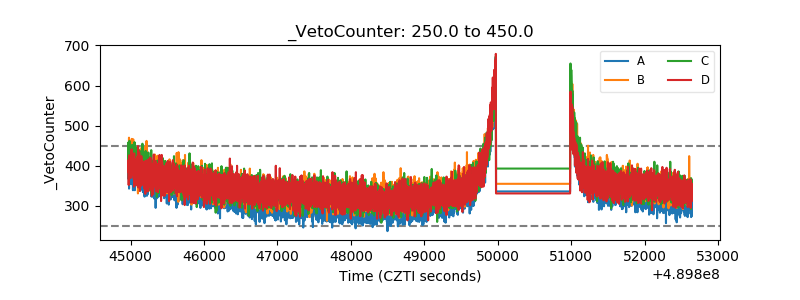 |