| Param | Original file | Final file |
|---|---|---|
| Filename | modeM0/AS1C09_011T06_9000006484_52921cztM0_level2.fits | modeM0/AS1C09_011T06_9000006484_52921cztM0_level2_quad_clean.evt |
| Size (bytes) | 902,911,680 | 73,555,200 |
| Size | 861.1 MB | 70.1 MB |
| Events in quadrant A | 16,080,689 | 81,691 |
| Events in quadrant B | 3,780,314 | 657,100 |
| Events in quadrant C | 4,367,813 | 572,655 |
| Events in quadrant D | 8,685,194 | 456,987 |
| Mode M9 | |||
|---|---|---|---|
| Quadrant | BADHDUFLAG | Total packets | Discarded packets |
| A | 0 | 7 | 0 |
| B | 0 | 7 | 0 |
| C | 0 | 7 | 0 |
| D | 0 | 7 | 0 |
| Mode M0 | |||
|---|---|---|---|
| Quadrant | BADHDUFLAG | Total packets | Discarded packets |
| A | 0 | 52383 | 1 |
| B | 0 | 15816 | 1 |
| C | 0 | 17757 | 1 |
| D | 0 | 30411 | 7 |
| Mode SS | |||
|---|---|---|---|
| Quadrant | BADHDUFLAG | Total packets | Discarded packets |
| A | 0 | 134 | 0 |
| B | 0 | 134 | 0 |
| C | 0 | 134 | 0 |
| D | 0 | 134 | 0 |
| Quadrant | Total seconds | Saturated seconds | Saturation percentage |
|---|---|---|---|
| A | 6572 | 5853 | 89.059647% |
| B | 6573 | 218 | 3.316598% |
| C | 6573 | 359 | 5.461737% |
| D | 6572 | 1471 | 22.382836% |
Noise dominated data is calculated using 1-second bins in cleaned event files. If a bin has >2000 counts, and if more than 50% of those come from <1% of pixels, then it is considered to be noise-dominated and hence unusable.
| Quadrant | # 1 sec bins | Bins with >0 counts | Bins with >2000 counts | High rate bins dominated by noise | Noise dominated (total time) | Noise dominated (detector-on time) | Marked lightcurve |
|---|---|---|---|---|---|---|---|
| A | 7306 | 6572 | 5431 | 5431 | 74.34% | 82.64% | 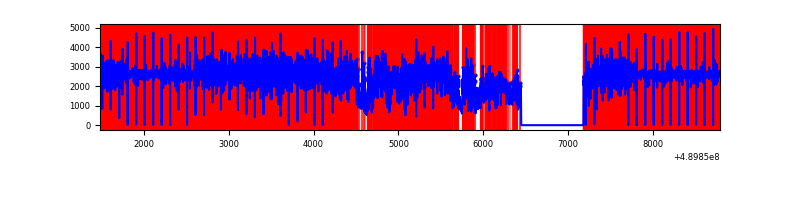 |
| B | 7308 | 6574 | 49 | 49 | 0.67% | 0.75% | 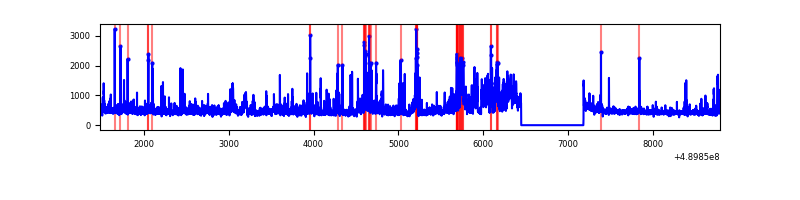 |
| C | 7308 | 6574 | 187 | 187 | 2.56% | 2.84% | 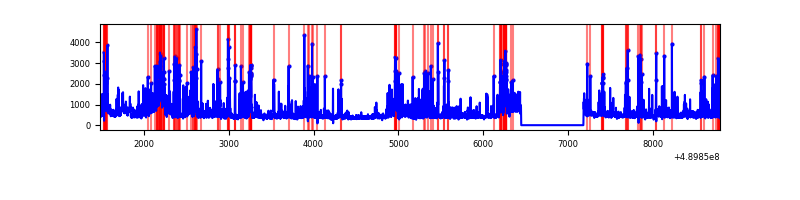 |
| D | 7306 | 6572 | 1069 | 1069 | 14.63% | 16.27% | 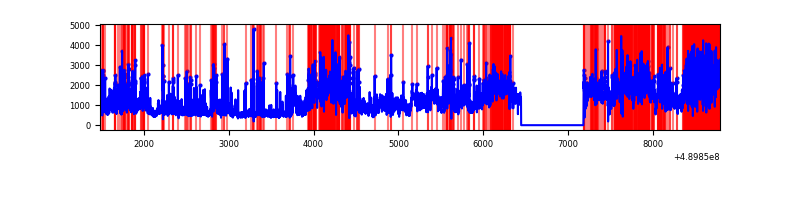 |
Top three noisy pixels from each quadrant. If the there are fewer than three noisy pixels in the level2.evt file, extra rows are filled as -1
| Pixel properties | Quadrant properties | ||||||
|---|---|---|---|---|---|---|---|
| Quadrant | DetID | PixID | Counts | Sigma | Mean | Median | Sigma |
| A | 9 | 191 | 14659065 | 200484.29 | 287 | 279 | 73.1 |
| A | 12 | 115 | 61653 | 839.4 | 287 | 279 | 73.1 |
| A | 3 | 45 | 28127 | 380.87 | 287 | 279 | 73.1 |
| B | 10 | 254 | 538299 | 3771.9 | 679 | 656 | 142.5 |
| B | 4 | 81 | 125122 | 873.21 | 679 | 656 | 142.5 |
| B | 10 | 247 | 99831 | 695.77 | 679 | 656 | 142.5 |
| C | 13 | 3 | 454668 | 2506.43 | 659 | 651 | 181.1 |
| C | 7 | 80 | 300452 | 1655.07 | 659 | 651 | 181.1 |
| C | 12 | 252 | 231550 | 1274.69 | 659 | 651 | 181.1 |
| D | 15 | 78 | 2944624 | 16759.31 | 617 | 591 | 175.7 |
| D | 12 | 0 | 1080398 | 6146.95 | 617 | 591 | 175.7 |
| D | 8 | 176 | 915233 | 5206.72 | 617 | 591 | 175.7 |
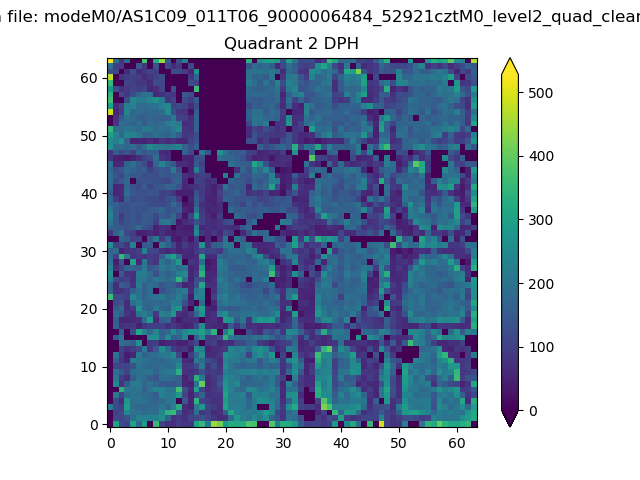
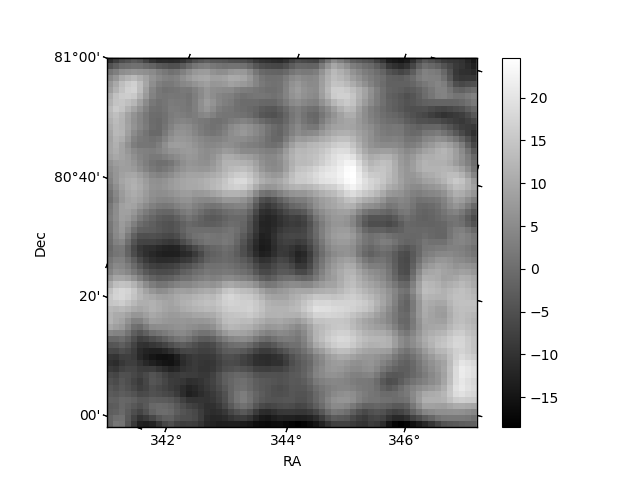
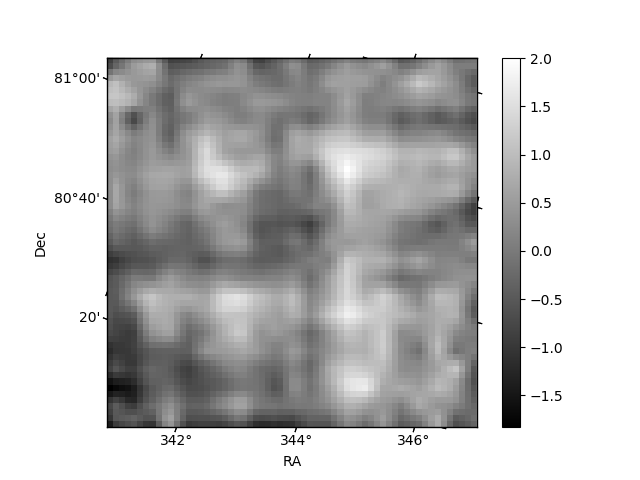
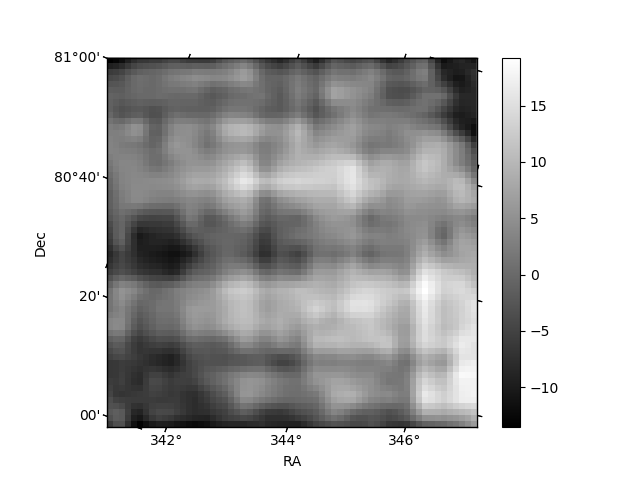
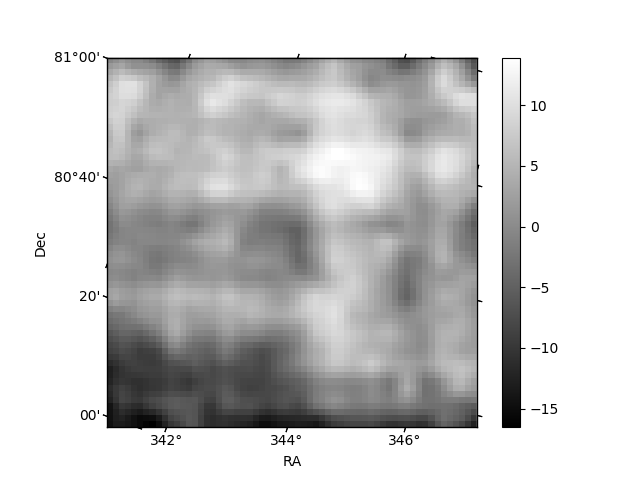
Histogram calculated using DETX and DETY for each event in the final _common_clean file
| Quadrant A | 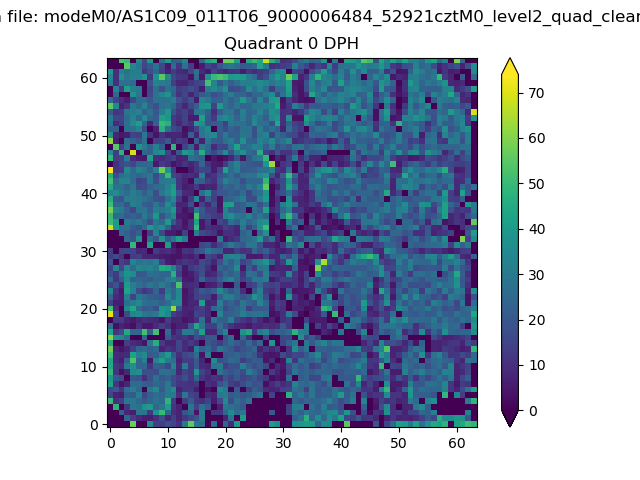 |
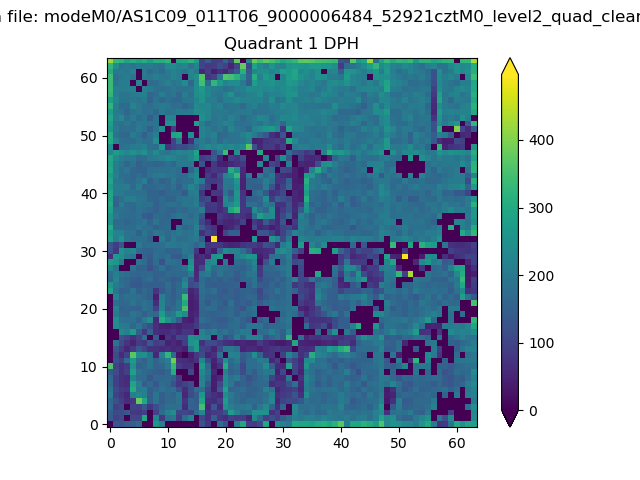 |
Quadrant B |
|---|---|---|---|
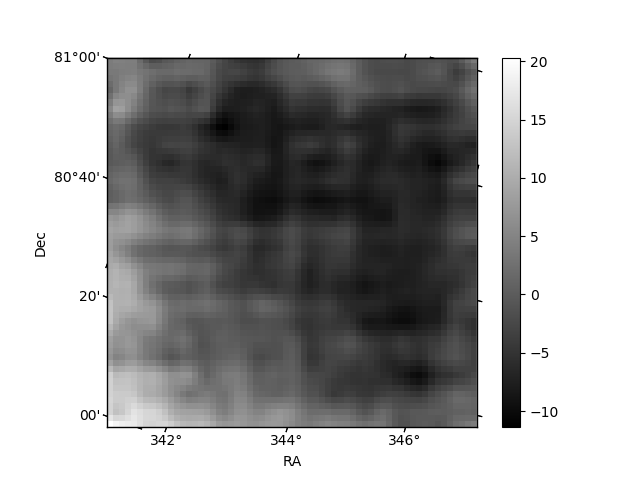
| Quadrant D | 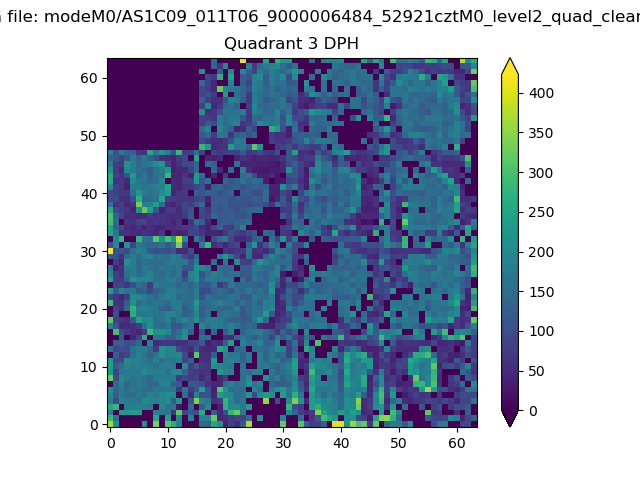 |
 |
Quadrant C |
| Plot type | Count rate plots | Images |
|---|---|---|
| Comparison with Poisson distribution Blue bars denote a histogram of data divided into 1 sec bins. Red curve is a Poisson curve with rate = median count rate of data. |
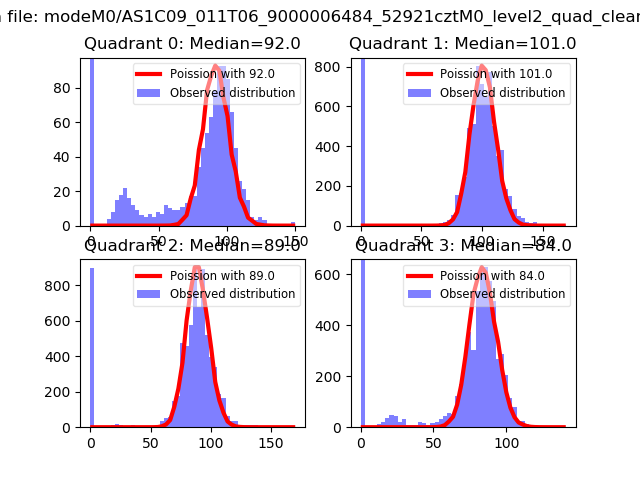 |
 |
| Quadrant-wise count rates Data is divided into 100 sec bins |
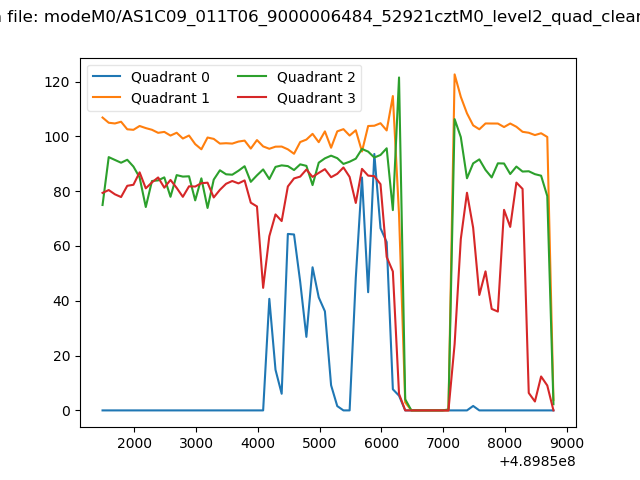 |
|
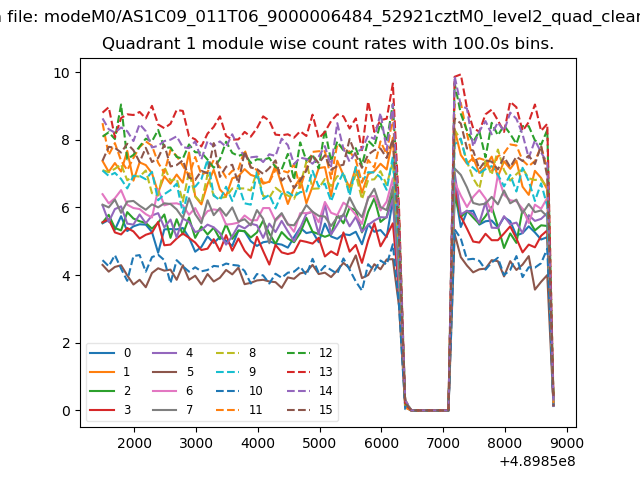
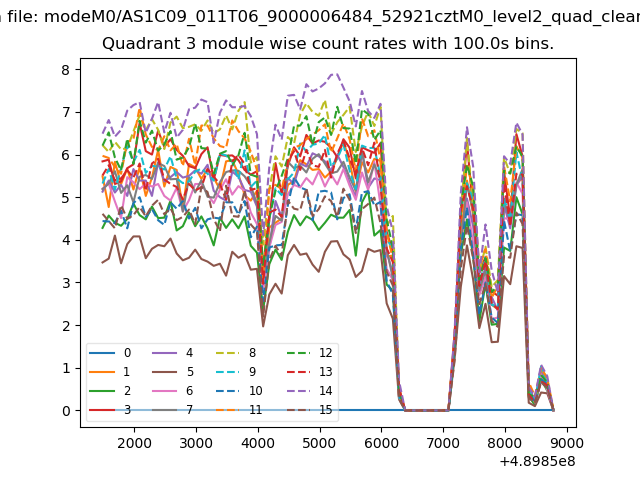
| Module-wise count rates for Quadrant A Data is divided into 100 sec bins |
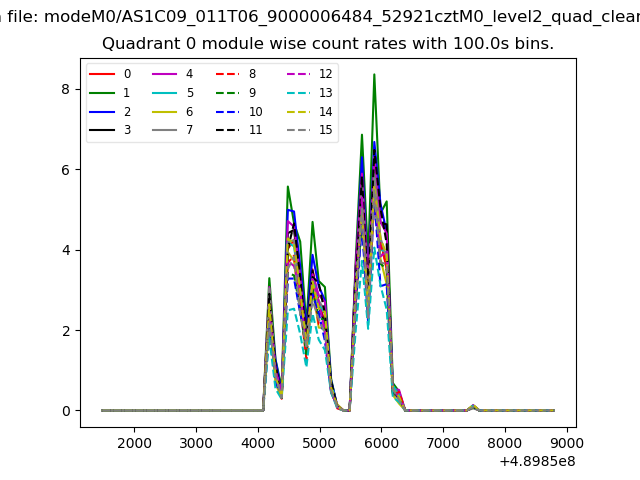 |
 |
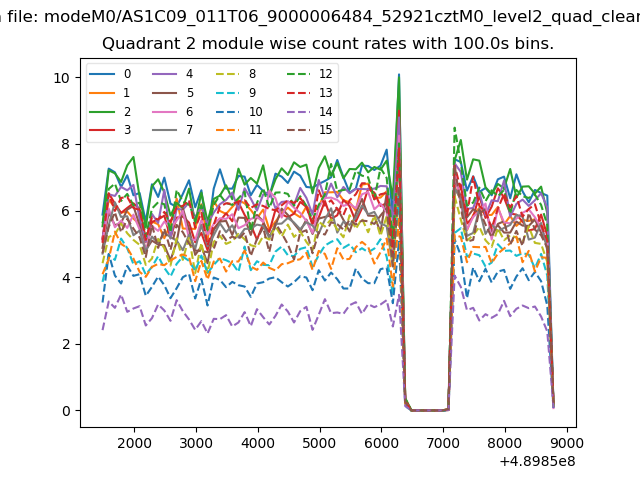
| Module-wise count rates for Quadrant B Data is divided into 100 sec bins |
 |
 |
| Module-wise count rates for Quadrant C Data is divided into 100 sec bins |
 |
 |
| Module-wise count rates for Quadrant D Data is divided into 100 sec bins |
 |
 |
| Parameter | Plot |
|---|---|
| CZT HV Monitor | 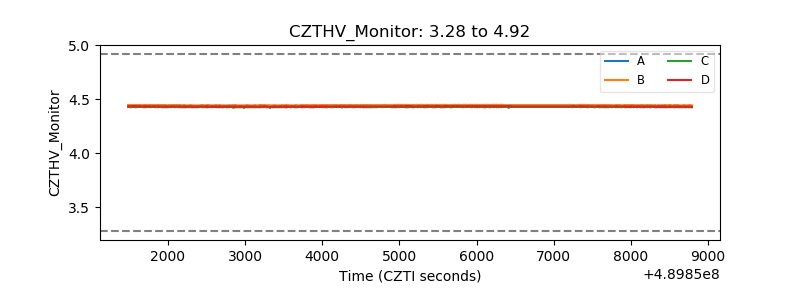 |
| D_VDD | 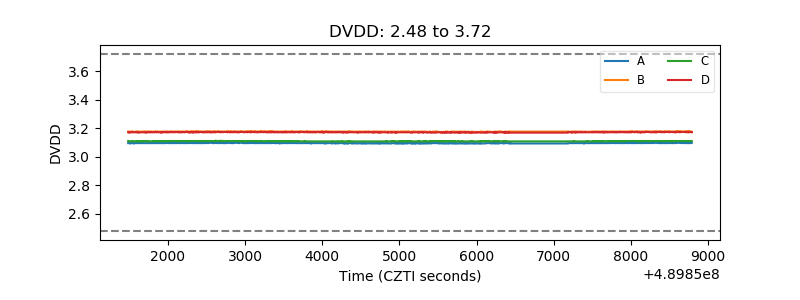 |
| Temperature 1 | 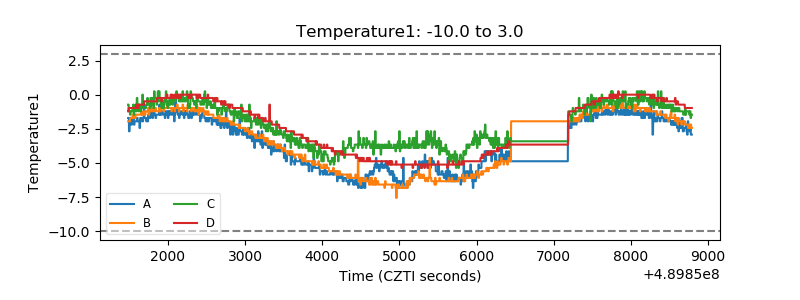 |
| Veto HV Monitor | 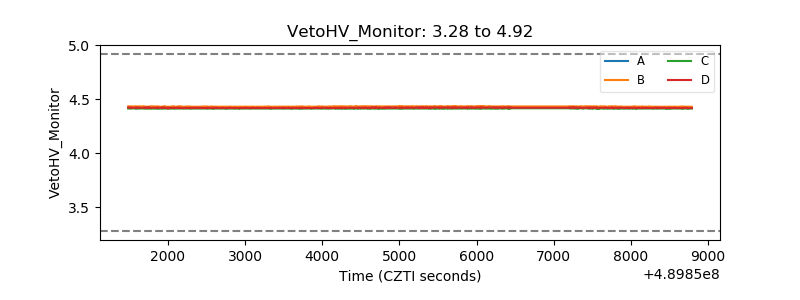 |
| Veto LLD | 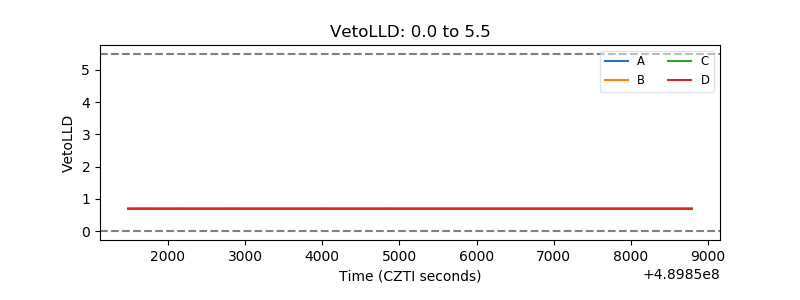 |
| Alpha Counter | 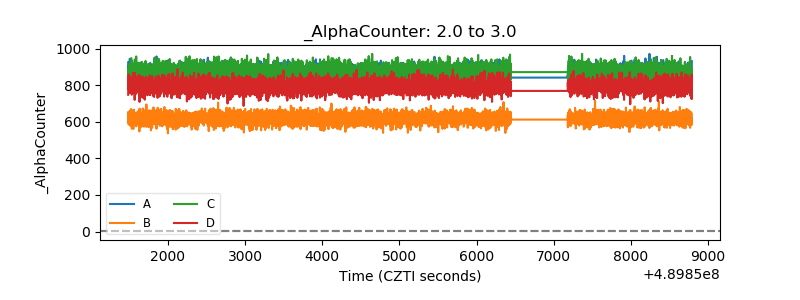 |
| _CPM_Rate | 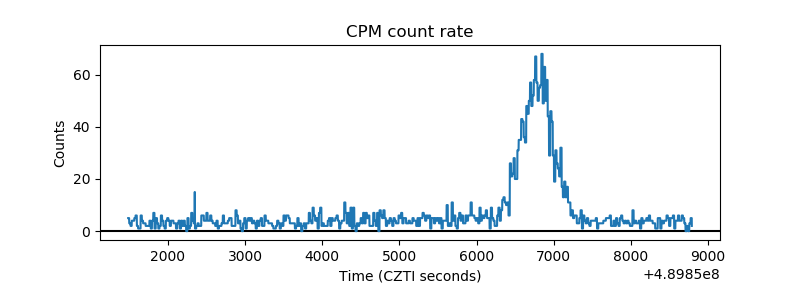 |
| CZT Counter | 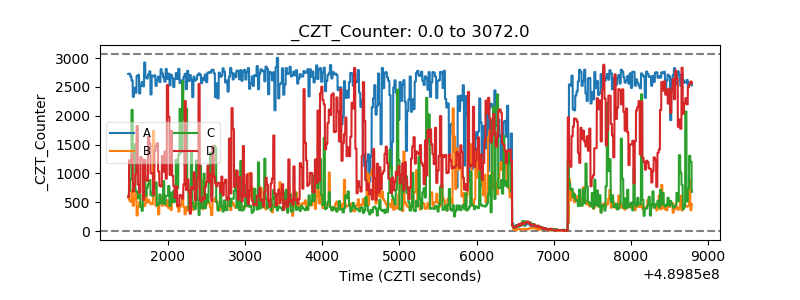 |
| +2.5 Volts monitor | 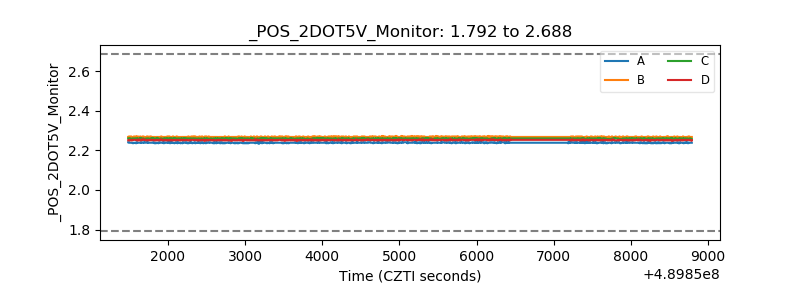 |
| +5 Volts monitor |  |
| _ROLL_ROT | 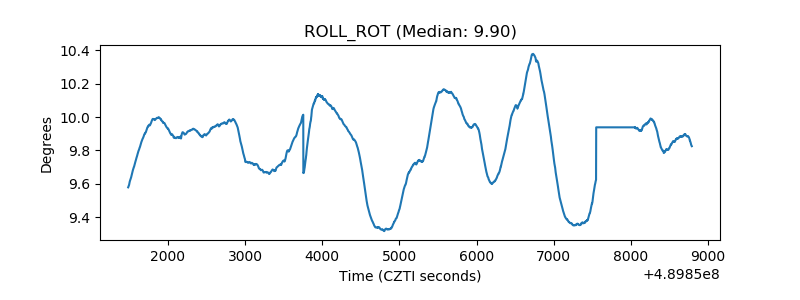 |
| _Roll_DEC | 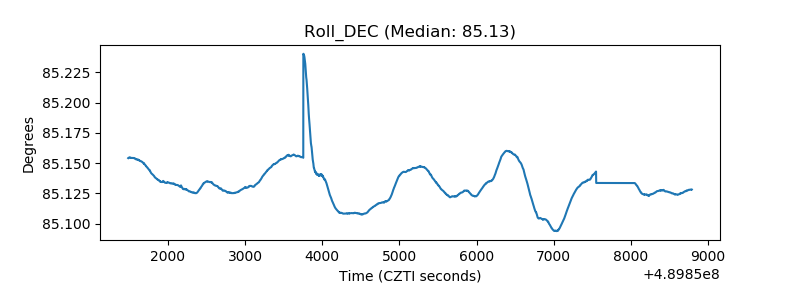 |
| _Roll_RA | 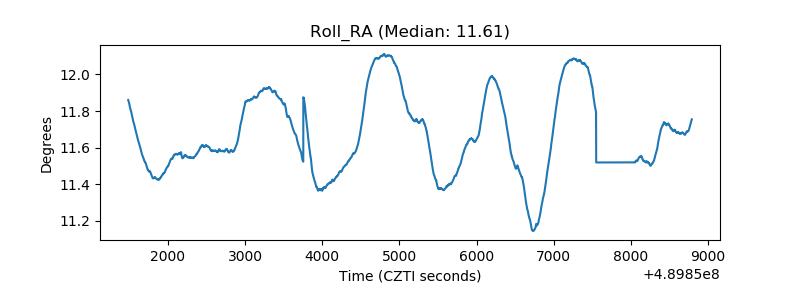 |
| Veto Counter | 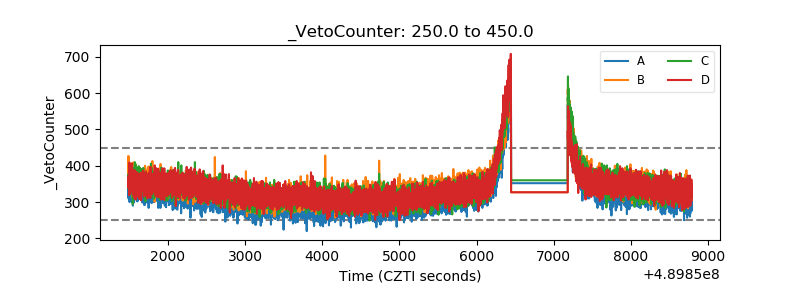 |