| Param | Original file | Final file |
|---|---|---|
| Filename | modeM0/AS1C09_011T06_9000006484_52922cztM0_level2.fits | modeM0/AS1C09_011T06_9000006484_52922cztM0_level2_quad_clean.evt |
| Size (bytes) | 928,010,880 | 72,348,480 |
| Size | 885.0 MB | 69.0 MB |
| Events in quadrant A | 16,494,824 | 43,868 |
| Events in quadrant B | 3,447,231 | 667,404 |
| Events in quadrant C | 4,911,789 | 569,809 |
| Events in quadrant D | 8,982,445 | 444,989 |
| Mode M9 | |||
|---|---|---|---|
| Quadrant | BADHDUFLAG | Total packets | Discarded packets |
| A | 0 | 2 | 0 |
| B | 0 | 2 | 0 |
| C | 0 | 2 | 0 |
| D | 0 | 2 | 0 |
| Mode M0 | |||
|---|---|---|---|
| Quadrant | BADHDUFLAG | Total packets | Discarded packets |
| A | 0 | 53672 | 1 |
| B | 0 | 14991 | 1 |
| C | 0 | 19455 | 1 |
| D | 0 | 31371 | 7 |
| Mode SS | |||
|---|---|---|---|
| Quadrant | BADHDUFLAG | Total packets | Discarded packets |
| A | 0 | 136 | 0 |
| B | 0 | 136 | 0 |
| C | 0 | 136 | 0 |
| D | 0 | 136 | 0 |
| Quadrant | Total seconds | Saturated seconds | Saturation percentage |
|---|---|---|---|
| A | 6655 | 6316 | 94.906086% |
| B | 6656 | 131 | 1.968149% |
| C | 6656 | 488 | 7.331731% |
| D | 6655 | 1780 | 26.746807% |
Noise dominated data is calculated using 1-second bins in cleaned event files. If a bin has >2000 counts, and if more than 50% of those come from <1% of pixels, then it is considered to be noise-dominated and hence unusable.
| Quadrant | # 1 sec bins | Bins with >0 counts | Bins with >2000 counts | High rate bins dominated by noise | Noise dominated (total time) | Noise dominated (detector-on time) | Marked lightcurve |
|---|---|---|---|---|---|---|---|
| A | 6869 | 6654 | 5716 | 5716 | 83.21% | 85.90% | 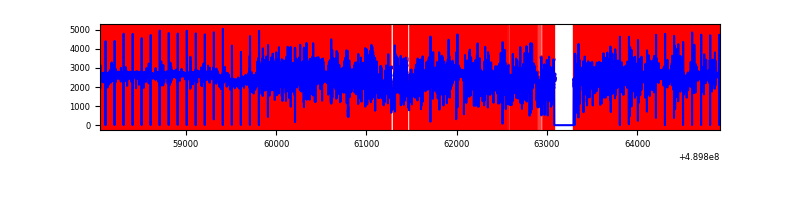 |
| B | 6871 | 6657 | 40 | 40 | 0.58% | 0.60% | 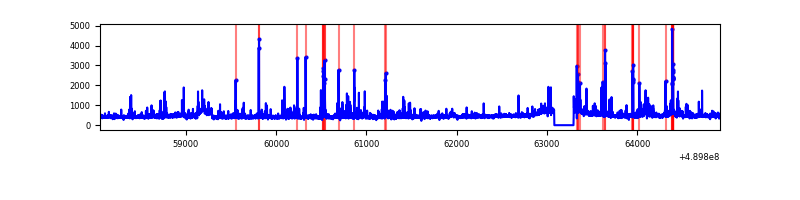 |
| C | 6871 | 6657 | 347 | 347 | 5.05% | 5.21% | 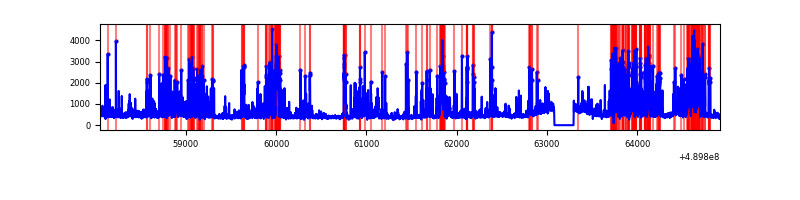 |
| D | 6870 | 6656 | 1519 | 1519 | 22.11% | 22.82% | 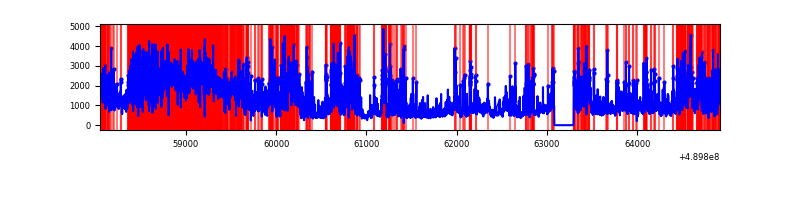 |
Top three noisy pixels from each quadrant. If the there are fewer than three noisy pixels in the level2.evt file, extra rows are filled as -1
| Pixel properties | Quadrant properties | ||||||
|---|---|---|---|---|---|---|---|
| Quadrant | DetID | PixID | Counts | Sigma | Mean | Median | Sigma |
| A | 9 | 191 | 15222074 | 224409.12 | 266 | 259 | 67.8 |
| A | 0 | 8 | 70190 | 1030.96 | 266 | 259 | 67.8 |
| A | 15 | 174 | 28168 | 411.45 | 266 | 259 | 67.8 |
| B | 10 | 247 | 144272 | 982.55 | 693 | 669 | 146.2 |
| B | 5 | 172 | 138689 | 944.35 | 693 | 669 | 146.2 |
| B | 4 | 81 | 85032 | 577.22 | 693 | 669 | 146.2 |
| C | 15 | 224 | 658488 | 3577.5 | 671 | 662 | 183.9 |
| C | 13 | 3 | 545806 | 2964.69 | 671 | 662 | 183.9 |
| C | 7 | 80 | 391093 | 2123.31 | 671 | 662 | 183.9 |
| D | 12 | 0 | 1979608 | 11313.38 | 611 | 583 | 174.9 |
| D | 8 | 176 | 1527252 | 8727.42 | 611 | 583 | 174.9 |
| D | 15 | 78 | 1503078 | 8589.22 | 611 | 583 | 174.9 |
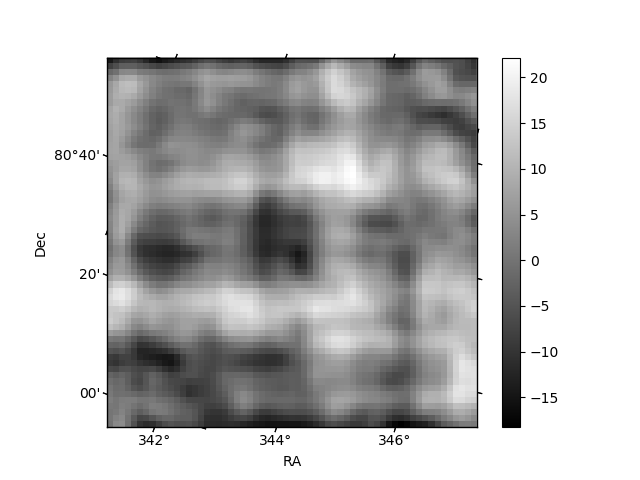
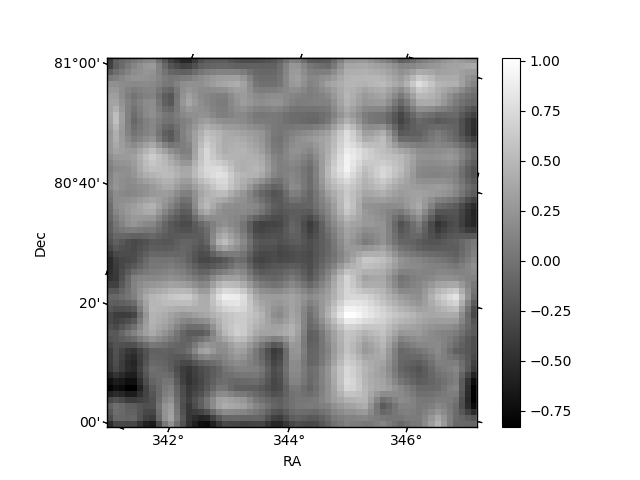
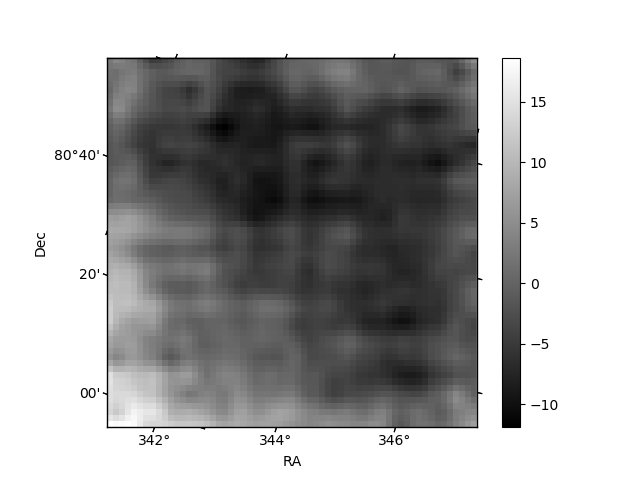
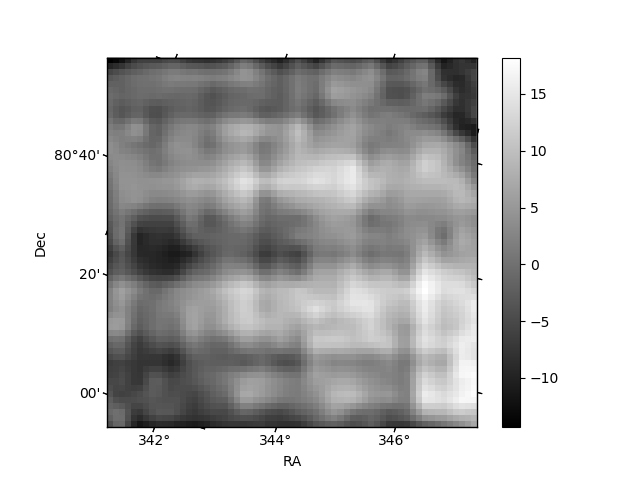
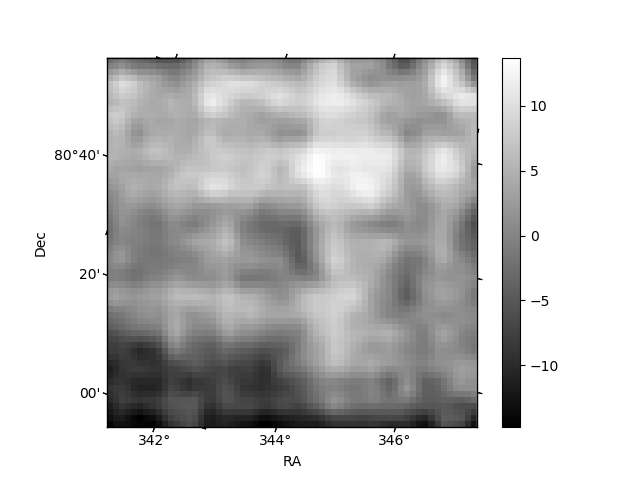
Histogram calculated using DETX and DETY for each event in the final _common_clean file
| Quadrant A | 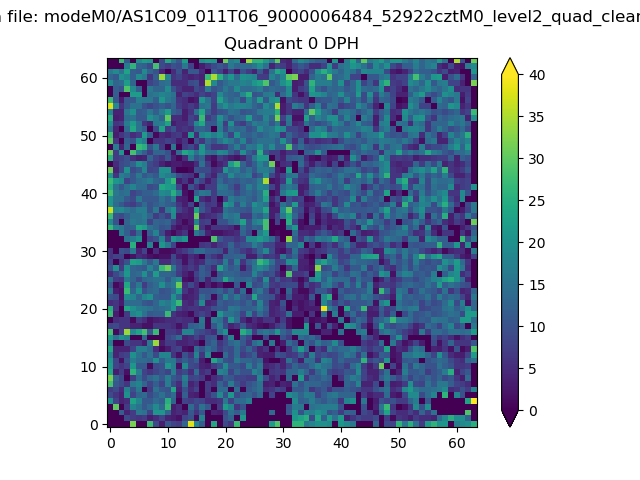 |
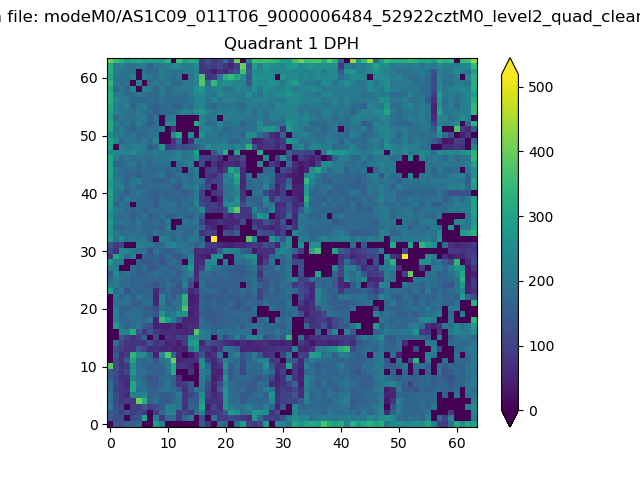 |
Quadrant B |
|---|---|---|---|
| Quadrant D | 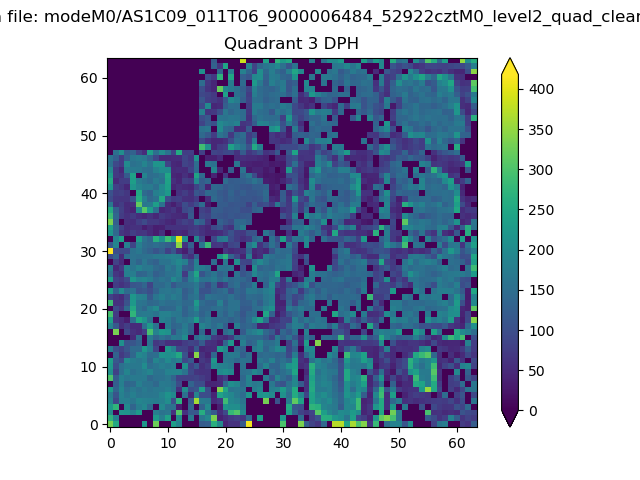 |
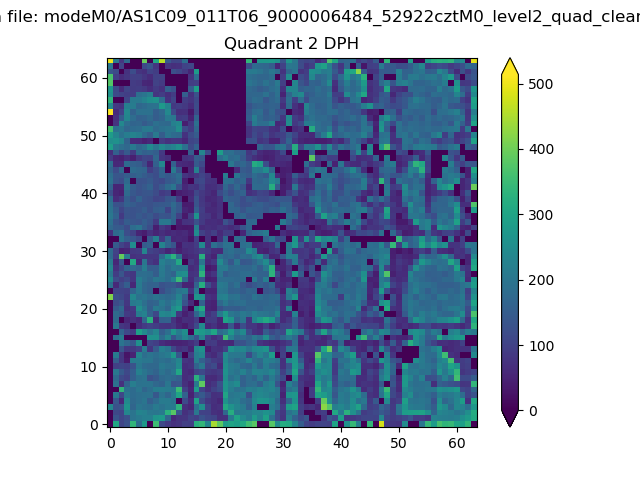 |
Quadrant C |
| Plot type | Count rate plots | Images |
|---|---|---|
| Comparison with Poisson distribution Blue bars denote a histogram of data divided into 1 sec bins. Red curve is a Poisson curve with rate = median count rate of data. |
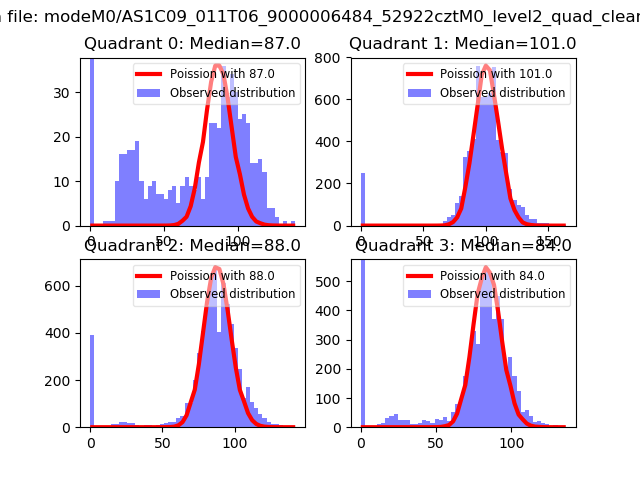 |
 |
| Quadrant-wise count rates Data is divided into 100 sec bins |
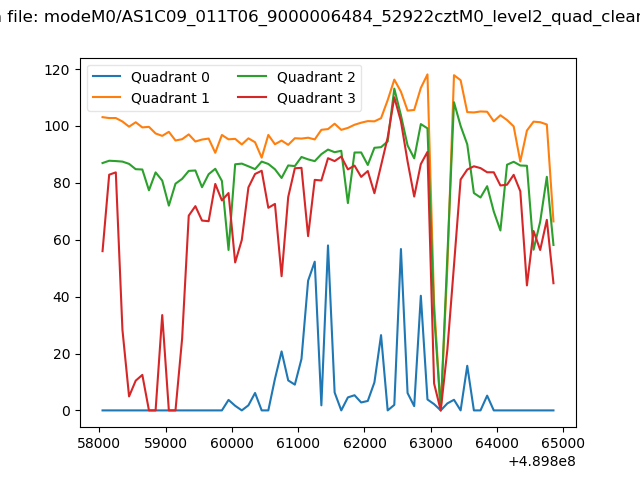 |
|
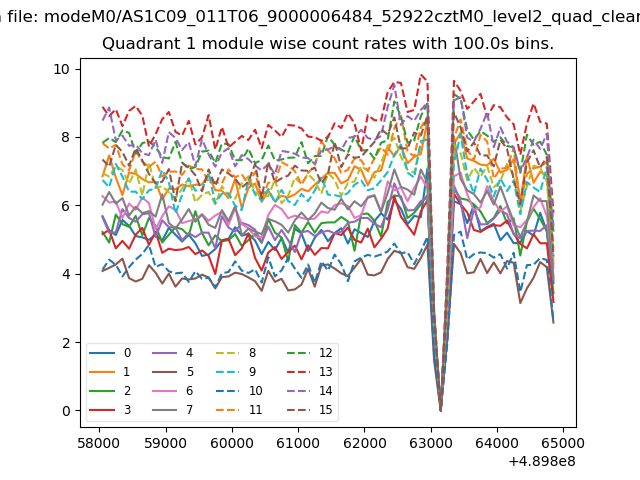
| Module-wise count rates for Quadrant A Data is divided into 100 sec bins |
 |
 |
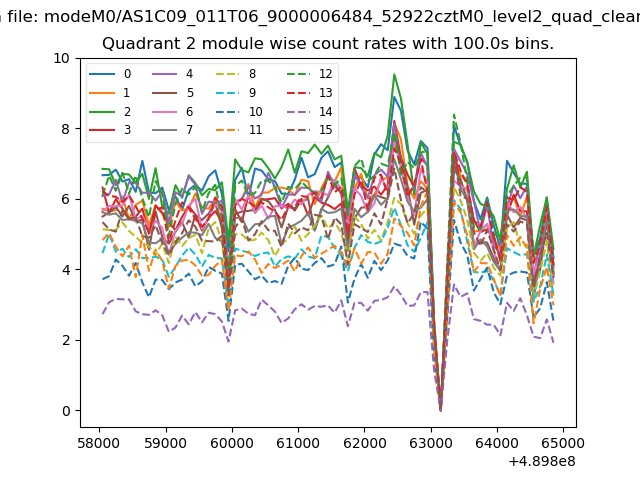
| Module-wise count rates for Quadrant B Data is divided into 100 sec bins |
 |
 |
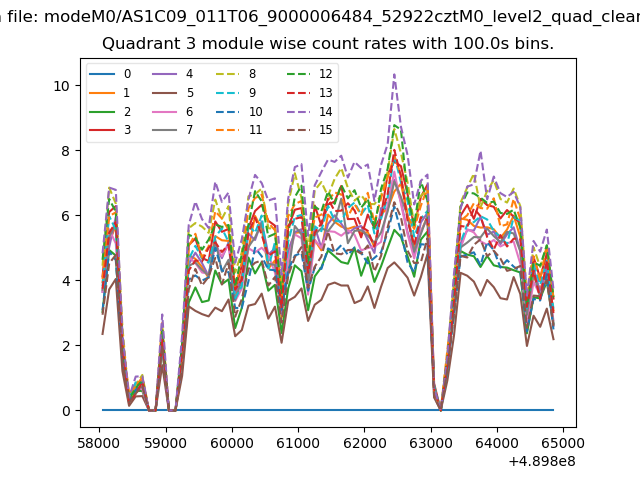
| Module-wise count rates for Quadrant C Data is divided into 100 sec bins |
 |
 |
| Module-wise count rates for Quadrant D Data is divided into 100 sec bins |
 |
 |
| Parameter | Plot |
|---|---|
| CZT HV Monitor | 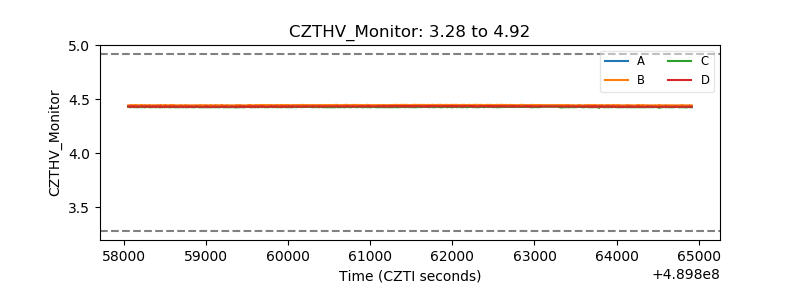 |
| D_VDD | 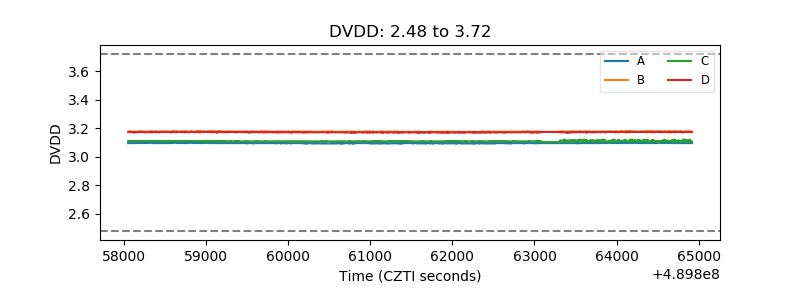 |
| Temperature 1 | 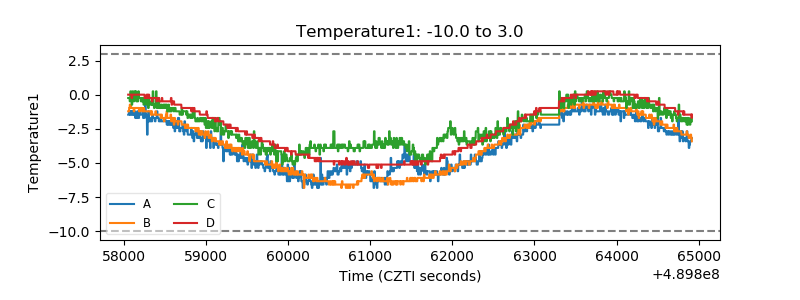 |
| Veto HV Monitor | 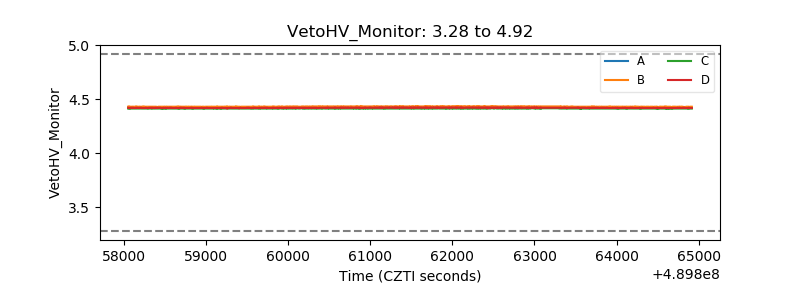 |
| Veto LLD | 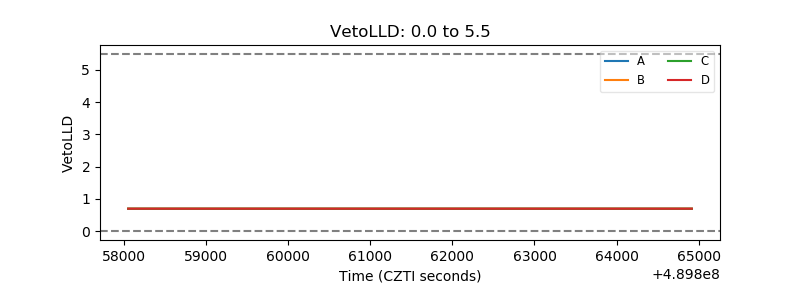 |
| Alpha Counter | 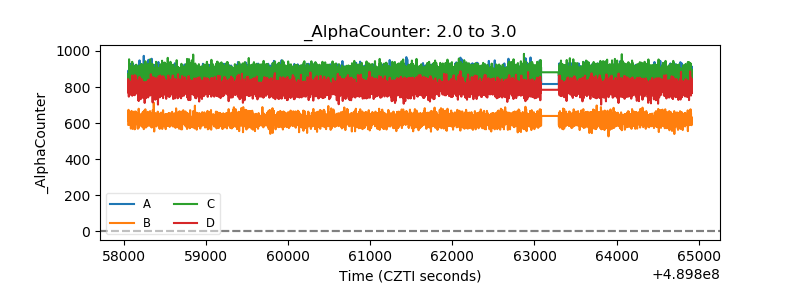 |
| _CPM_Rate | 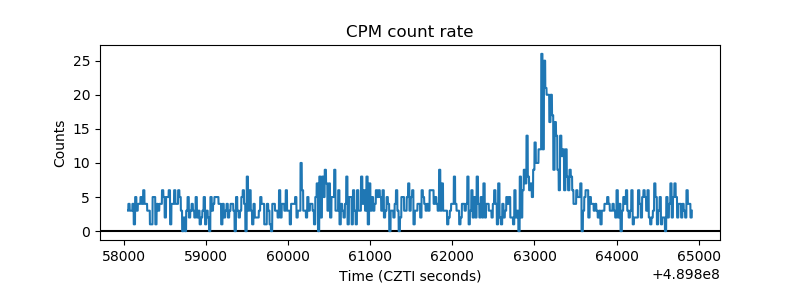 |
| CZT Counter | 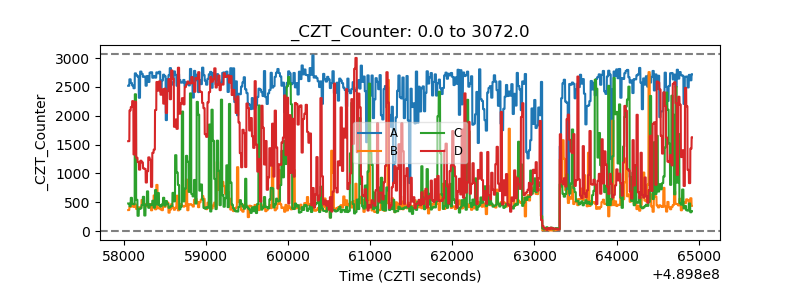 |
| +2.5 Volts monitor |  |
| +5 Volts monitor |  |
| _ROLL_ROT | 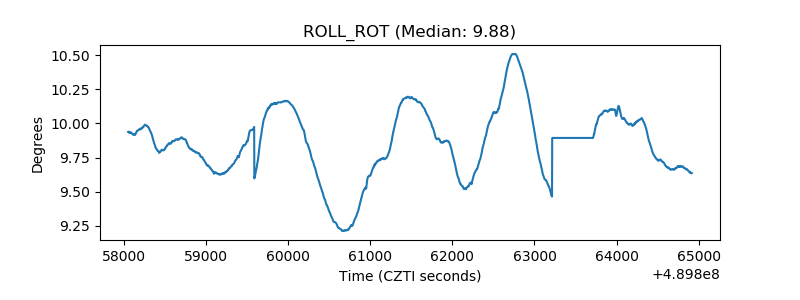 |
| _Roll_DEC | 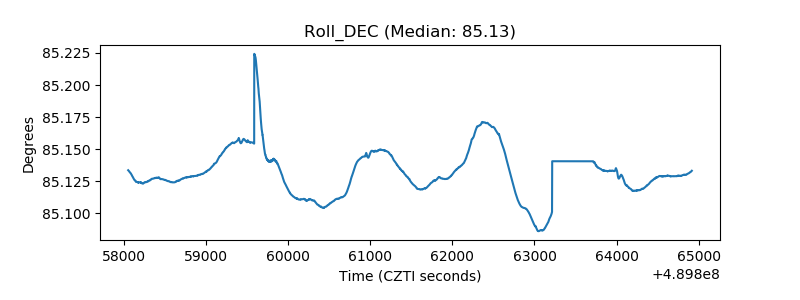 |
| _Roll_RA | 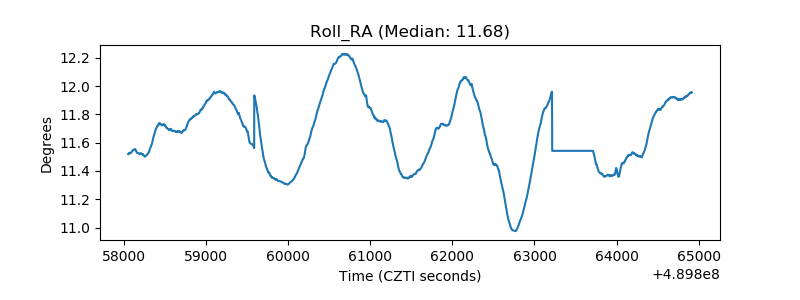 |
| Veto Counter | 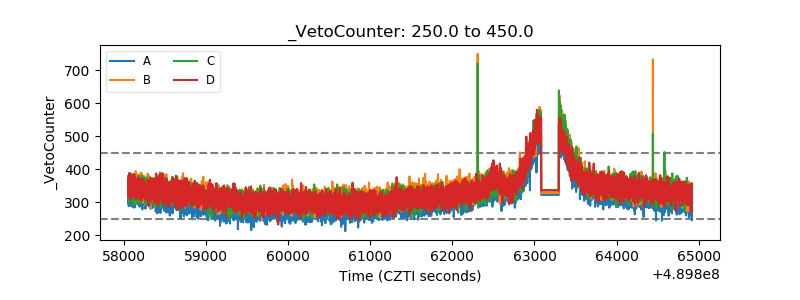 |