| Param | Original file | Final file |
|---|---|---|
| Filename | modeM0/AS1C09_011T06_9000006484_52923cztM0_level2.fits | modeM0/AS1C09_011T06_9000006484_52923cztM0_level2_quad_clean.evt |
| Size (bytes) | 1,040,348,160 | 81,011,520 |
| Size | 992.2 MB | 77.3 MB |
| Events in quadrant A | 19,312,650 | 14,543 |
| Events in quadrant B | 3,921,598 | 749,062 |
| Events in quadrant C | 6,650,298 | 587,494 |
| Events in quadrant D | 8,047,328 | 581,554 |
| Mode M0 | |||
|---|---|---|---|
| Quadrant | BADHDUFLAG | Total packets | Discarded packets |
| A | 0 | 62600 | 0 |
| B | 0 | 16872 | 0 |
| C | 0 | 25194 | 1 |
| D | 0 | 29226 | 0 |
| Mode SS | |||
|---|---|---|---|
| Quadrant | BADHDUFLAG | Total packets | Discarded packets |
| A | 0 | 148 | 0 |
| B | 0 | 148 | 0 |
| C | 0 | 148 | 0 |
| D | 0 | 148 | 0 |
| Quadrant | Total seconds | Saturated seconds | Saturation percentage |
|---|---|---|---|
| A | 7475 | 7358 | 98.434783% |
| B | 7476 | 71 | 0.949706% |
| C | 7475 | 1082 | 14.474916% |
| D | 7475 | 929 | 12.428094% |
Noise dominated data is calculated using 1-second bins in cleaned event files. If a bin has >2000 counts, and if more than 50% of those come from <1% of pixels, then it is considered to be noise-dominated and hence unusable.
| Quadrant | # 1 sec bins | Bins with >0 counts | Bins with >2000 counts | High rate bins dominated by noise | Noise dominated (total time) | Noise dominated (detector-on time) | Marked lightcurve |
|---|---|---|---|---|---|---|---|
| A | 7475 | 7475 | 6931 | 6931 | 92.72% | 92.72% | 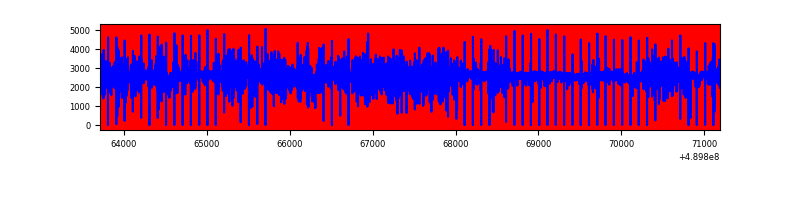 |
| B | 7476 | 7476 | 32 | 32 | 0.43% | 0.43% | 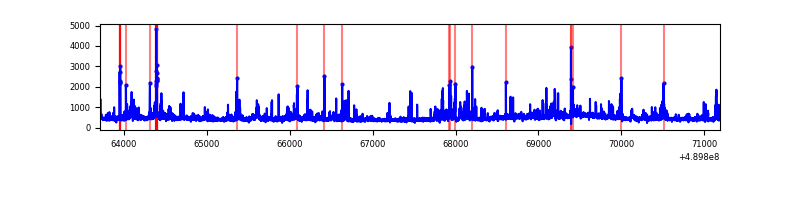 |
| C | 7475 | 7475 | 786 | 786 | 10.52% | 10.52% | 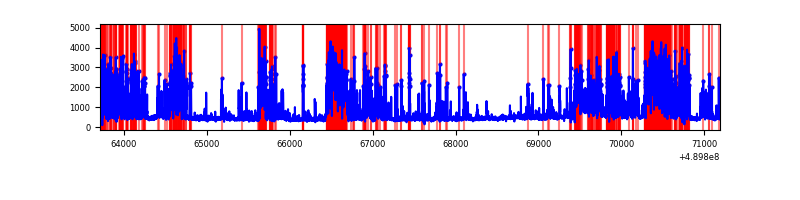 |
| D | 7475 | 7475 | 787 | 787 | 10.53% | 10.53% | 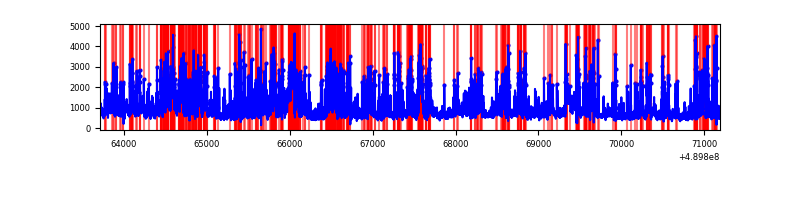 |
Top three noisy pixels from each quadrant. If the there are fewer than three noisy pixels in the level2.evt file, extra rows are filled as -1
| Pixel properties | Quadrant properties | ||||||
|---|---|---|---|---|---|---|---|
| Quadrant | DetID | PixID | Counts | Sigma | Mean | Median | Sigma |
| A | 9 | 191 | 17965069 | 295318.16 | 237 | 231 | 60.8 |
| A | 15 | 174 | 120041 | 1969.52 | 237 | 231 | 60.8 |
| A | 0 | 8 | 90720 | 1487.52 | 237 | 231 | 60.8 |
| B | 10 | 247 | 140549 | 844.03 | 779 | 752 | 165.6 |
| B | 10 | 191 | 121558 | 729.37 | 779 | 752 | 165.6 |
| B | 12 | 32 | 101254 | 606.78 | 779 | 752 | 165.6 |
| C | 15 | 224 | 1359136 | 6868.13 | 723 | 716 | 197.8 |
| C | 15 | 230 | 1152945 | 5825.64 | 723 | 716 | 197.8 |
| C | 13 | 3 | 479026 | 2418.32 | 723 | 716 | 197.8 |
| D | 8 | 176 | 1589576 | 7384.32 | 742 | 705 | 215.2 |
| D | 15 | 78 | 891116 | 4138.21 | 742 | 705 | 215.2 |
| D | 15 | 125 | 704250 | 3269.74 | 742 | 705 | 215.2 |
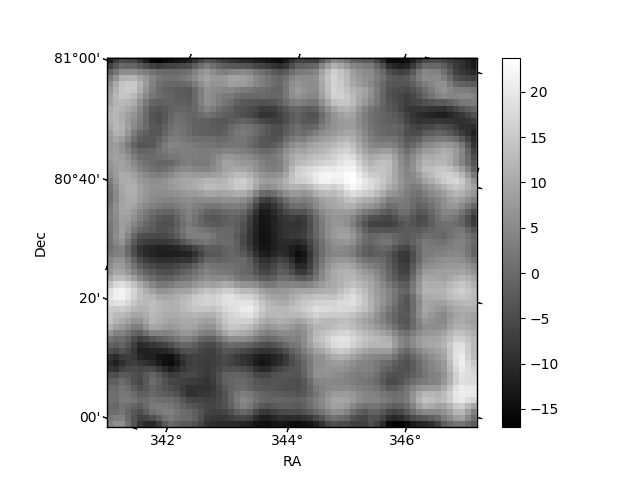
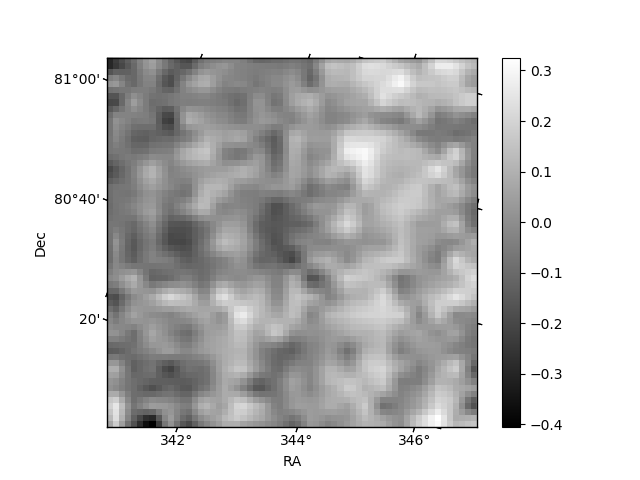
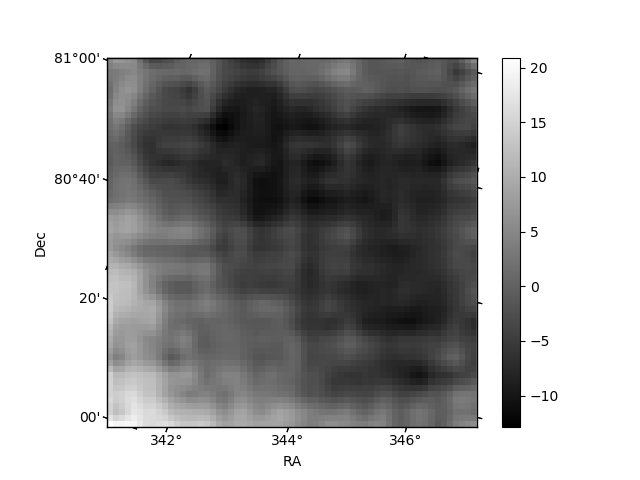
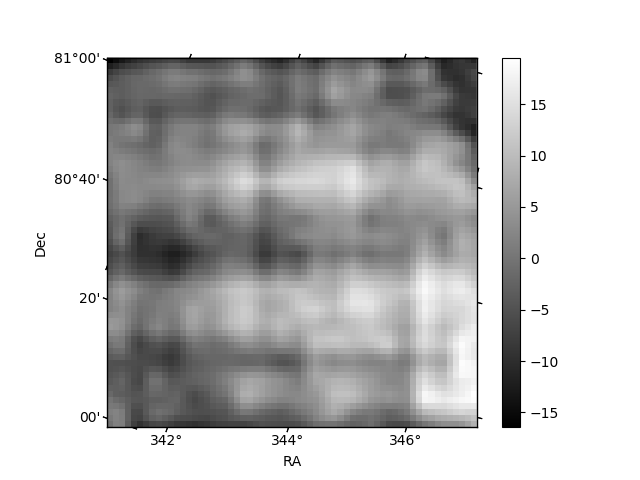
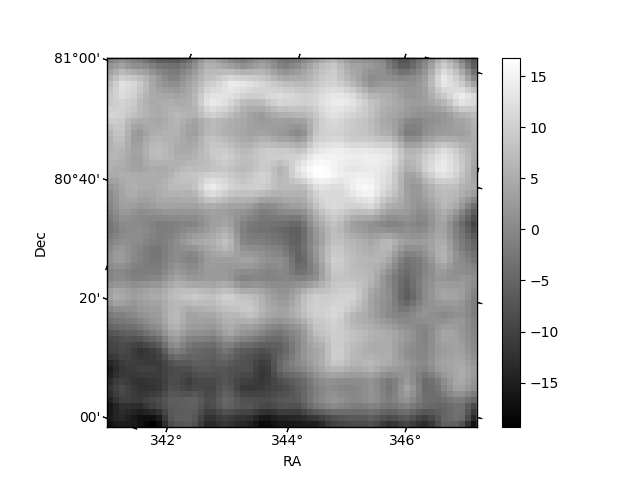
Histogram calculated using DETX and DETY for each event in the final _common_clean file
| Quadrant A | 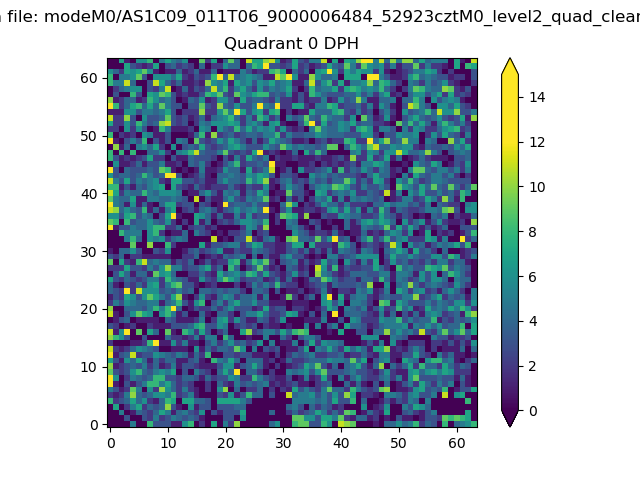 |
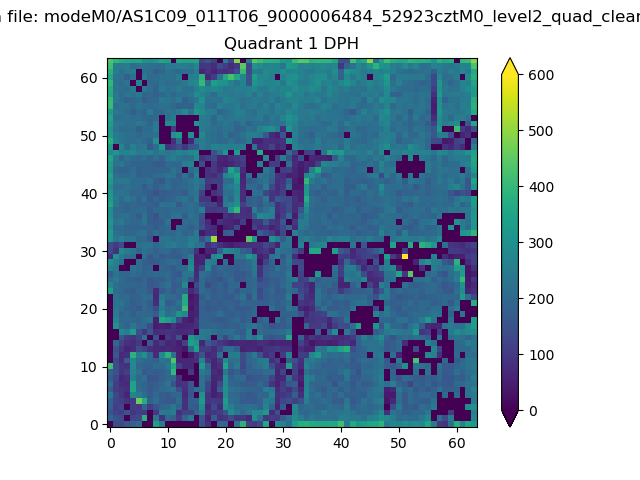 |
Quadrant B |
|---|---|---|---|
| Quadrant D | 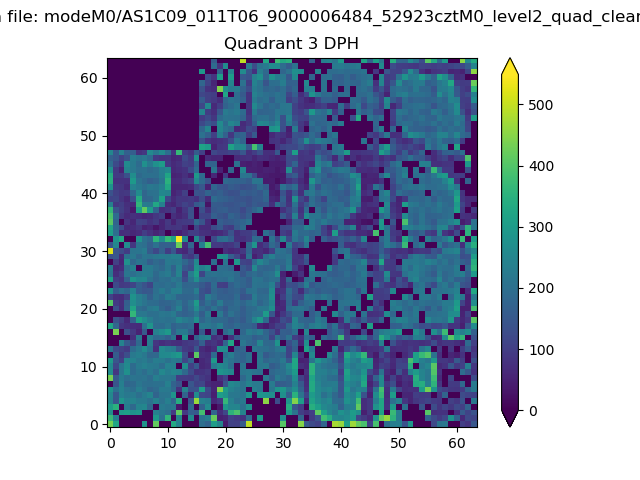 |
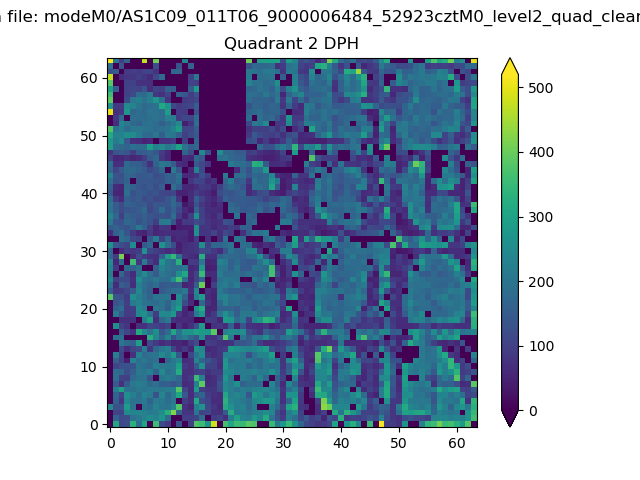 |
Quadrant C |
| Plot type | Count rate plots | Images |
|---|---|---|
| Comparison with Poisson distribution Blue bars denote a histogram of data divided into 1 sec bins. Red curve is a Poisson curve with rate = median count rate of data. |
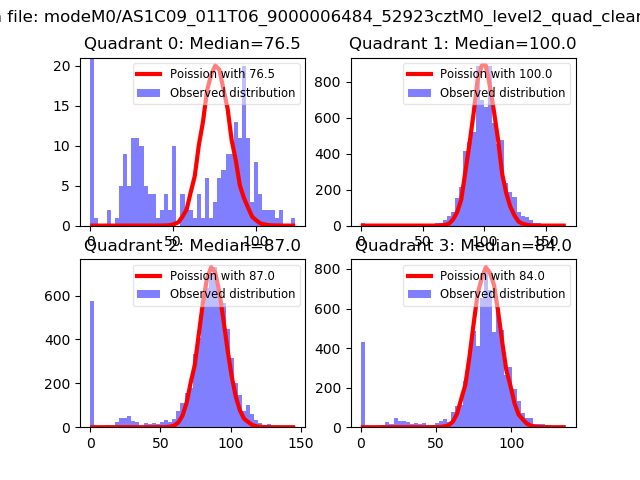 |
 |
| Quadrant-wise count rates Data is divided into 100 sec bins |
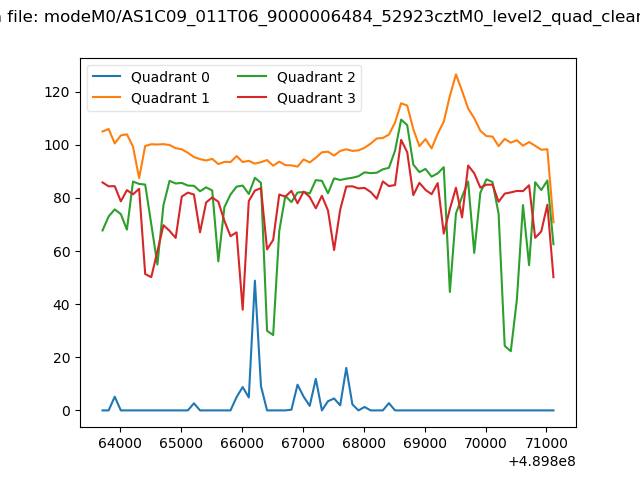 |
|
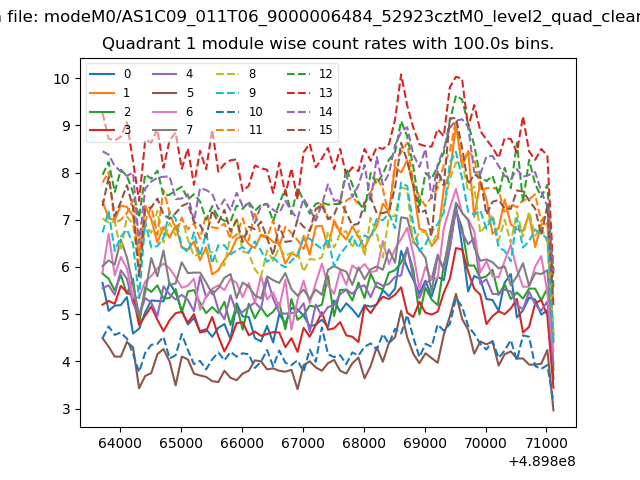
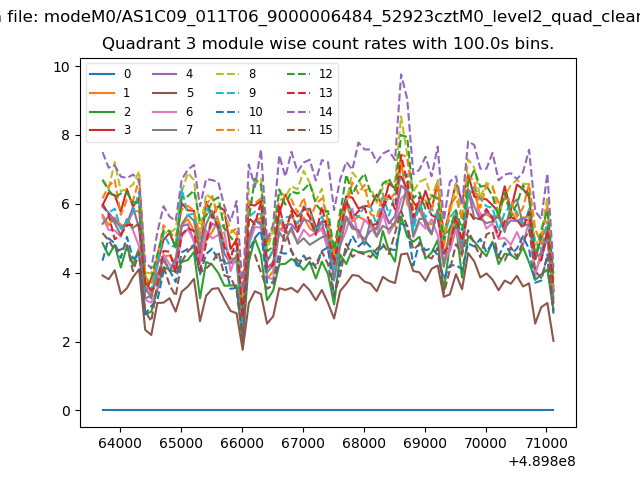
| Module-wise count rates for Quadrant A Data is divided into 100 sec bins |
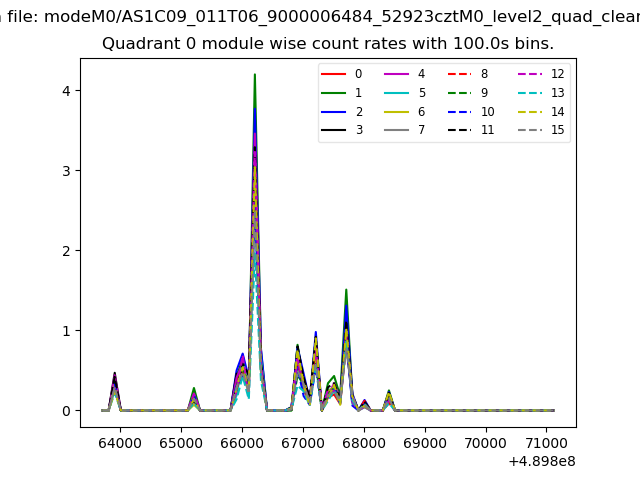 |
 |
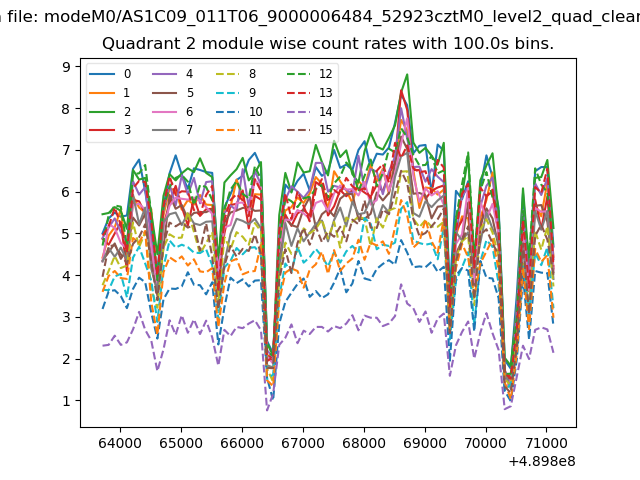
| Module-wise count rates for Quadrant B Data is divided into 100 sec bins |
 |
 |
| Module-wise count rates for Quadrant C Data is divided into 100 sec bins |
 |
 |
| Module-wise count rates for Quadrant D Data is divided into 100 sec bins |
 |
 |
| Parameter | Plot |
|---|---|
| CZT HV Monitor | 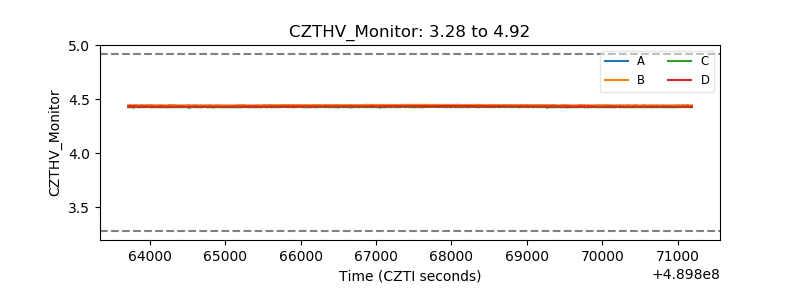 |
| D_VDD | 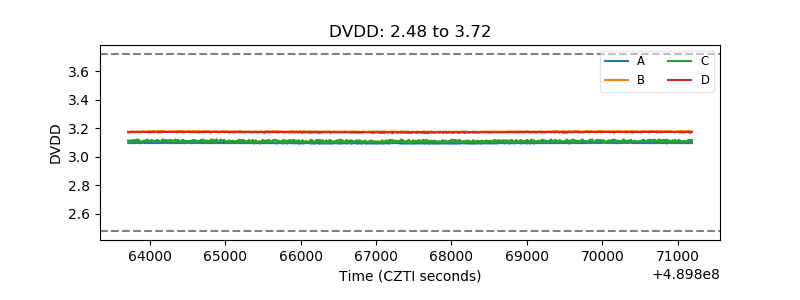 |
| Temperature 1 | 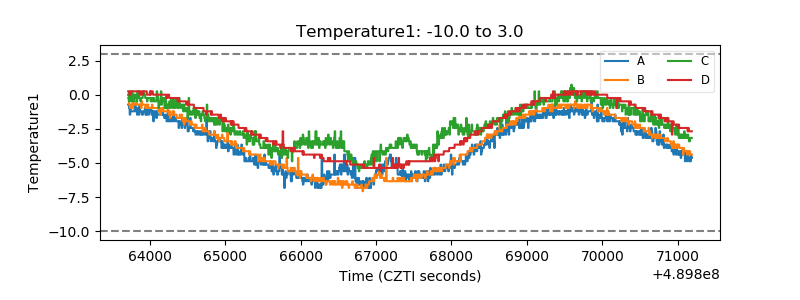 |
| Veto HV Monitor | 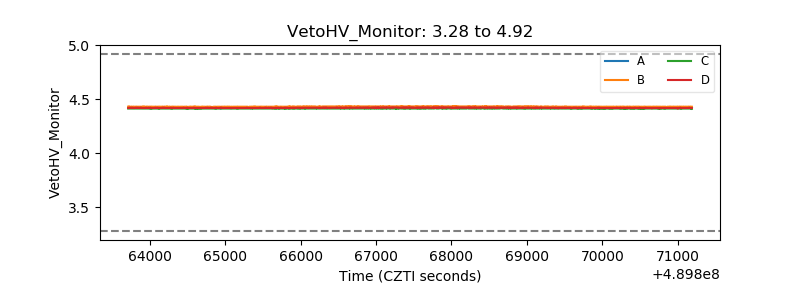 |
| Veto LLD | 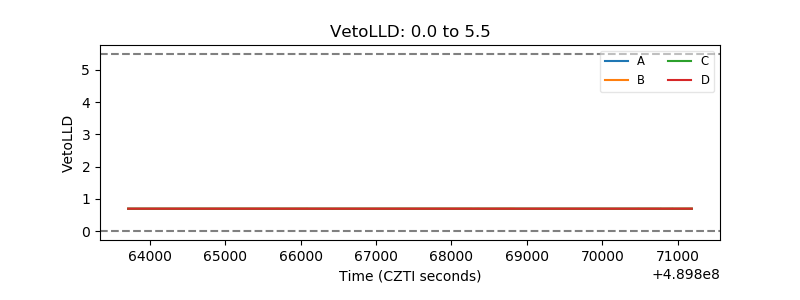 |
| Alpha Counter | 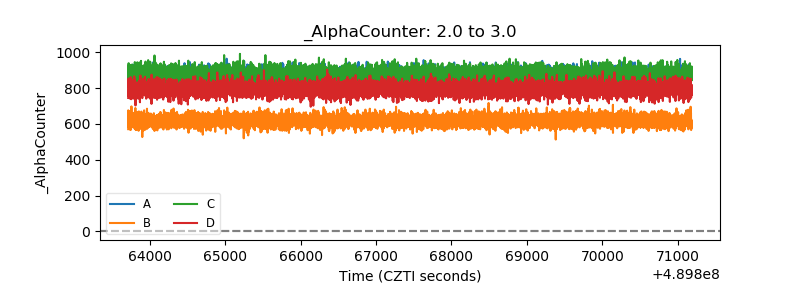 |
| _CPM_Rate | 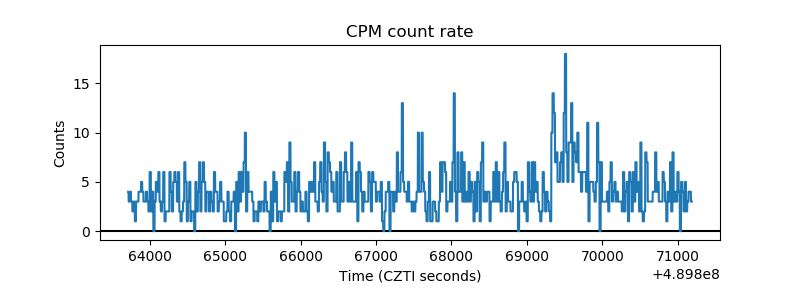 |
| CZT Counter | 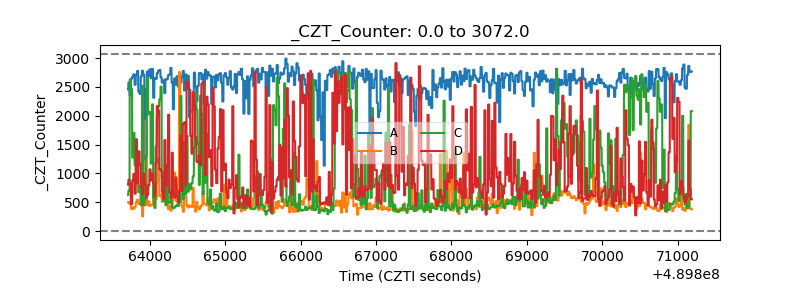 |
| +2.5 Volts monitor |  |
| +5 Volts monitor |  |
| _ROLL_ROT | 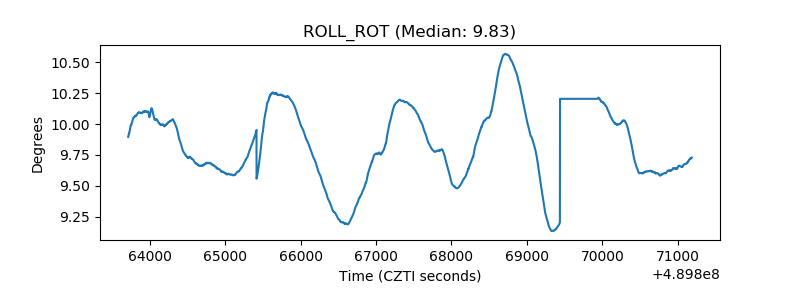 |
| _Roll_DEC | 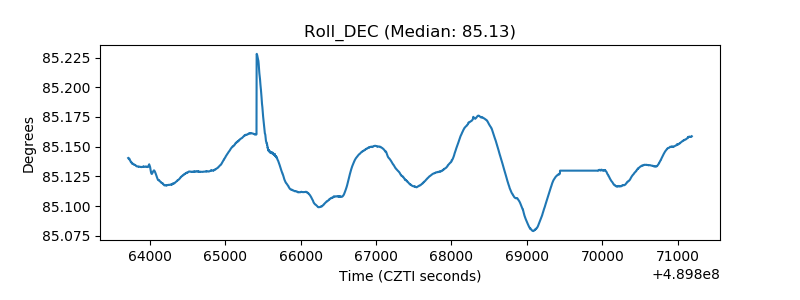 |
| _Roll_RA | 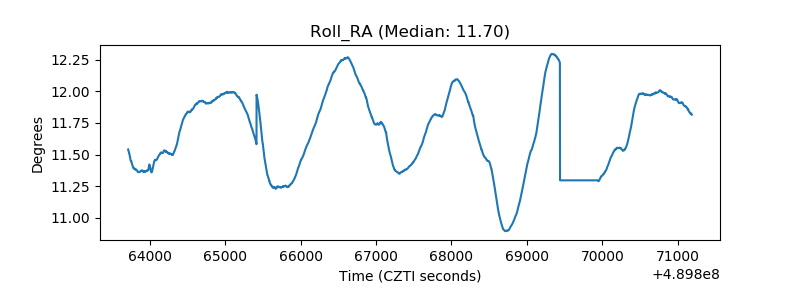 |
| Veto Counter | 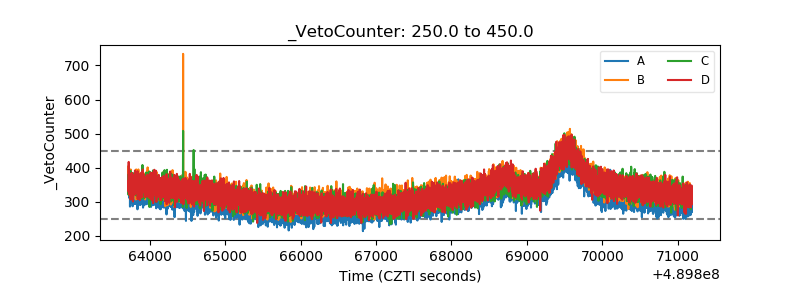 |