| Param | Original file | Final file |
|---|---|---|
| Filename | modeM0/AS1C09_011T06_9000006484_52924cztM0_level2.fits | modeM0/AS1C09_011T06_9000006484_52924cztM0_level2_quad_clean.evt |
| Size (bytes) | 1,027,837,440 | 84,674,880 |
| Size | 980.2 MB | 80.8 MB |
| Events in quadrant A | 19,264,813 | 48,997 |
| Events in quadrant B | 4,094,396 | 764,376 |
| Events in quadrant C | 6,500,640 | 624,318 |
| Events in quadrant D | 7,596,347 | 594,765 |
| Mode M0 | |||
|---|---|---|---|
| Quadrant | BADHDUFLAG | Total packets | Discarded packets |
| A | 0 | 62549 | 0 |
| B | 0 | 17561 | 0 |
| C | 0 | 24623 | 0 |
| D | 0 | 27911 | 0 |
| Mode SS | |||
|---|---|---|---|
| Quadrant | BADHDUFLAG | Total packets | Discarded packets |
| A | 0 | 152 | 0 |
| B | 0 | 152 | 0 |
| C | 0 | 152 | 0 |
| D | 0 | 152 | 0 |
| Quadrant | Total seconds | Saturated seconds | Saturation percentage |
|---|---|---|---|
| A | 7636 | 7206 | 94.368779% |
| B | 7636 | 94 | 1.231011% |
| C | 7636 | 811 | 10.620744% |
| D | 7636 | 896 | 11.733892% |
Noise dominated data is calculated using 1-second bins in cleaned event files. If a bin has >2000 counts, and if more than 50% of those come from <1% of pixels, then it is considered to be noise-dominated and hence unusable.
| Quadrant | # 1 sec bins | Bins with >0 counts | Bins with >2000 counts | High rate bins dominated by noise | Noise dominated (total time) | Noise dominated (detector-on time) | Marked lightcurve |
|---|---|---|---|---|---|---|---|
| A | 7636 | 7635 | 6716 | 6716 | 87.95% | 87.96% | 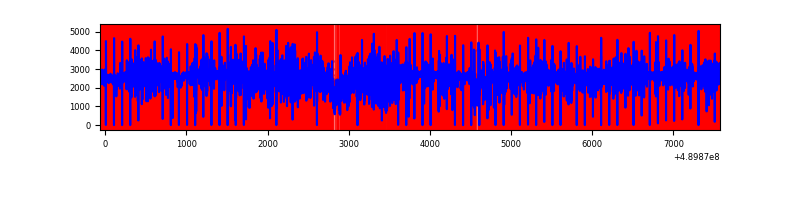 |
| B | 7636 | 7636 | 59 | 59 | 0.77% | 0.77% | 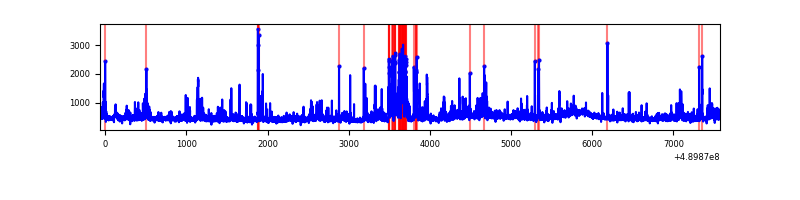 |
| C | 7636 | 7636 | 599 | 599 | 7.84% | 7.84% | 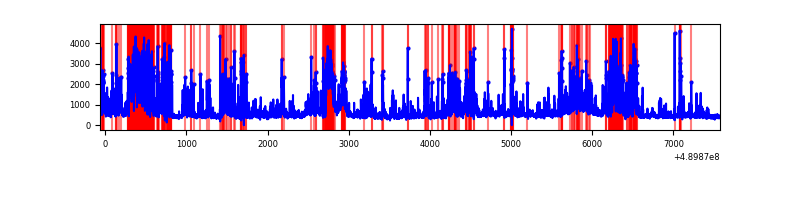 |
| D | 7636 | 7634 | 757 | 757 | 9.91% | 9.92% | 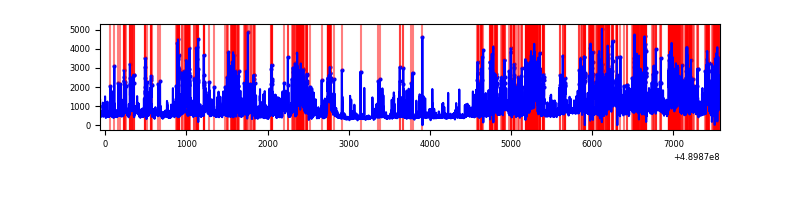 |
Top three noisy pixels from each quadrant. If the there are fewer than three noisy pixels in the level2.evt file, extra rows are filled as -1
| Pixel properties | Quadrant properties | ||||||
|---|---|---|---|---|---|---|---|
| Quadrant | DetID | PixID | Counts | Sigma | Mean | Median | Sigma |
| A | 9 | 191 | 17457914 | 240810.92 | 284 | 277 | 72.5 |
| A | 15 | 174 | 317358 | 4373.82 | 284 | 277 | 72.5 |
| A | 0 | 8 | 153076 | 2107.71 | 284 | 277 | 72.5 |
| B | 10 | 191 | 331543 | 1939.8 | 799 | 771 | 170.5 |
| B | 10 | 254 | 144050 | 840.25 | 799 | 771 | 170.5 |
| B | 1 | 255 | 79255 | 460.27 | 799 | 771 | 170.5 |
| C | 15 | 230 | 1257240 | 6109.97 | 754 | 746 | 205.6 |
| C | 15 | 224 | 1026059 | 4985.81 | 754 | 746 | 205.6 |
| C | 13 | 3 | 452732 | 2197.88 | 754 | 746 | 205.6 |
| D | 8 | 176 | 1796761 | 8401.11 | 750 | 718 | 213.8 |
| D | 8 | 48 | 639239 | 2986.72 | 750 | 718 | 213.8 |
| D | 3 | 12 | 492771 | 2301.61 | 750 | 718 | 213.8 |
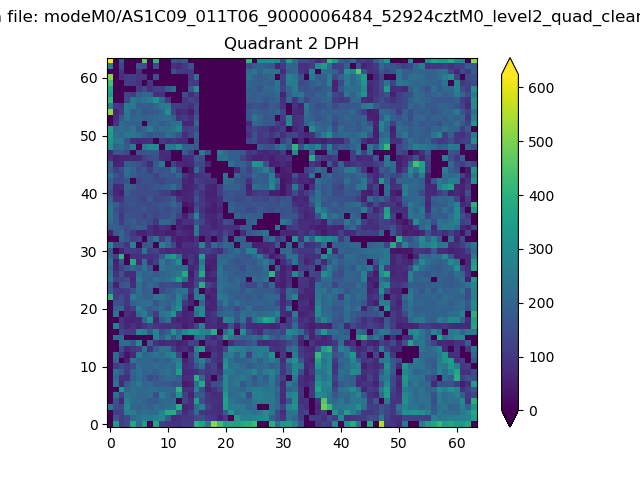
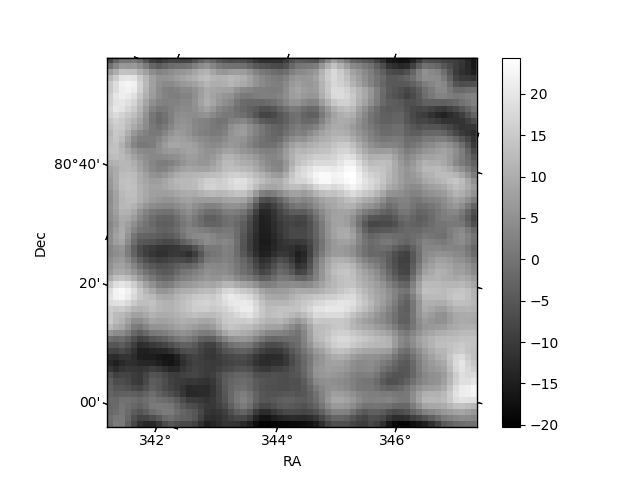
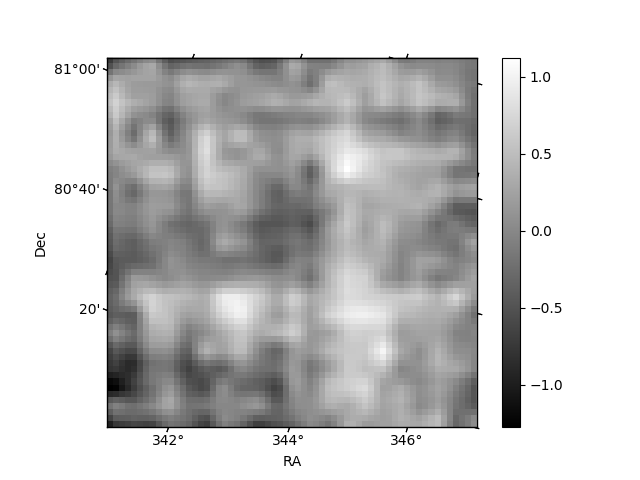
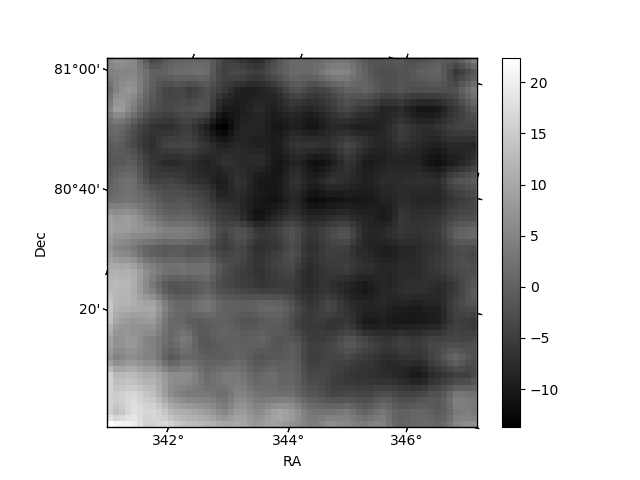
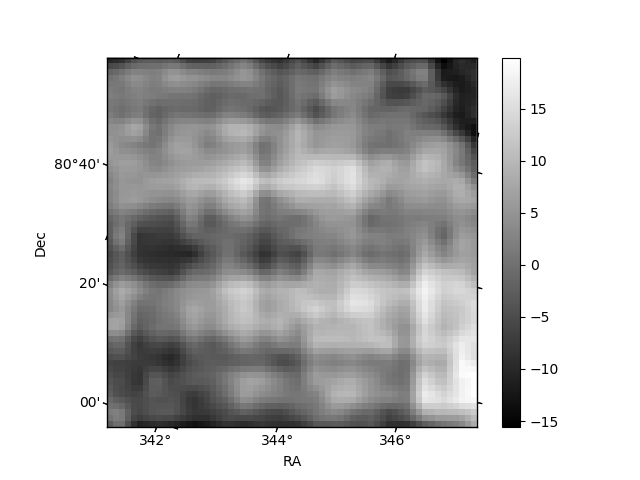
Histogram calculated using DETX and DETY for each event in the final _common_clean file
| Quadrant A | 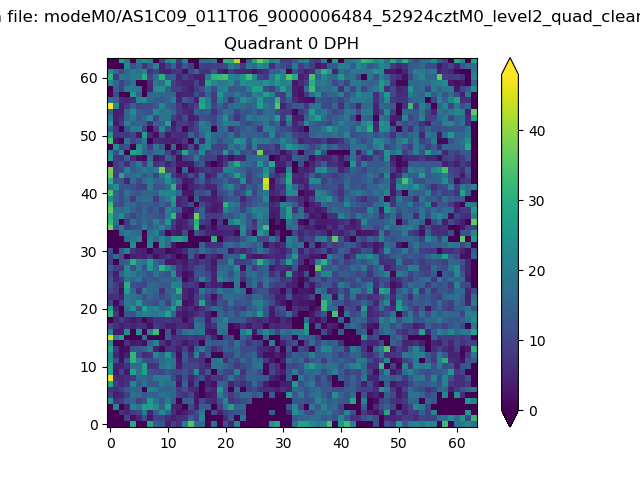 |
 |
Quadrant B |
|---|---|---|---|
| Quadrant D | 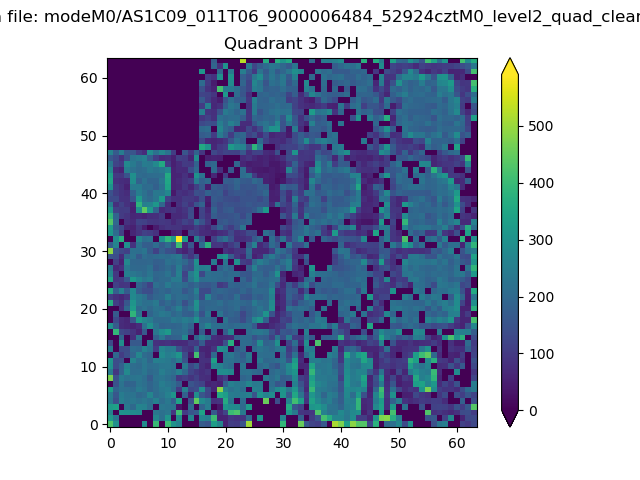 |
 |
Quadrant C |
| Plot type | Count rate plots | Images |
|---|---|---|
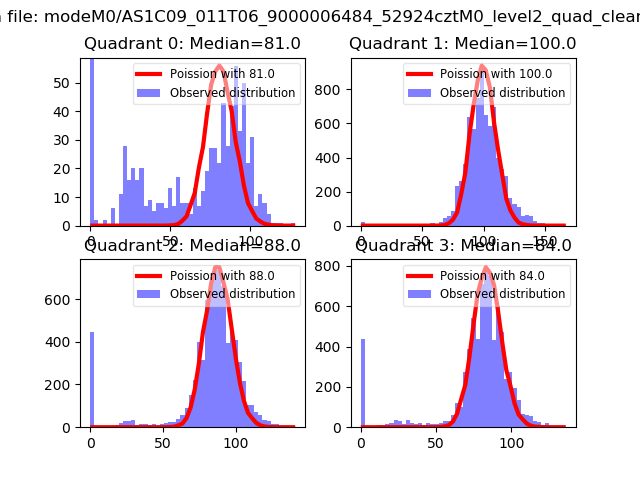
| Comparison with Poisson distribution Blue bars denote a histogram of data divided into 1 sec bins. Red curve is a Poisson curve with rate = median count rate of data. |
 |
 |
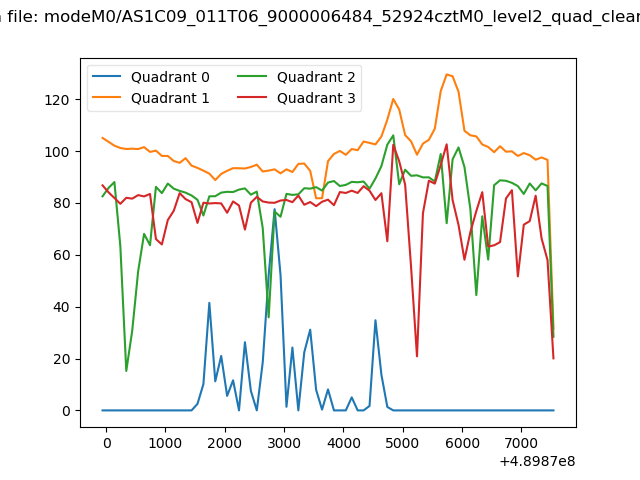
| Quadrant-wise count rates Data is divided into 100 sec bins |
 |
|
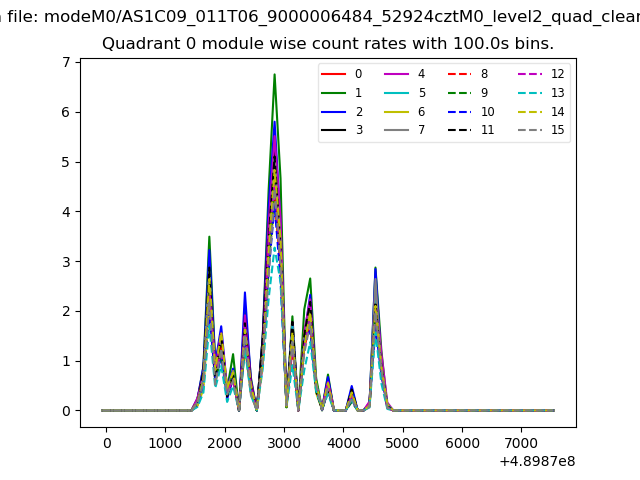
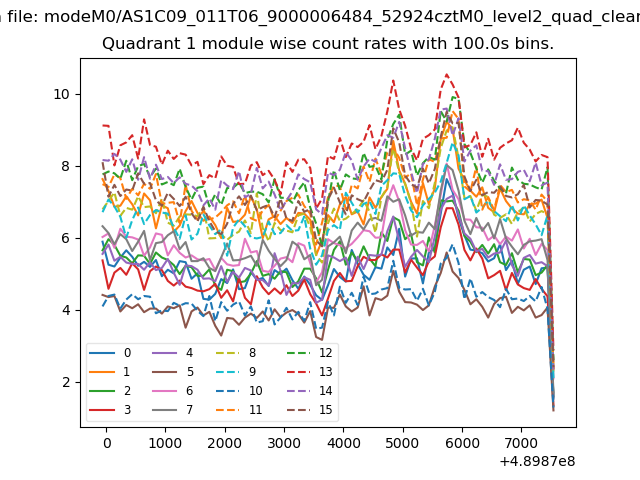
| Module-wise count rates for Quadrant A Data is divided into 100 sec bins |
 |
 |
| Module-wise count rates for Quadrant B Data is divided into 100 sec bins |
 |
 |
| Module-wise count rates for Quadrant C Data is divided into 100 sec bins |
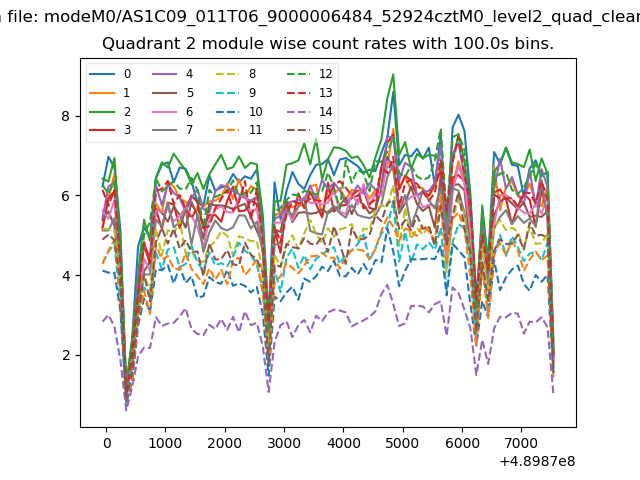 |
 |
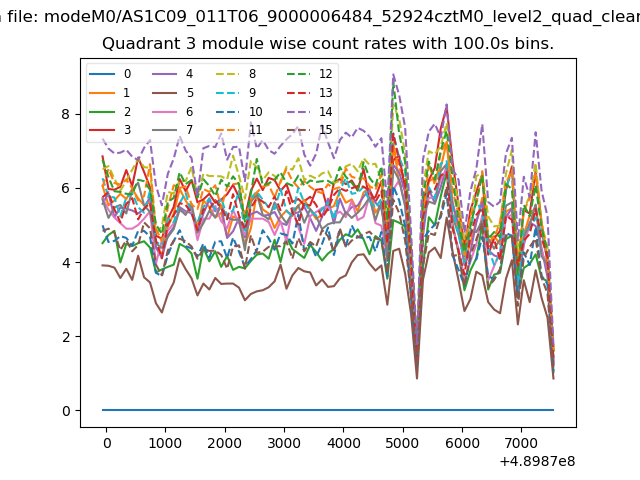
| Module-wise count rates for Quadrant D Data is divided into 100 sec bins |
 |
 |
| Parameter | Plot |
|---|---|
| CZT HV Monitor | 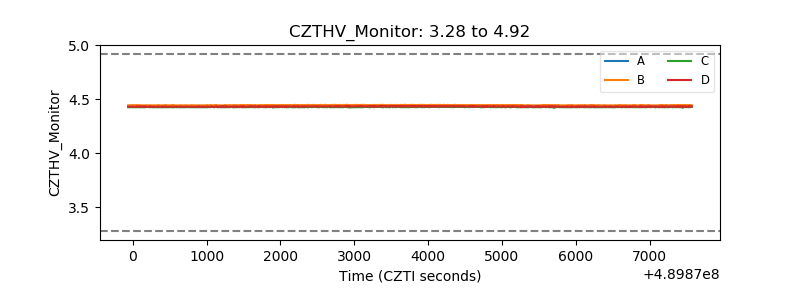 |
| D_VDD | 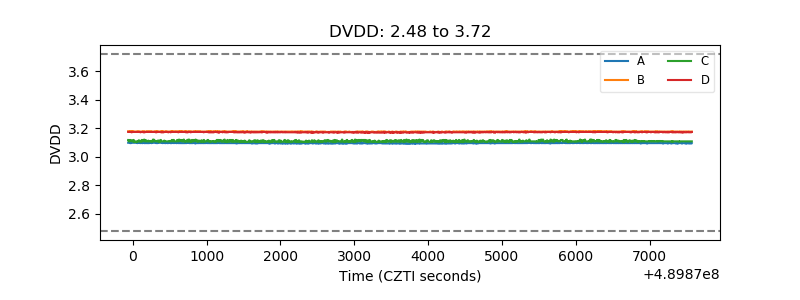 |
| Temperature 1 | 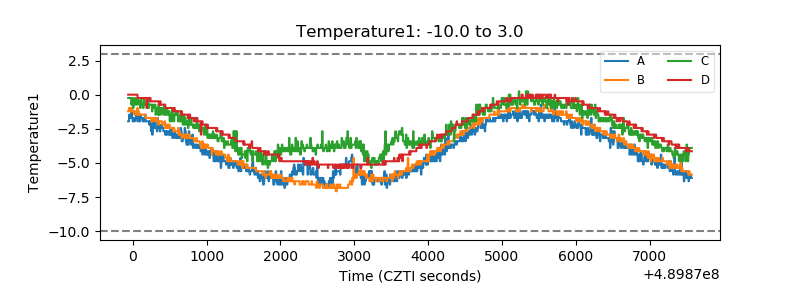 |
| Veto HV Monitor | 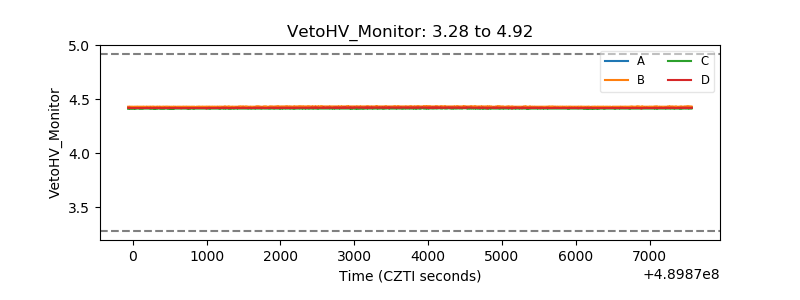 |
| Veto LLD | 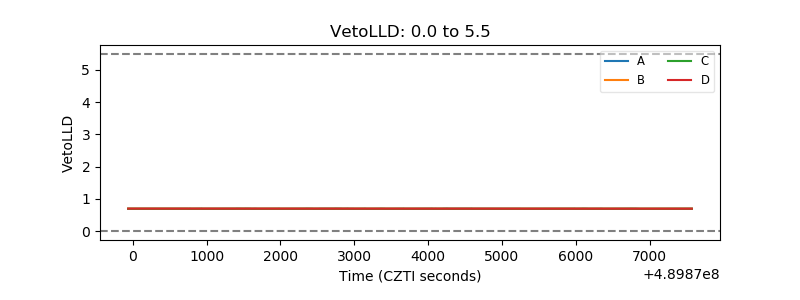 |
| Alpha Counter | 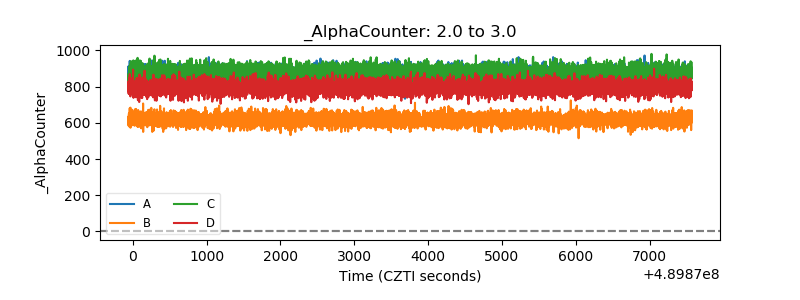 |
| _CPM_Rate | 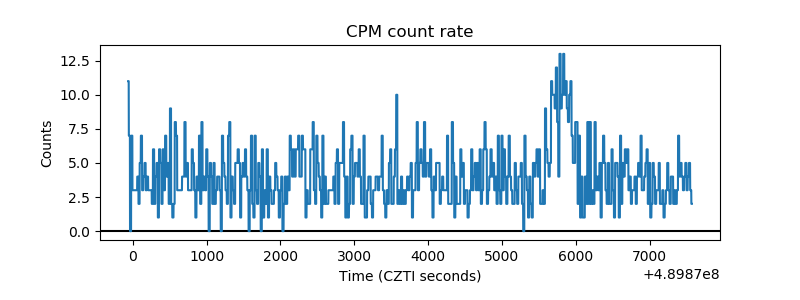 |
| CZT Counter | 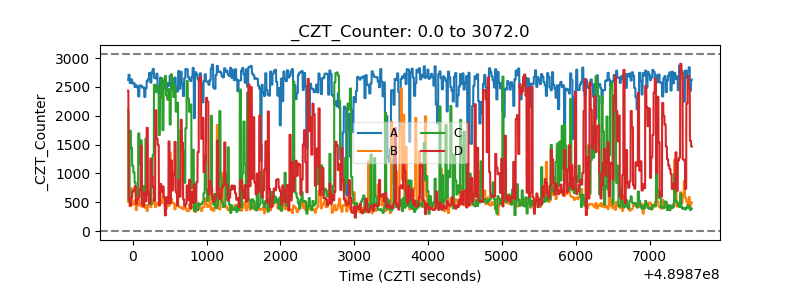 |
| +2.5 Volts monitor | 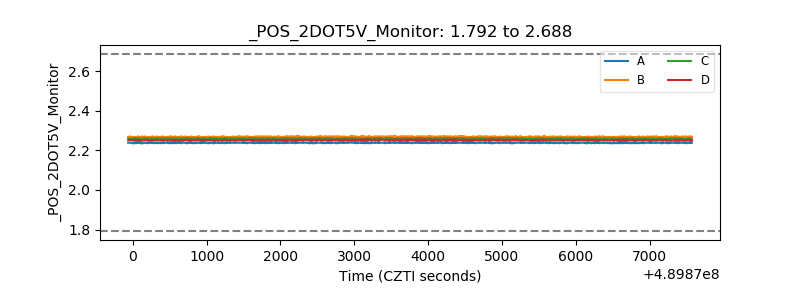 |
| +5 Volts monitor | 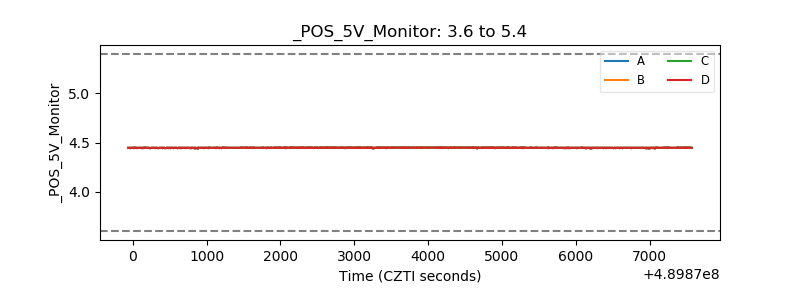 |
| _ROLL_ROT | 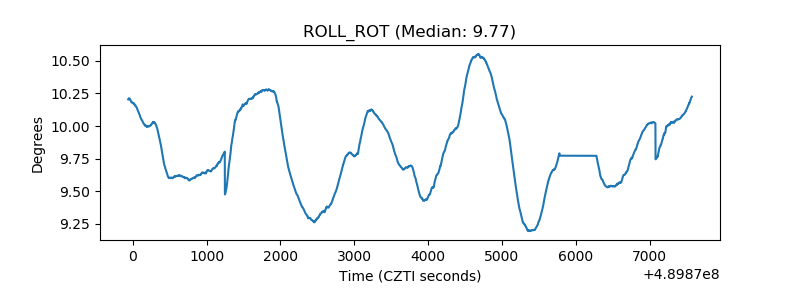 |
| _Roll_DEC | 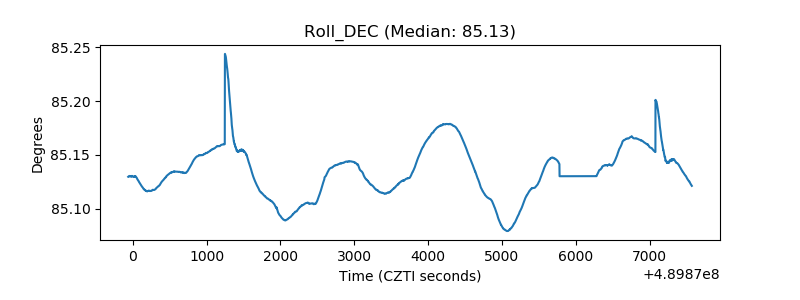 |
| _Roll_RA | 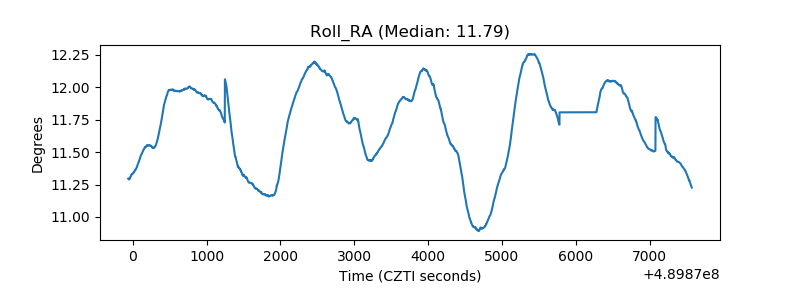 |
| Veto Counter | 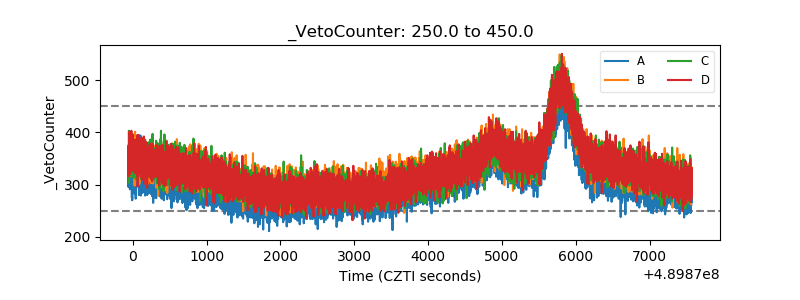 |