| Param | Original file | Final file |
|---|---|---|
| Filename | modeM0/AS1C09_011T06_9000006484_52928cztM0_level2.fits | modeM0/AS1C09_011T06_9000006484_52928cztM0_level2_quad_clean.evt |
| Size (bytes) | 904,282,560 | 76,858,560 |
| Size | 862.4 MB | 73.3 MB |
| Events in quadrant A | 17,824,858 | 12,170 |
| Events in quadrant B | 3,435,448 | 692,565 |
| Events in quadrant C | 4,776,033 | 591,378 |
| Events in quadrant D | 6,893,918 | 543,178 |
| Mode M9 | |||
|---|---|---|---|
| Quadrant | BADHDUFLAG | Total packets | Discarded packets |
| A | 0 | 8 | 0 |
| B | 0 | 8 | 0 |
| C | 0 | 8 | 0 |
| D | 0 | 8 | 0 |
| Mode M0 | |||
|---|---|---|---|
| Quadrant | BADHDUFLAG | Total packets | Discarded packets |
| A | 0 | 57764 | 3 |
| B | 0 | 15306 | 2 |
| C | 0 | 19264 | 2 |
| D | 0 | 25569 | 2 |
| Mode SS | |||
|---|---|---|---|
| Quadrant | BADHDUFLAG | Total packets | Discarded packets |
| A | 0 | 142 | 0 |
| B | 0 | 142 | 0 |
| C | 0 | 142 | 0 |
| D | 0 | 142 | 0 |
| Quadrant | Total seconds | Saturated seconds | Saturation percentage |
|---|---|---|---|
| A | 7002 | 6905 | 98.614682% |
| B | 7002 | 87 | 1.242502% |
| C | 7003 | 487 | 6.954163% |
| D | 7003 | 817 | 11.666429% |
Noise dominated data is calculated using 1-second bins in cleaned event files. If a bin has >2000 counts, and if more than 50% of those come from <1% of pixels, then it is considered to be noise-dominated and hence unusable.
| Quadrant | # 1 sec bins | Bins with >0 counts | Bins with >2000 counts | High rate bins dominated by noise | Noise dominated (total time) | Noise dominated (detector-on time) | Marked lightcurve |
|---|---|---|---|---|---|---|---|
| A | 7812 | 7002 | 6342 | 6342 | 81.18% | 90.57% | 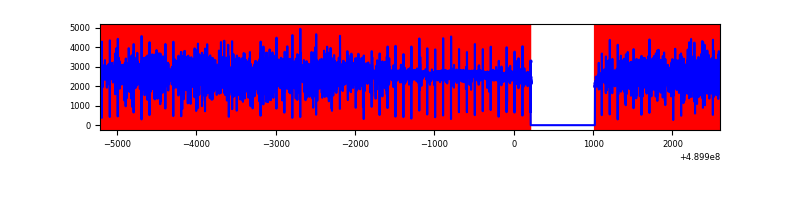 |
| B | 7812 | 7003 | 14 | 14 | 0.18% | 0.20% | 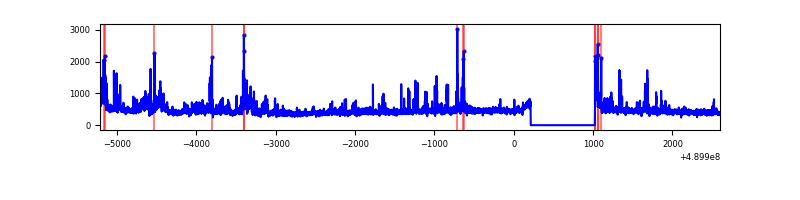 |
| C | 7813 | 7004 | 392 | 392 | 5.02% | 5.60% | 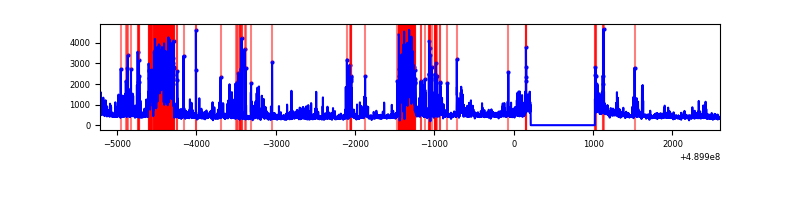 |
| D | 7813 | 7004 | 658 | 658 | 8.42% | 9.39% | 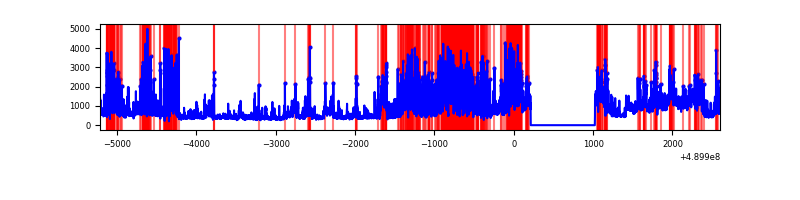 |
Top three noisy pixels from each quadrant. If the there are fewer than three noisy pixels in the level2.evt file, extra rows are filled as -1
| Pixel properties | Quadrant properties | ||||||
|---|---|---|---|---|---|---|---|
| Quadrant | DetID | PixID | Counts | Sigma | Mean | Median | Sigma |
| A | 9 | 191 | 16218227 | 244443.3 | 259 | 252 | 66.3 |
| A | 0 | 8 | 195178 | 2938.0 | 259 | 252 | 66.3 |
| A | 4 | 254 | 87609 | 1316.68 | 259 | 252 | 66.3 |
| B | 10 | 254 | 208226 | 1336.45 | 721 | 695 | 155.3 |
| B | 4 | 81 | 131276 | 840.91 | 721 | 695 | 155.3 |
| B | 0 | 182 | 36298 | 229.28 | 721 | 695 | 155.3 |
| C | 7 | 80 | 648617 | 3455.76 | 685 | 677 | 187.5 |
| C | 2 | 12 | 463190 | 2466.8 | 685 | 677 | 187.5 |
| C | 14 | 254 | 374232 | 1992.34 | 685 | 677 | 187.5 |
| D | 8 | 176 | 1789584 | 9179.14 | 675 | 643 | 194.9 |
| D | 15 | 78 | 752289 | 3856.73 | 675 | 643 | 194.9 |
| D | 10 | 172 | 606718 | 3109.8 | 675 | 643 | 194.9 |
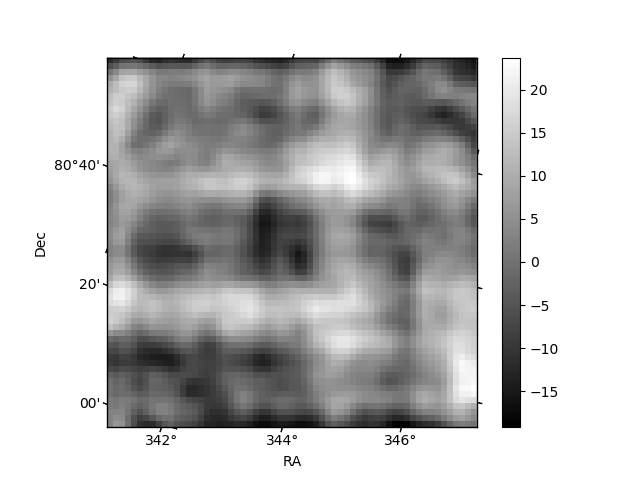
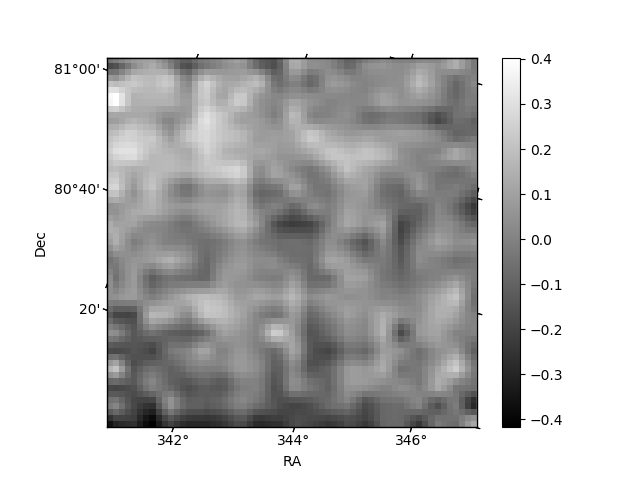
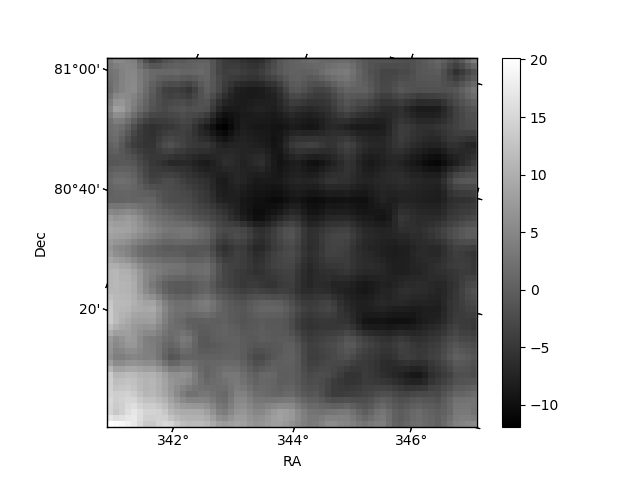
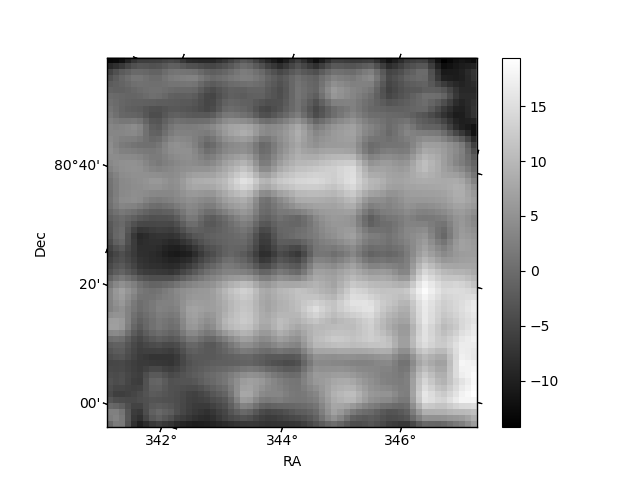
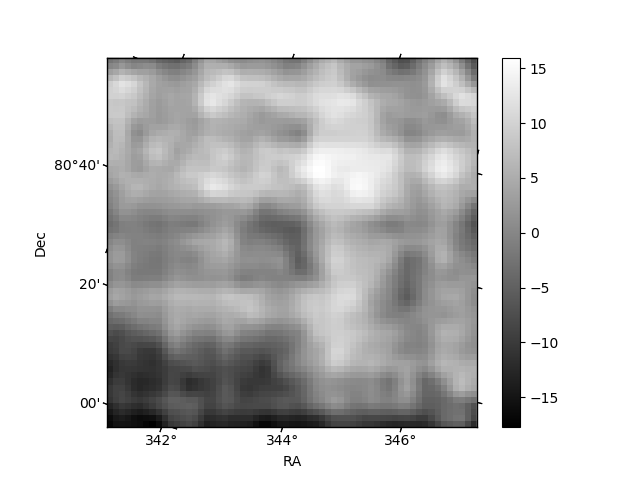
Histogram calculated using DETX and DETY for each event in the final _common_clean file
| Quadrant A | 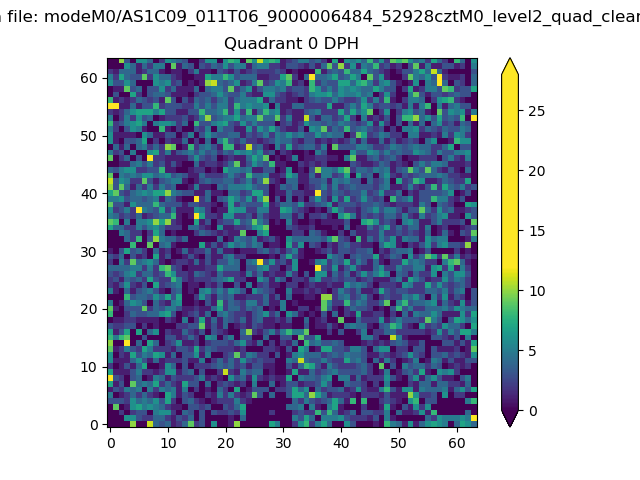 |
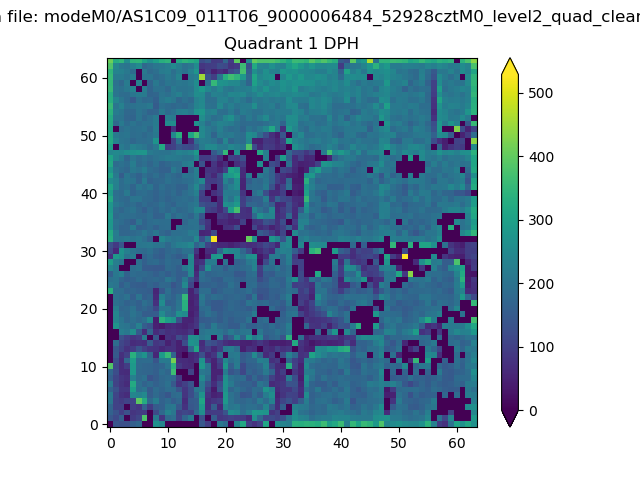 |
Quadrant B |
|---|---|---|---|
| Quadrant D | 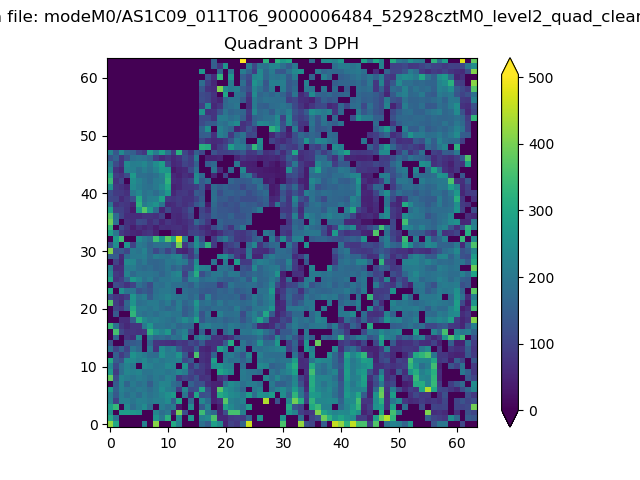 |
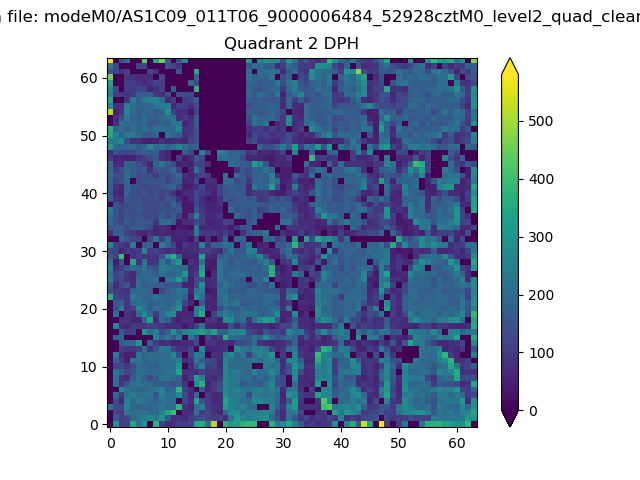 |
Quadrant C |
| Plot type | Count rate plots | Images |
|---|---|---|
| Comparison with Poisson distribution Blue bars denote a histogram of data divided into 1 sec bins. Red curve is a Poisson curve with rate = median count rate of data. |
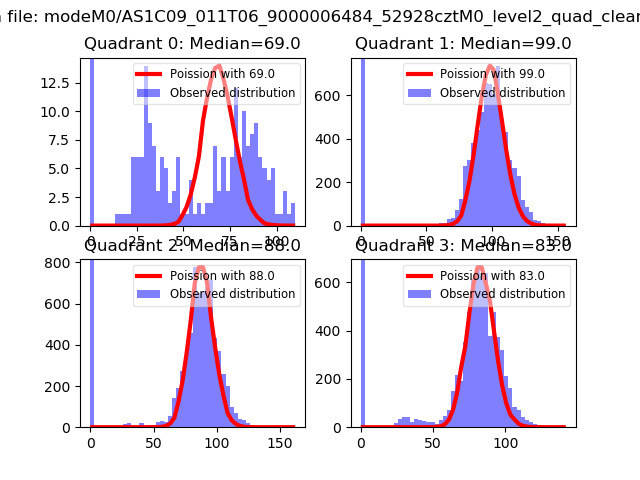 |
 |
| Quadrant-wise count rates Data is divided into 100 sec bins |
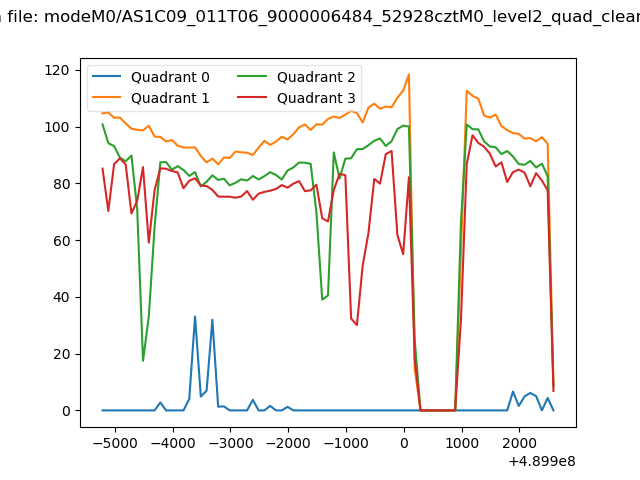 |
|
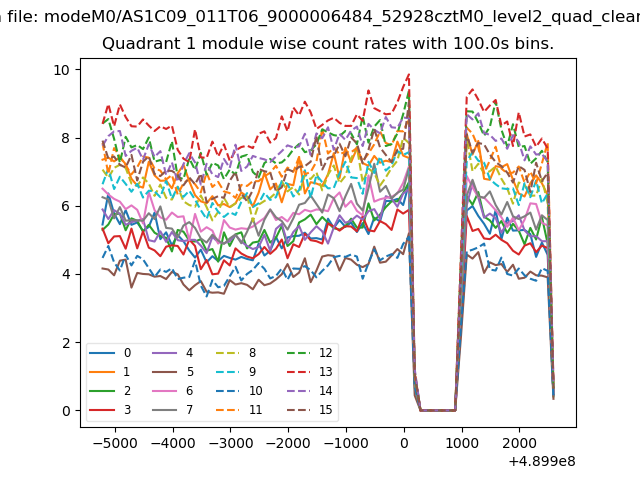
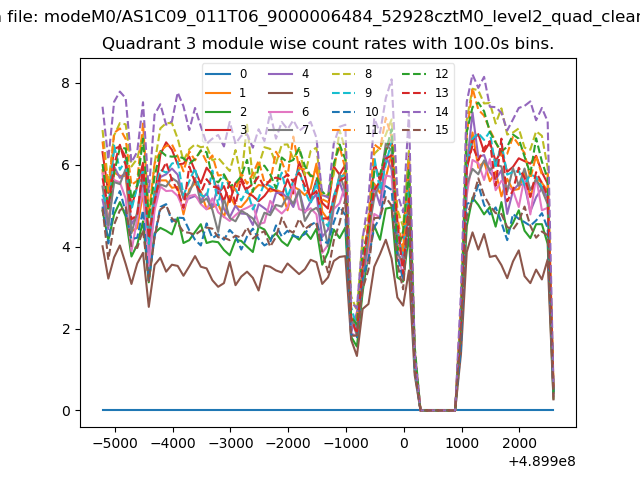
| Module-wise count rates for Quadrant A Data is divided into 100 sec bins |
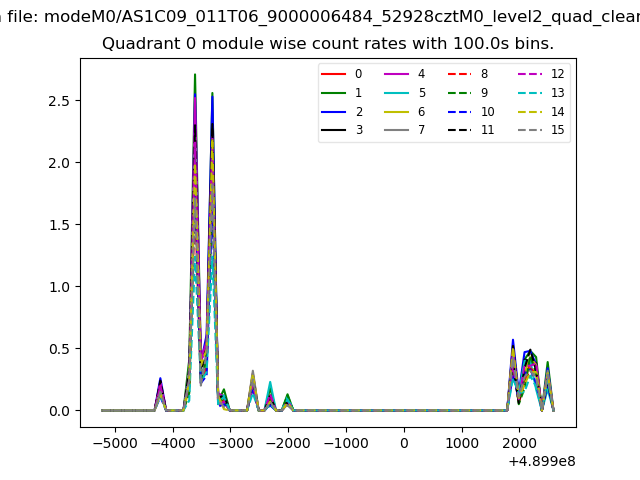 |
 |
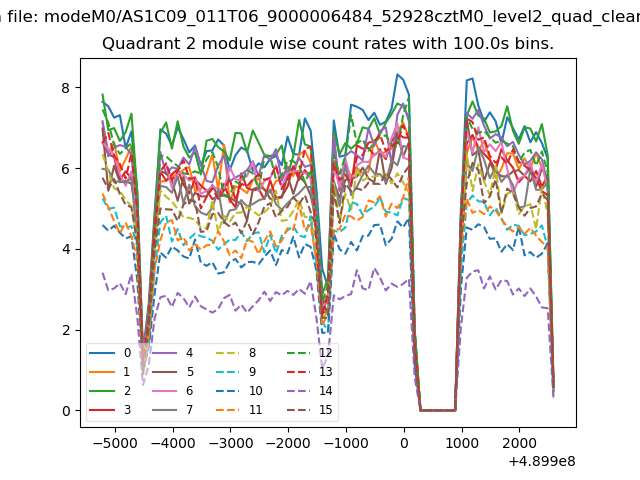
| Module-wise count rates for Quadrant B Data is divided into 100 sec bins |
 |
 |
| Module-wise count rates for Quadrant C Data is divided into 100 sec bins |
 |
 |
| Module-wise count rates for Quadrant D Data is divided into 100 sec bins |
 |
 |
| Parameter | Plot |
|---|---|
| CZT HV Monitor | 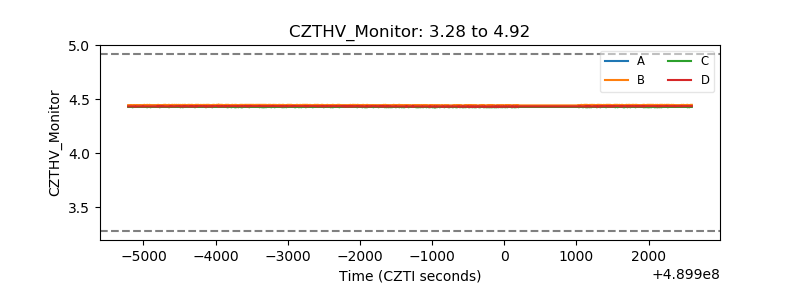 |
| D_VDD | 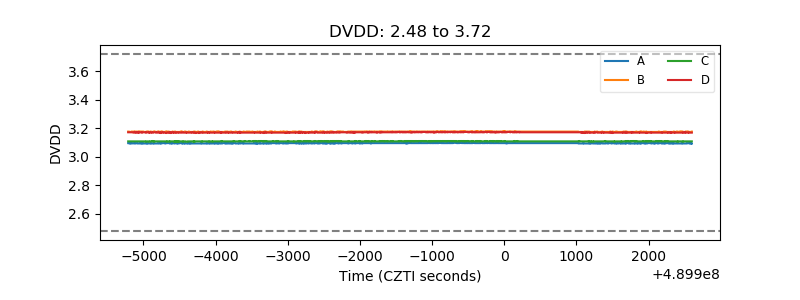 |
| Temperature 1 | 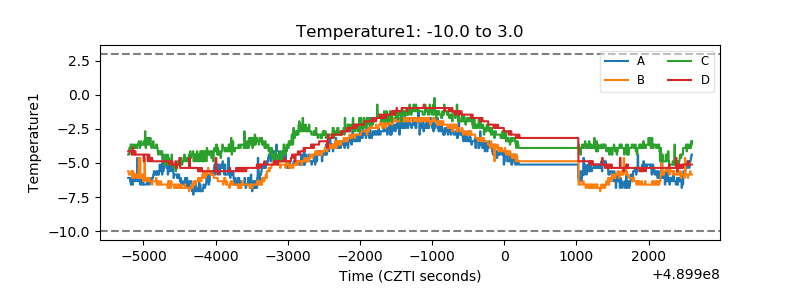 |
| Veto HV Monitor | 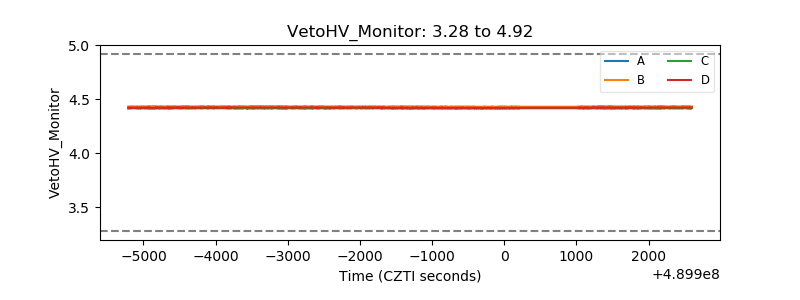 |
| Veto LLD | 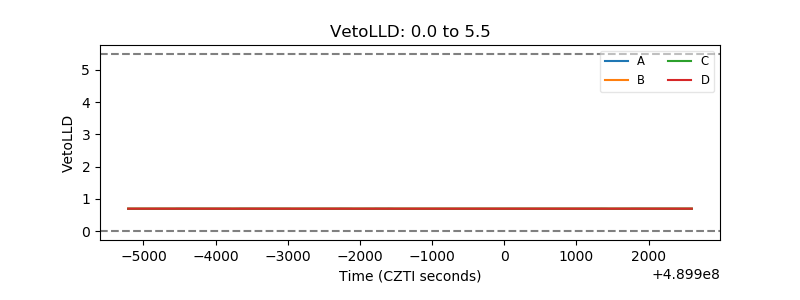 |
| Alpha Counter | 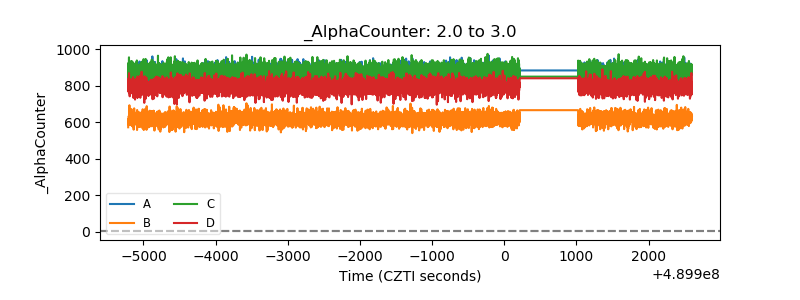 |
| _CPM_Rate | 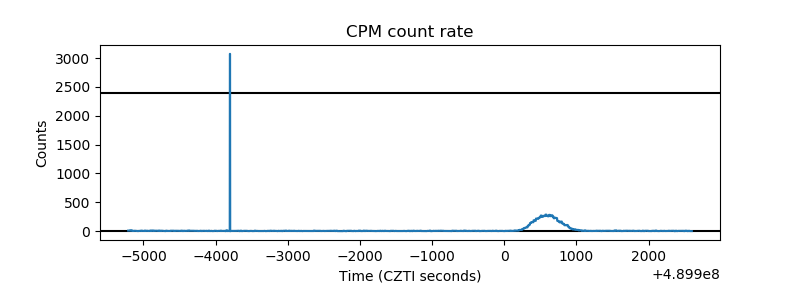 |
| CZT Counter | 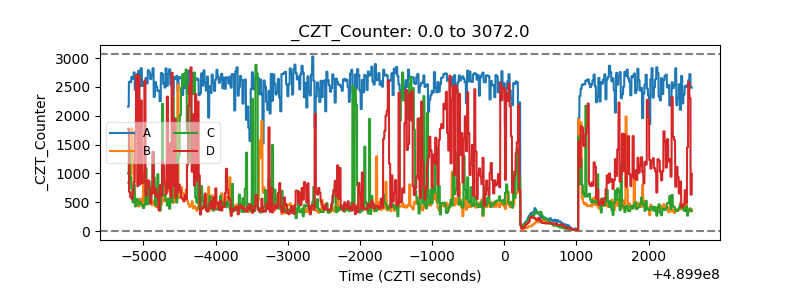 |
| +2.5 Volts monitor |  |
| +5 Volts monitor |  |
| _ROLL_ROT | 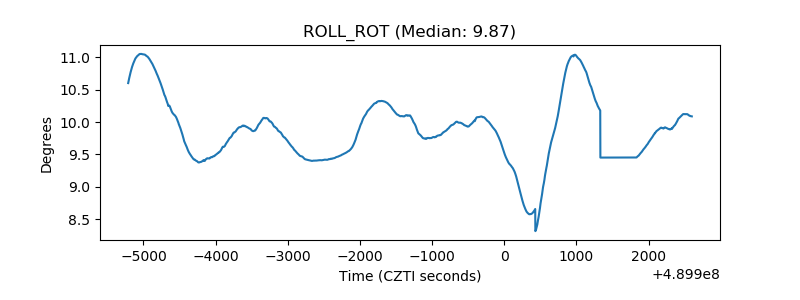 |
| _Roll_DEC | 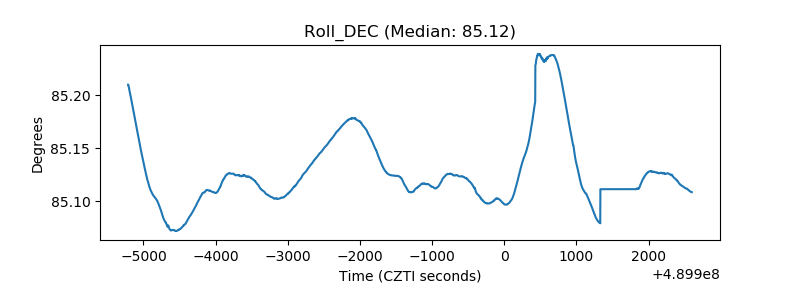 |
| _Roll_RA | 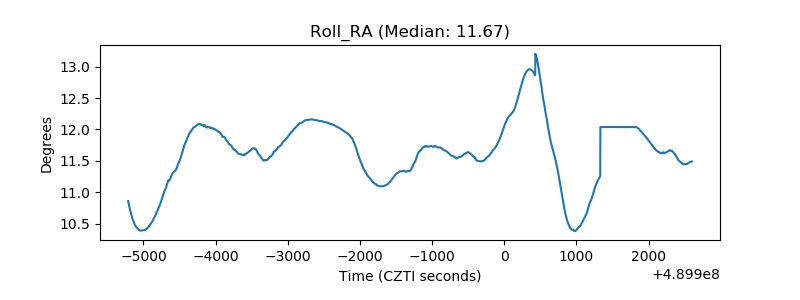 |
| Veto Counter | 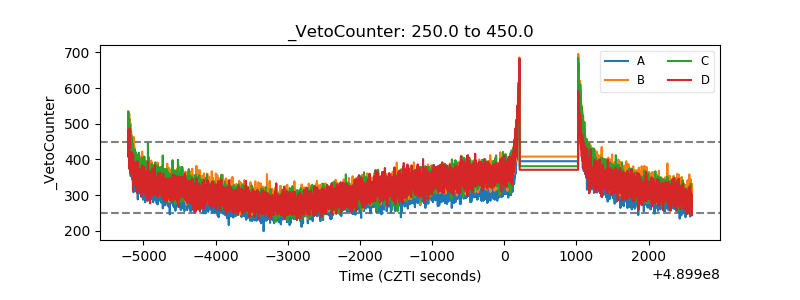 |