| Param | Original file | Final file |
|---|---|---|
| Filename | modeM0/AS1C09_011T06_9000006484_52931cztM0_level2.fits | modeM0/AS1C09_011T06_9000006484_52931cztM0_level2_quad_clean.evt |
| Size (bytes) | 895,812,480 | 64,791,360 |
| Size | 854.3 MB | 61.8 MB |
| Events in quadrant A | 15,324,534 | 21,872 |
| Events in quadrant B | 3,845,407 | 611,911 |
| Events in quadrant C | 5,207,961 | 536,011 |
| Events in quadrant D | 8,307,236 | 363,501 |
| Mode M9 | |||
|---|---|---|---|
| Quadrant | BADHDUFLAG | Total packets | Discarded packets |
| A | 0 | 11 | 0 |
| B | 0 | 11 | 0 |
| C | 0 | 11 | 0 |
| D | 0 | 11 | 0 |
| Mode M0 | |||
|---|---|---|---|
| Quadrant | BADHDUFLAG | Total packets | Discarded packets |
| A | 0 | 49695 | 3 |
| B | 0 | 15670 | 1 |
| C | 0 | 19808 | 1 |
| D | 0 | 28958 | 1 |
| Mode SS | |||
|---|---|---|---|
| Quadrant | BADHDUFLAG | Total packets | Discarded packets |
| A | 0 | 126 | 0 |
| B | 0 | 126 | 0 |
| C | 0 | 126 | 0 |
| D | 0 | 126 | 0 |
| Quadrant | Total seconds | Saturated seconds | Saturation percentage |
|---|---|---|---|
| A | 6131 | 5958 | 97.178274% |
| B | 6131 | 284 | 4.632197% |
| C | 6132 | 392 | 6.392694% |
| D | 6132 | 2148 | 35.029354% |
Noise dominated data is calculated using 1-second bins in cleaned event files. If a bin has >2000 counts, and if more than 50% of those come from <1% of pixels, then it is considered to be noise-dominated and hence unusable.
| Quadrant | # 1 sec bins | Bins with >0 counts | Bins with >2000 counts | High rate bins dominated by noise | Noise dominated (total time) | Noise dominated (detector-on time) | Marked lightcurve |
|---|---|---|---|---|---|---|---|
| A | 7236 | 6132 | 5428 | 5428 | 75.01% | 88.52% | 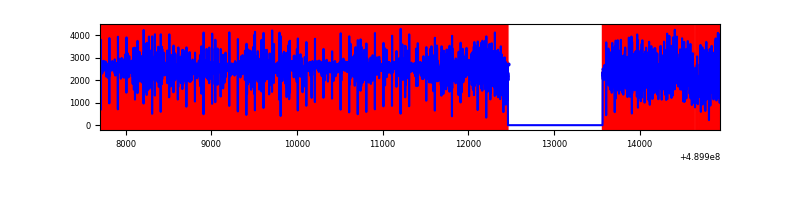 |
| B | 7236 | 6132 | 217 | 217 | 3.00% | 3.54% | 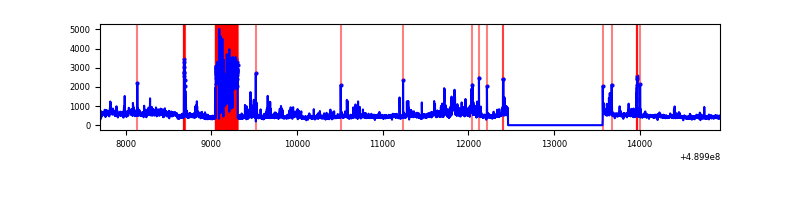 |
| C | 7237 | 6133 | 391 | 391 | 5.40% | 6.38% | 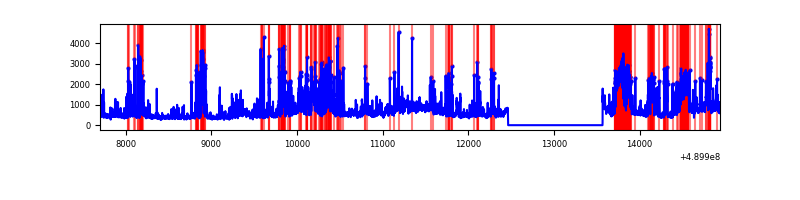 |
| D | 7237 | 6133 | 1649 | 1649 | 22.79% | 26.89% | 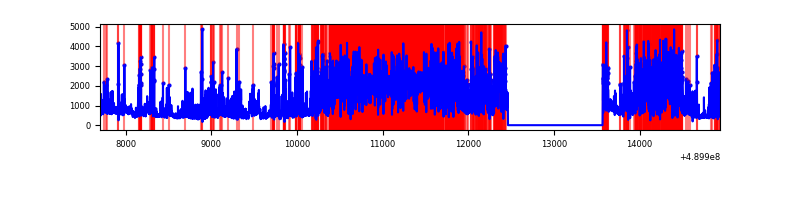 |
Top three noisy pixels from each quadrant. If the there are fewer than three noisy pixels in the level2.evt file, extra rows are filled as -1
| Pixel properties | Quadrant properties | ||||||
|---|---|---|---|---|---|---|---|
| Quadrant | DetID | PixID | Counts | Sigma | Mean | Median | Sigma |
| A | 9 | 191 | 14153050 | 237261.99 | 231 | 226 | 59.7 |
| A | 4 | 254 | 52221 | 871.66 | 231 | 226 | 59.7 |
| A | 4 | 238 | 37788 | 629.7 | 231 | 226 | 59.7 |
| B | 10 | 44 | 612081 | 4649.38 | 621 | 601 | 131.5 |
| B | 7 | 0 | 276805 | 2100.11 | 621 | 601 | 131.5 |
| B | 8 | 3 | 148409 | 1123.86 | 621 | 601 | 131.5 |
| C | 7 | 80 | 1104257 | 6678.32 | 600 | 597 | 165.3 |
| C | 15 | 254 | 442848 | 2676.09 | 600 | 597 | 165.3 |
| C | 12 | 2 | 317216 | 1915.88 | 600 | 597 | 165.3 |
| D | 12 | 0 | 2876627 | 20596.38 | 479 | 457 | 139.6 |
| D | 8 | 176 | 1892132 | 13546.37 | 479 | 457 | 139.6 |
| D | 15 | 78 | 342304 | 2447.98 | 479 | 457 | 139.6 |
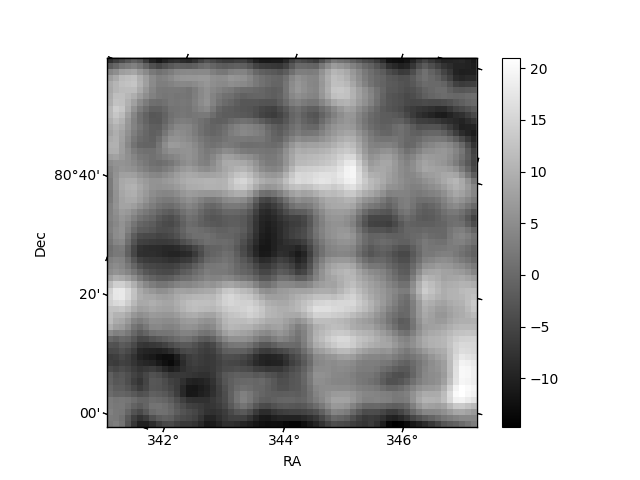
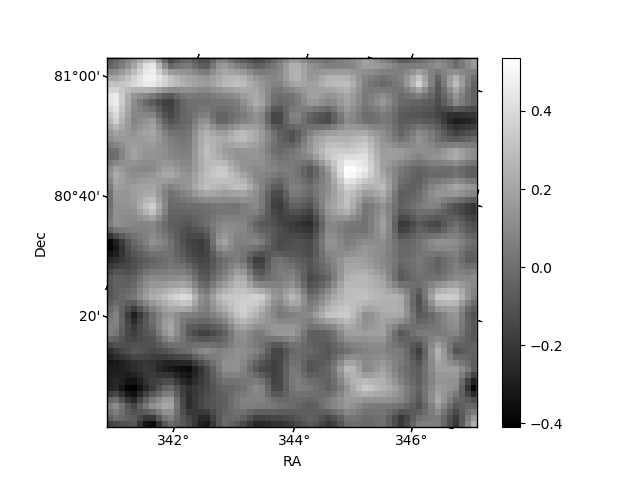
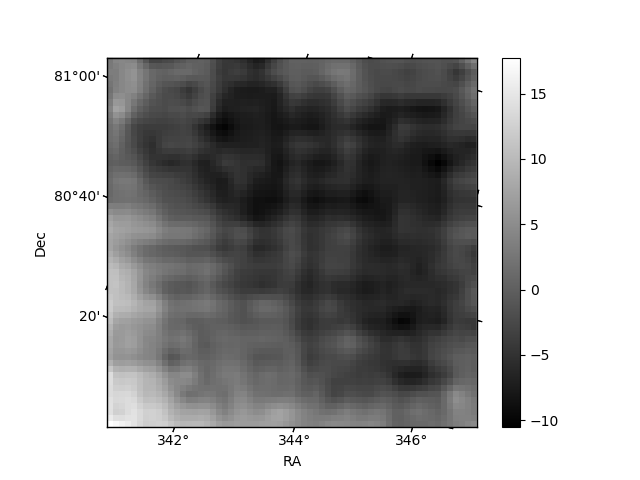
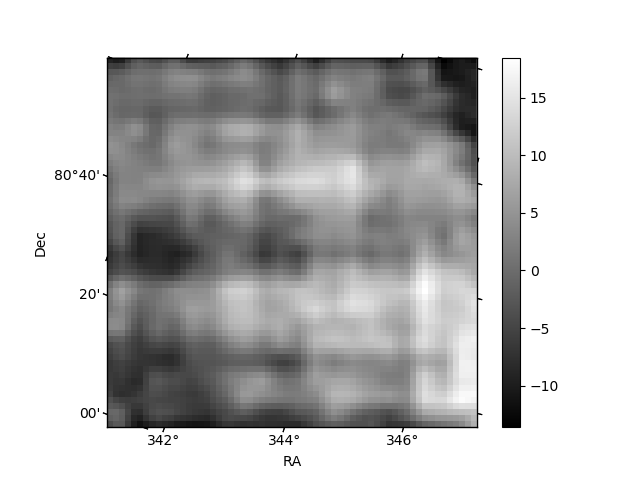
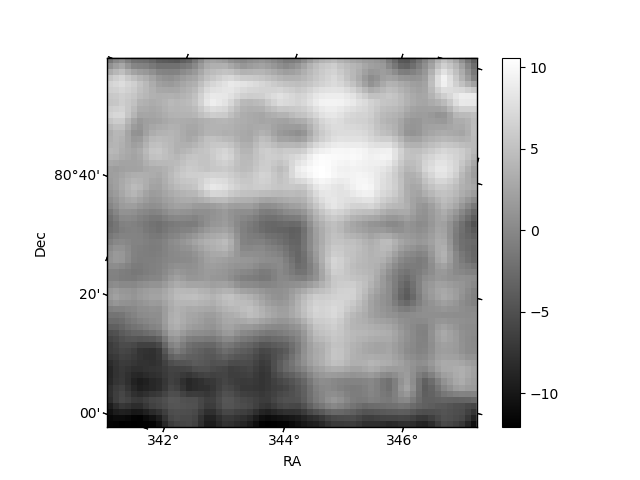
Histogram calculated using DETX and DETY for each event in the final _common_clean file
| Quadrant A | 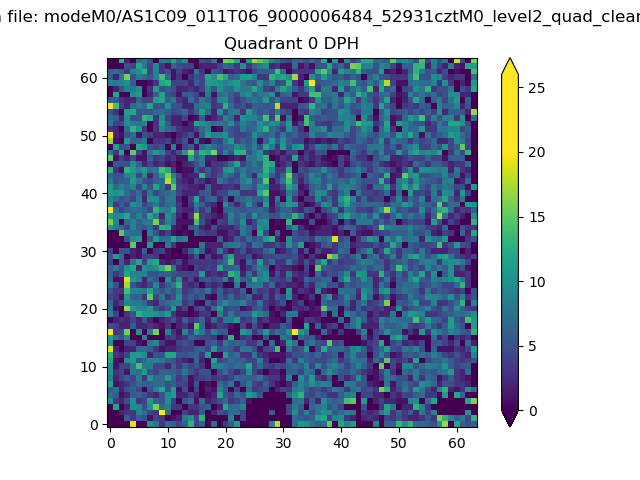 |
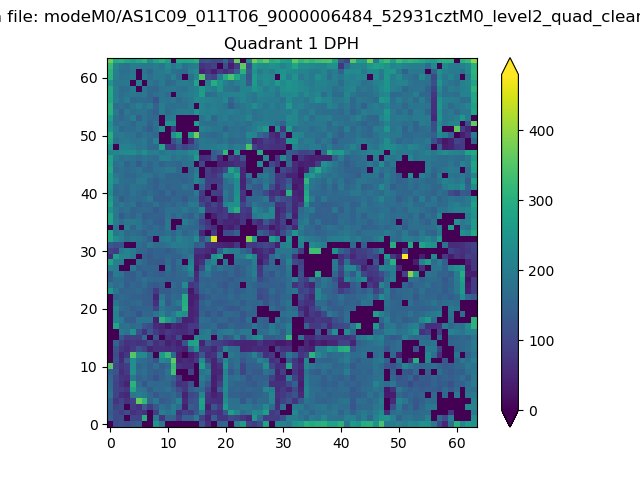 |
Quadrant B |
|---|---|---|---|
| Quadrant D | 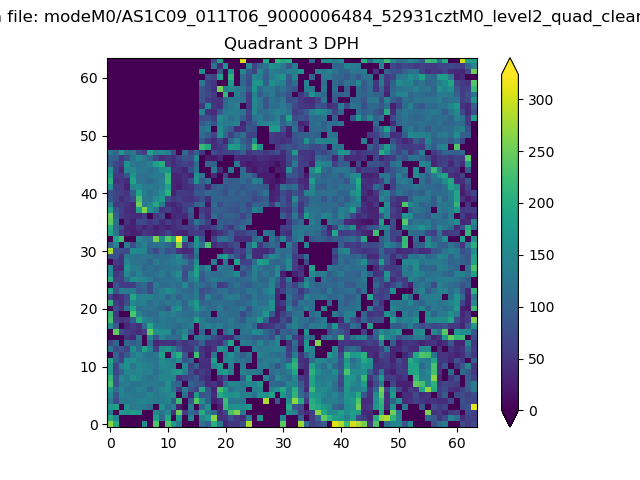 |
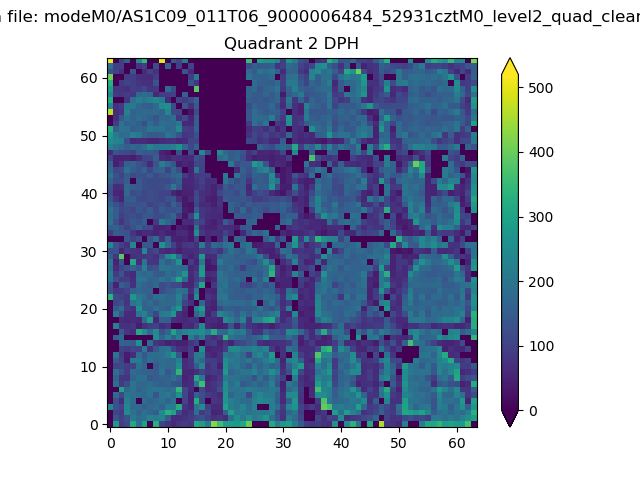 |
Quadrant C |
| Plot type | Count rate plots | Images |
|---|---|---|
| Comparison with Poisson distribution Blue bars denote a histogram of data divided into 1 sec bins. Red curve is a Poisson curve with rate = median count rate of data. |
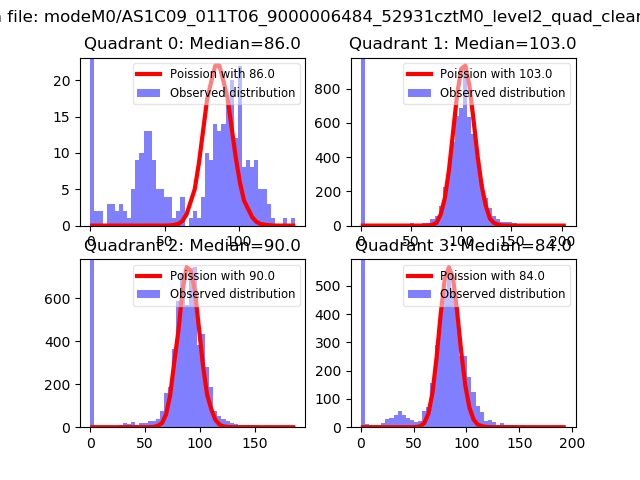 |
 |
| Quadrant-wise count rates Data is divided into 100 sec bins |
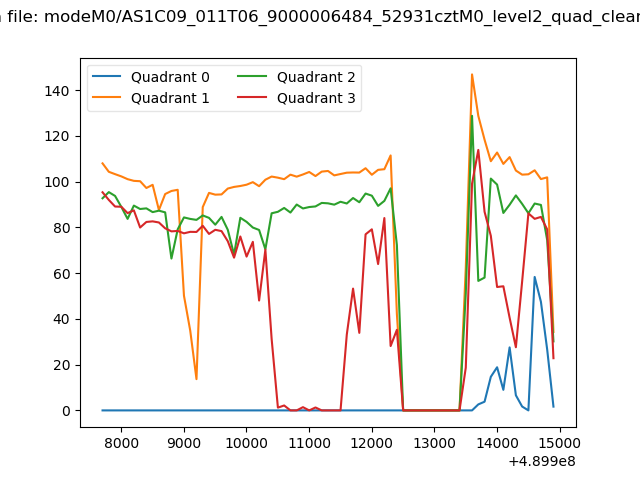 |
|
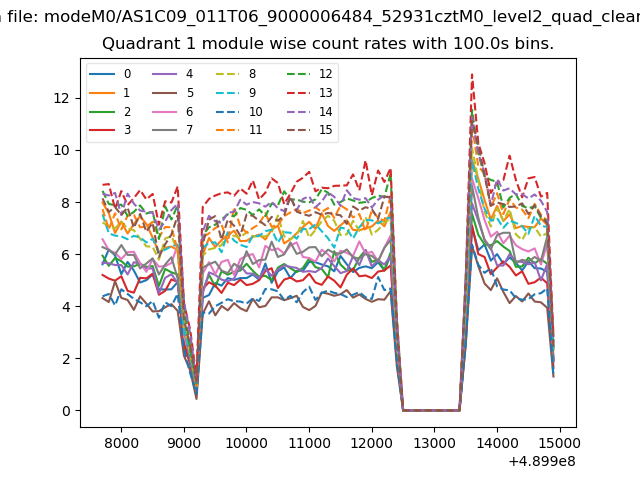
| Module-wise count rates for Quadrant A Data is divided into 100 sec bins |
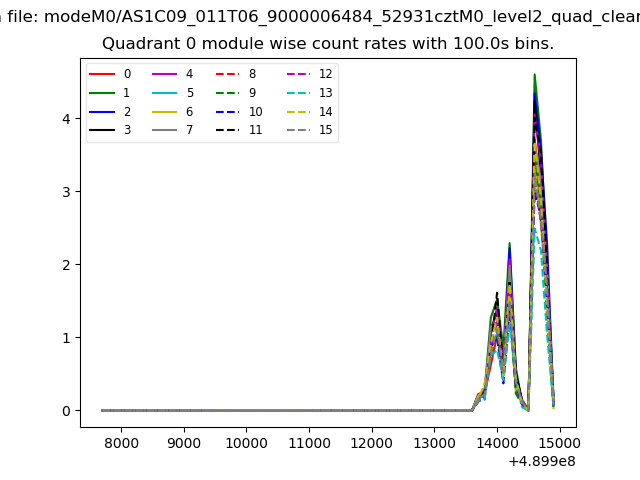 |
 |
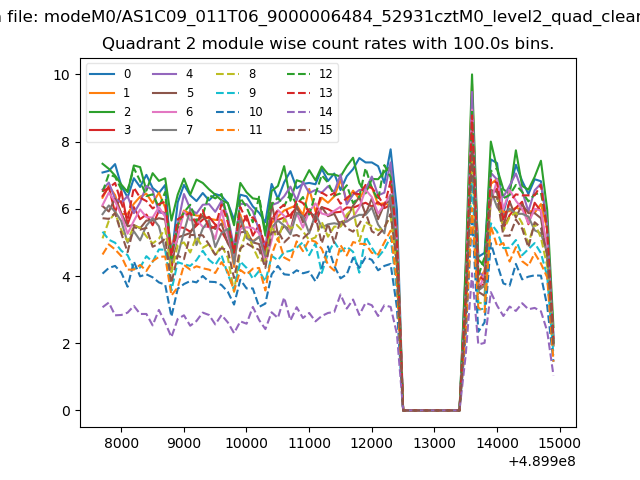
| Module-wise count rates for Quadrant B Data is divided into 100 sec bins |
 |
 |
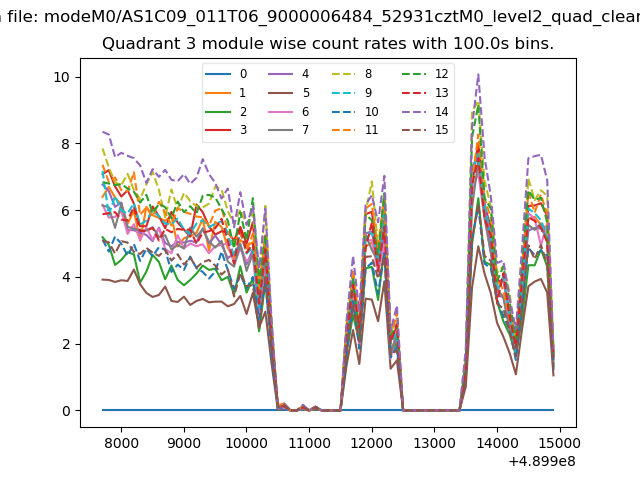
| Module-wise count rates for Quadrant C Data is divided into 100 sec bins |
 |
 |
| Module-wise count rates for Quadrant D Data is divided into 100 sec bins |
 |
 |
| Parameter | Plot |
|---|---|
| CZT HV Monitor |  |
| D_VDD | 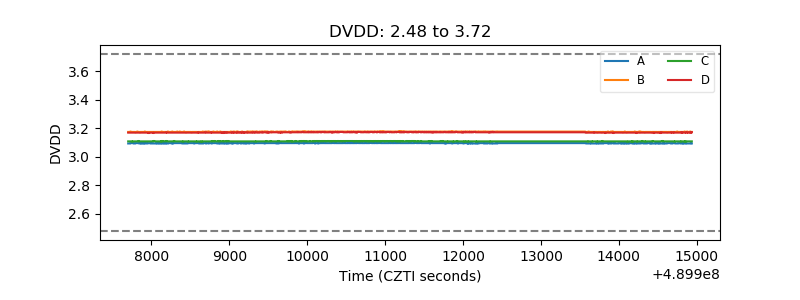 |
| Temperature 1 | 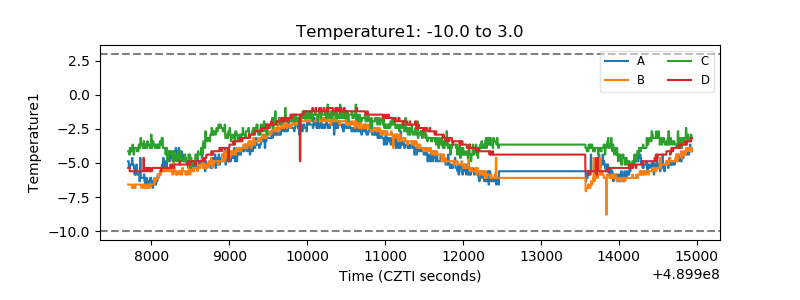 |
| Veto HV Monitor | 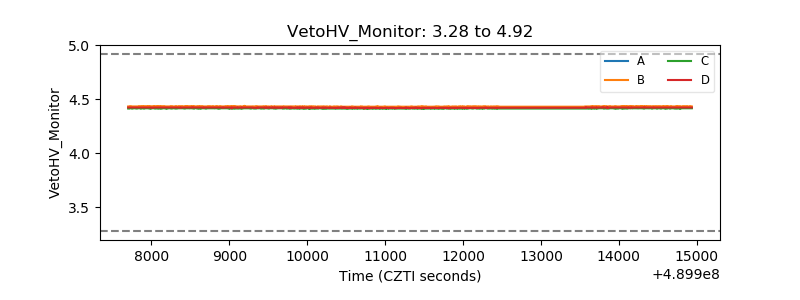 |
| Veto LLD | 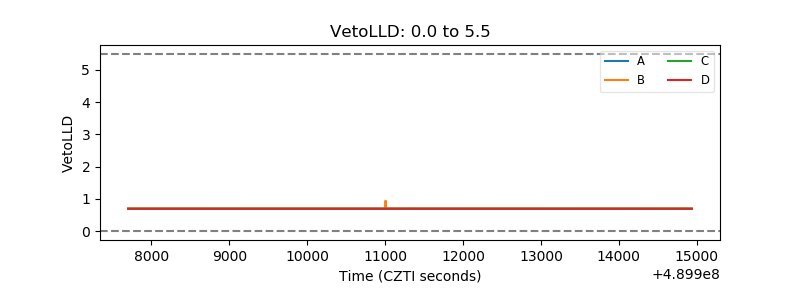 |
| Alpha Counter | 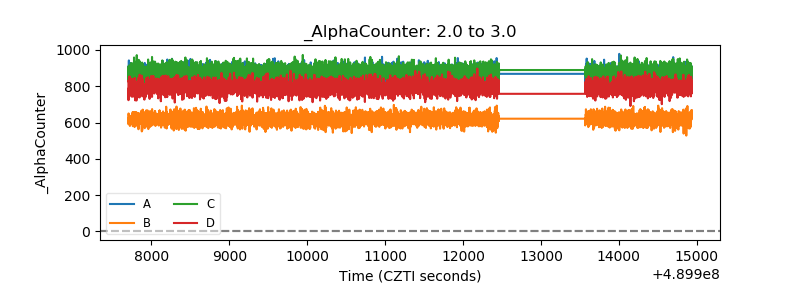 |
| _CPM_Rate | 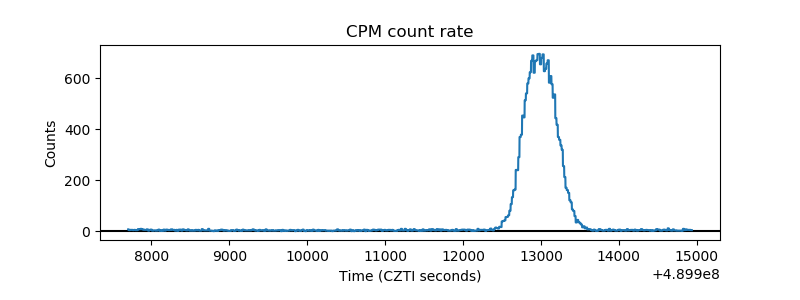 |
| CZT Counter | 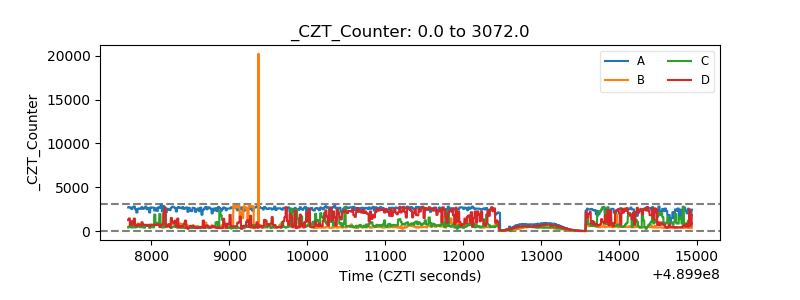 |
| +2.5 Volts monitor |  |
| +5 Volts monitor |  |
| _ROLL_ROT | 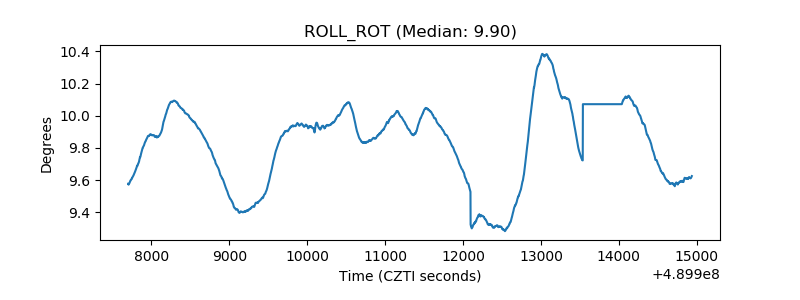 |
| _Roll_DEC | 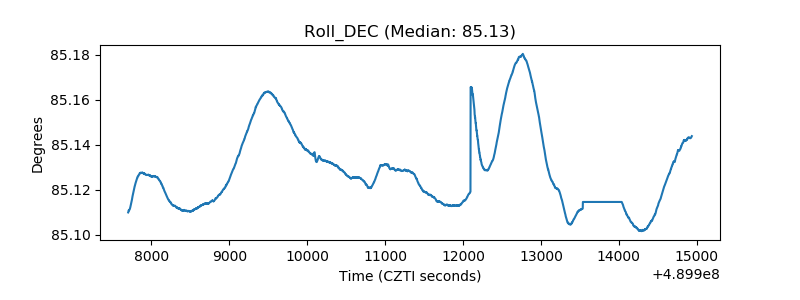 |
| _Roll_RA | 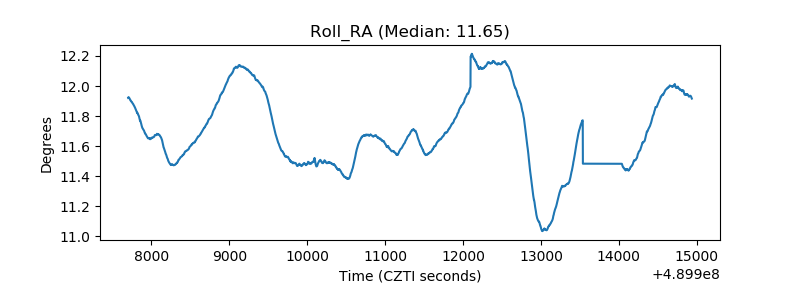 |
| Veto Counter | 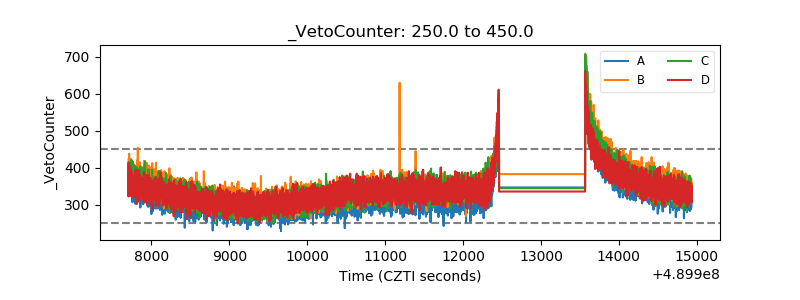 |