| Param | Original file | Final file |
|---|---|---|
| Filename | modeM0/AS1C09_011T06_9000006484_52933cztM0_level2.fits | modeM0/AS1C09_011T06_9000006484_52933cztM0_level2_quad_clean.evt |
| Size (bytes) | 313,822,080 | 20,257,920 |
| Size | 299.3 MB | 19.3 MB |
| Events in quadrant A | 4,991,551 | 1,651 |
| Events in quadrant B | 1,316,307 | 205,719 |
| Events in quadrant C | 1,727,677 | 163,342 |
| Events in quadrant D | 3,424,930 | 98,456 |
| Mode M0 | |||
|---|---|---|---|
| Quadrant | BADHDUFLAG | Total packets | Discarded packets |
| A | 0 | 16206 | 0 |
| B | 0 | 5284 | 0 |
| C | 0 | 6561 | 0 |
| D | 0 | 11525 | 0 |
| Mode SS | |||
|---|---|---|---|
| Quadrant | BADHDUFLAG | Total packets | Discarded packets |
| A | 0 | 38 | 0 |
| B | 0 | 38 | 0 |
| C | 0 | 38 | 0 |
| D | 0 | 38 | 0 |
| Quadrant | Total seconds | Saturated seconds | Saturation percentage |
|---|---|---|---|
| A | 1988 | 1978 | 99.496982% |
| B | 1989 | 33 | 1.659125% |
| C | 1989 | 234 | 11.764706% |
| D | 1989 | 965 | 48.516843% |
Noise dominated data is calculated using 1-second bins in cleaned event files. If a bin has >2000 counts, and if more than 50% of those come from <1% of pixels, then it is considered to be noise-dominated and hence unusable.
| Quadrant | # 1 sec bins | Bins with >0 counts | Bins with >2000 counts | High rate bins dominated by noise | Noise dominated (total time) | Noise dominated (detector-on time) | Marked lightcurve |
|---|---|---|---|---|---|---|---|
| A | 1987 | 1987 | 1768 | 1768 | 88.98% | 88.98% | 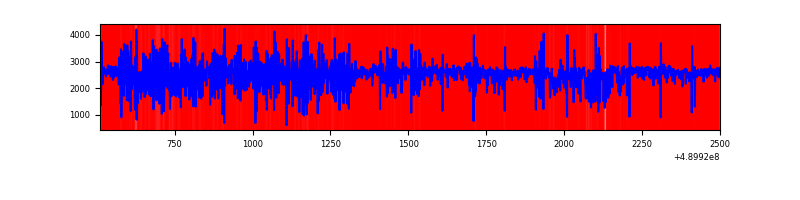 |
| B | 1989 | 1989 | 19 | 19 | 0.96% | 0.96% | 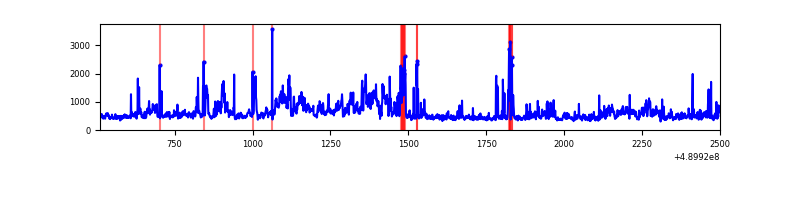 |
| C | 1989 | 1989 | 174 | 174 | 8.75% | 8.75% | 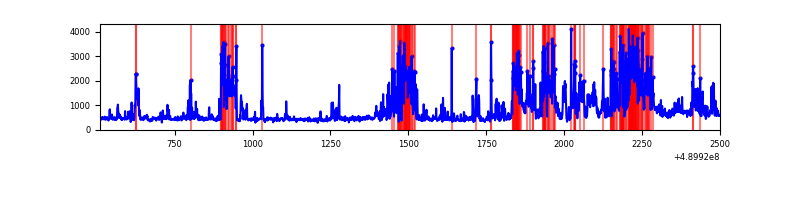 |
| D | 1989 | 1989 | 810 | 810 | 40.72% | 40.72% | 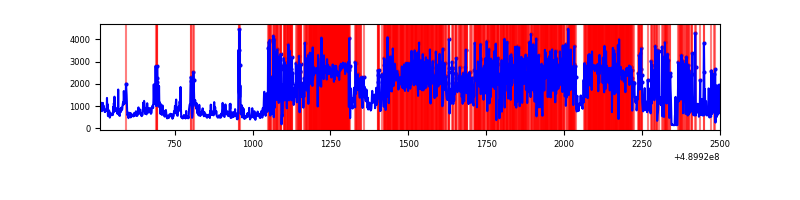 |
Top three noisy pixels from each quadrant. If the there are fewer than three noisy pixels in the level2.evt file, extra rows are filled as -1
| Pixel properties | Quadrant properties | ||||||
|---|---|---|---|---|---|---|---|
| Quadrant | DetID | PixID | Counts | Sigma | Mean | Median | Sigma |
| A | 9 | 191 | 4625018 | 256989.62 | 65 | 63 | 18.0 |
| A | 4 | 254 | 29322 | 1625.8 | 65 | 63 | 18.0 |
| A | 15 | 174 | 21310 | 1180.61 | 65 | 63 | 18.0 |
| B | 10 | 254 | 279517 | 6319.68 | 199 | 193 | 44.2 |
| B | 1 | 255 | 113232 | 2557.5 | 199 | 193 | 44.2 |
| B | 8 | 128 | 41105 | 925.63 | 199 | 193 | 44.2 |
| C | 15 | 224 | 535031 | 10204.18 | 181 | 179 | 52.4 |
| C | 15 | 254 | 159531 | 3040.2 | 181 | 179 | 52.4 |
| C | 12 | 249 | 100223 | 1908.69 | 181 | 179 | 52.4 |
| D | 10 | 172 | 1061442 | 24569.0 | 147 | 140 | 43.2 |
| D | 15 | 78 | 713393 | 16511.71 | 147 | 140 | 43.2 |
| D | 8 | 176 | 670565 | 15520.25 | 147 | 140 | 43.2 |
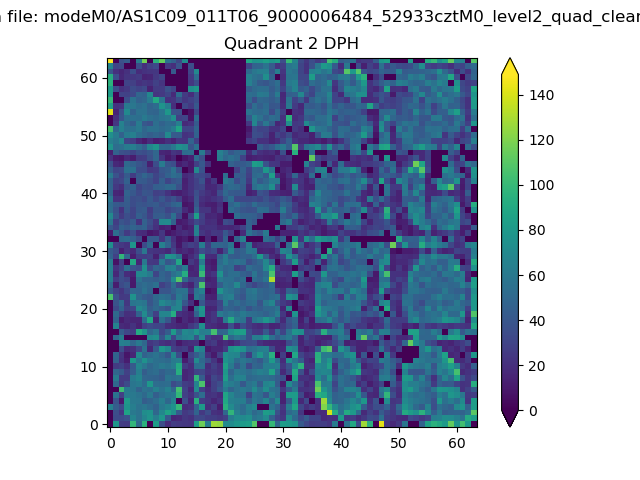
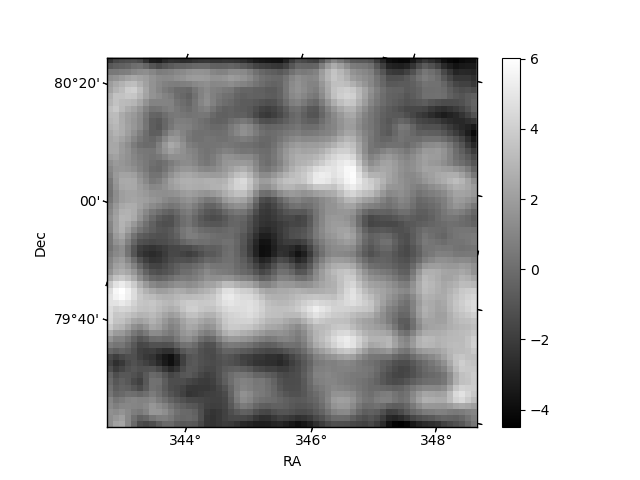
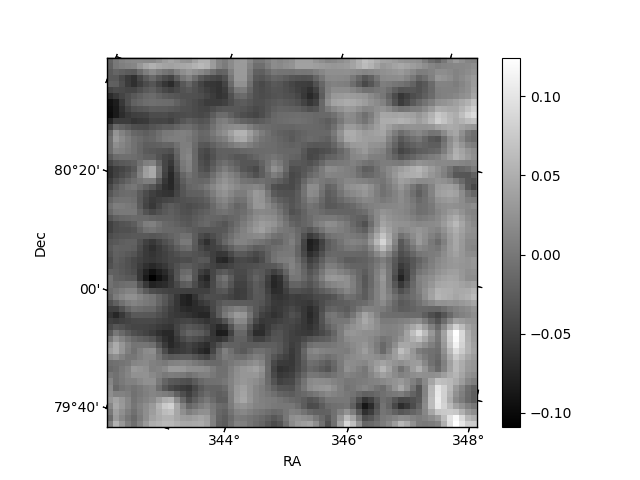
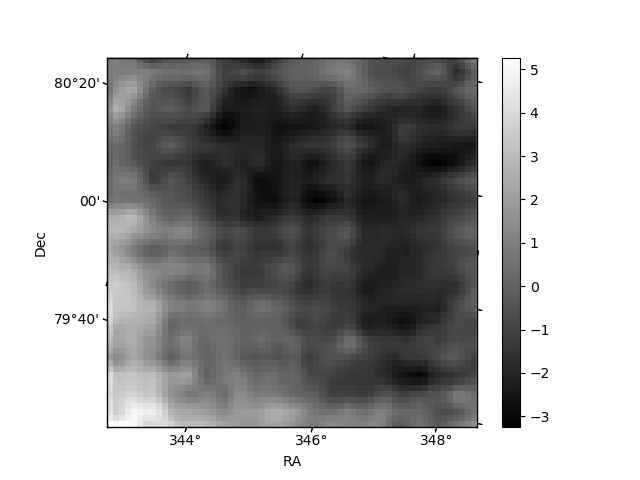
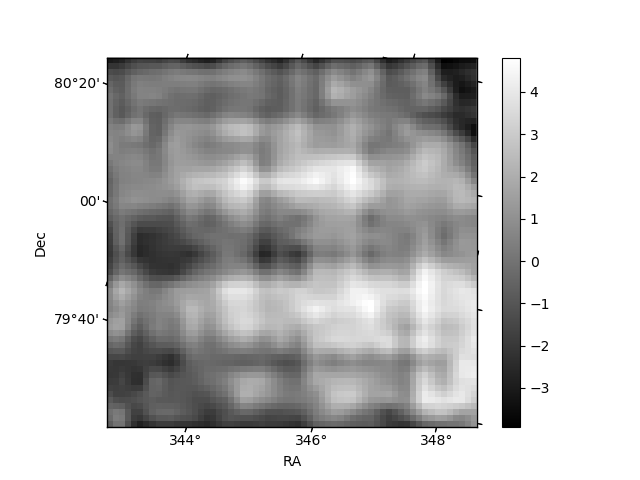
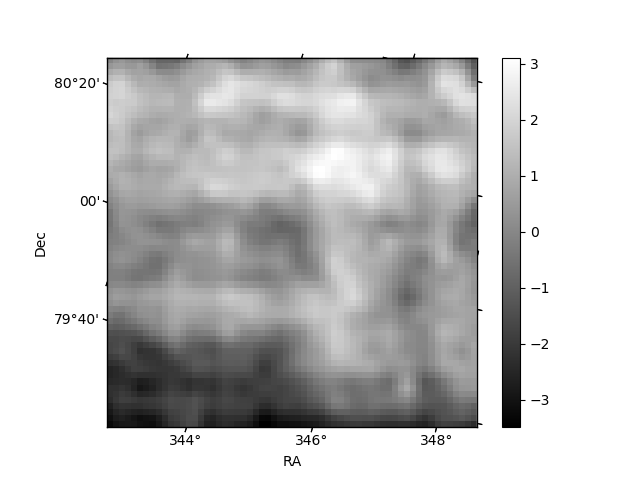
Histogram calculated using DETX and DETY for each event in the final _common_clean file
| Quadrant A | 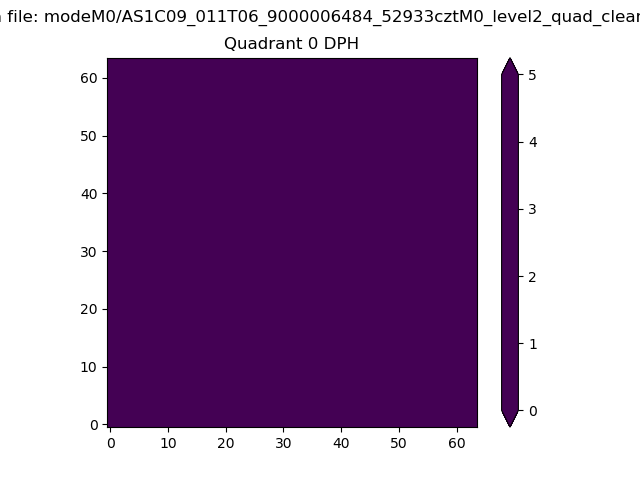 |
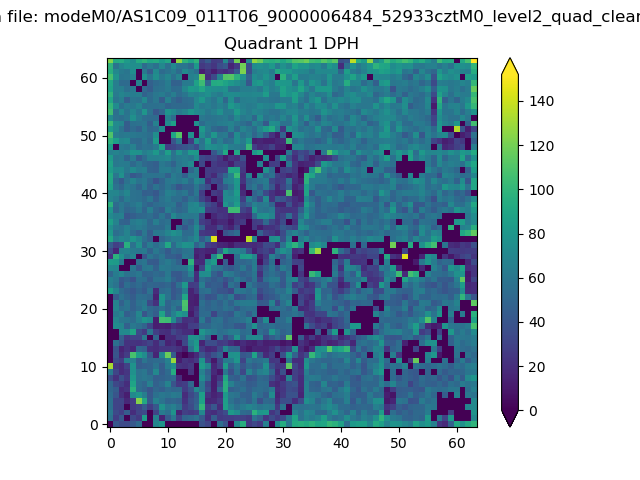 |
Quadrant B |
|---|---|---|---|
| Quadrant D | 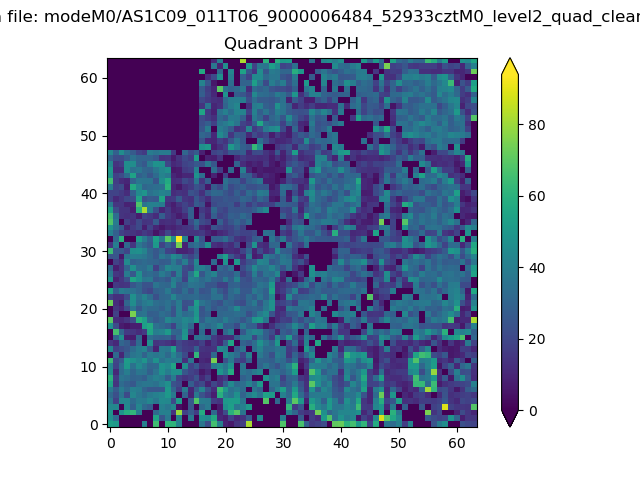 |
 |
Quadrant C |
| Plot type | Count rate plots | Images |
|---|---|---|
| Comparison with Poisson distribution Blue bars denote a histogram of data divided into 1 sec bins. Red curve is a Poisson curve with rate = median count rate of data. |
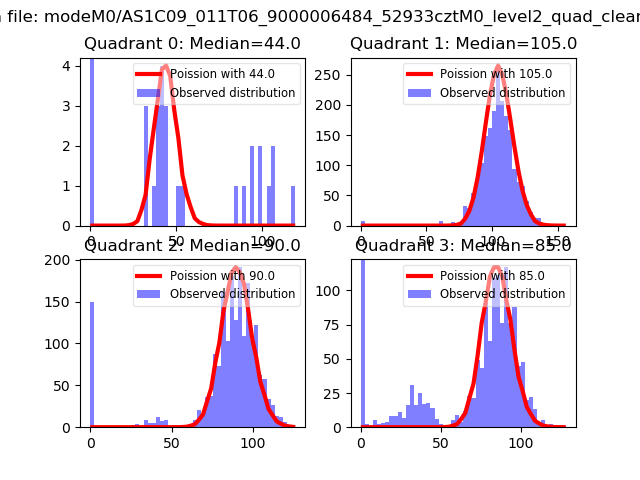 |
 |
| Quadrant-wise count rates Data is divided into 100 sec bins |
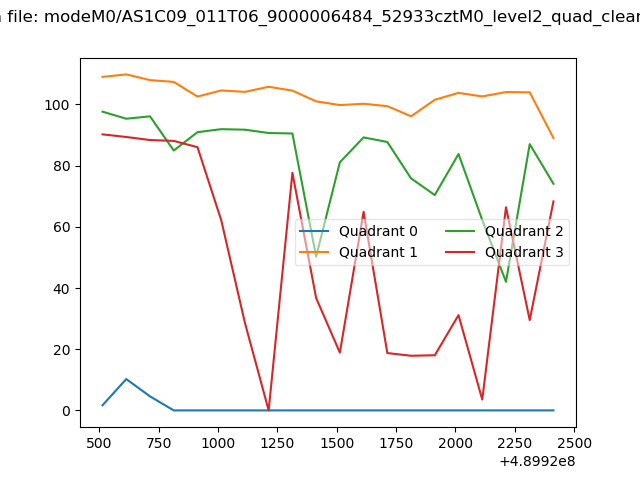 |
|
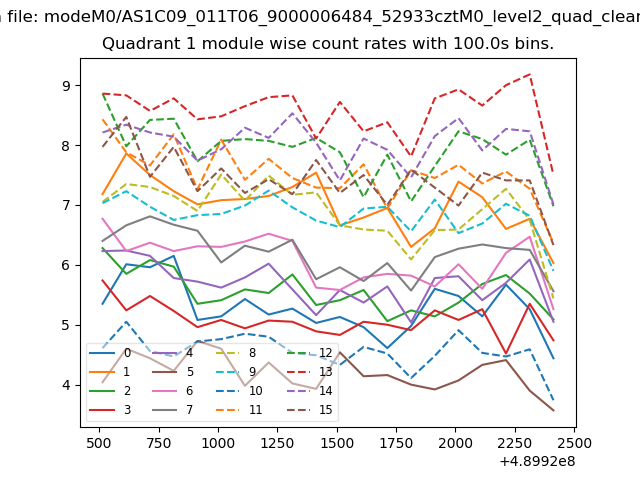
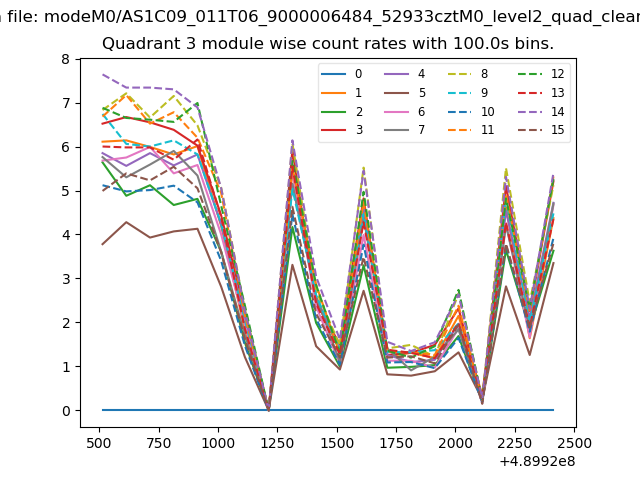
| Module-wise count rates for Quadrant A Data is divided into 100 sec bins |
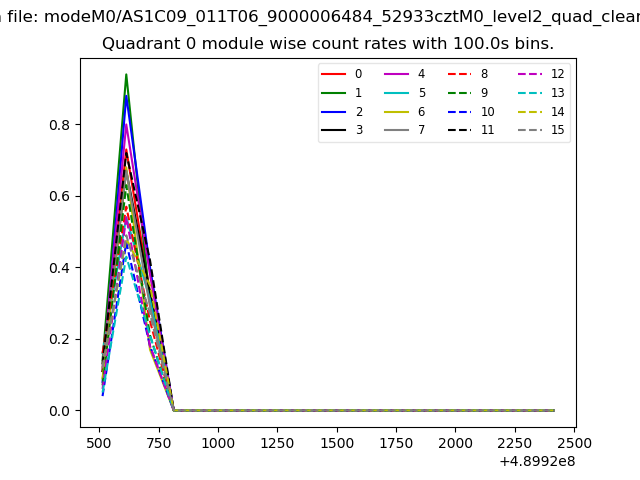 |
 |
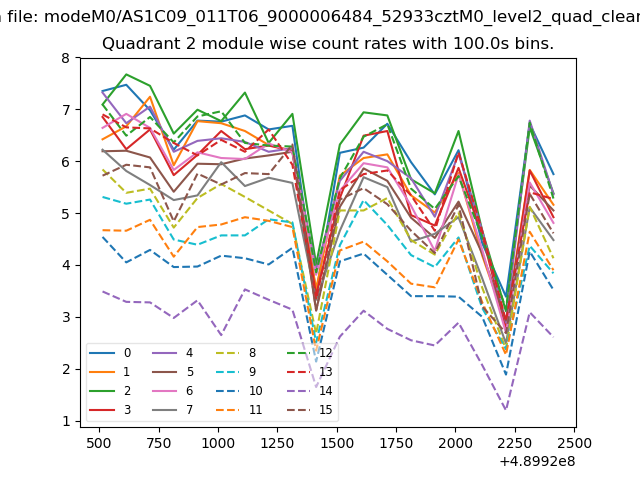
| Module-wise count rates for Quadrant B Data is divided into 100 sec bins |
 |
 |
| Module-wise count rates for Quadrant C Data is divided into 100 sec bins |
 |
 |
| Module-wise count rates for Quadrant D Data is divided into 100 sec bins |
 |
 |
| Parameter | Plot |
|---|---|
| CZT HV Monitor | 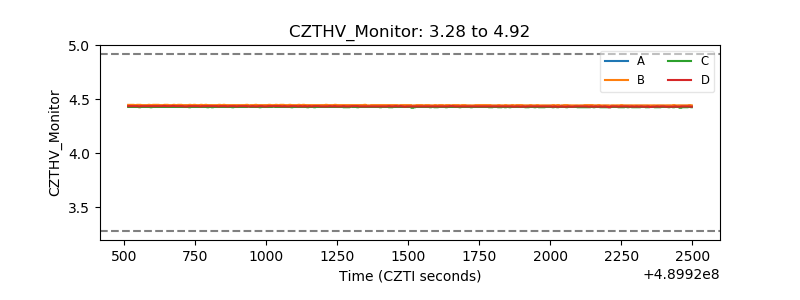 |
| D_VDD | 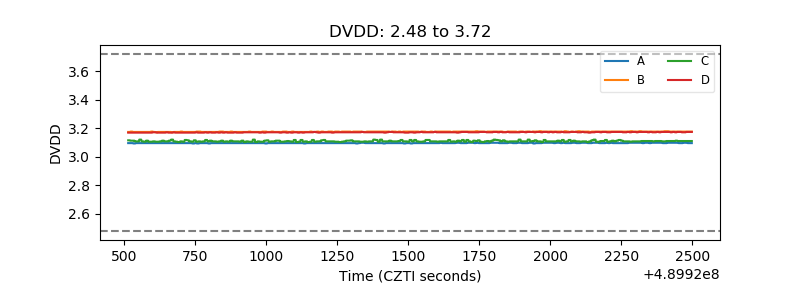 |
| Temperature 1 | 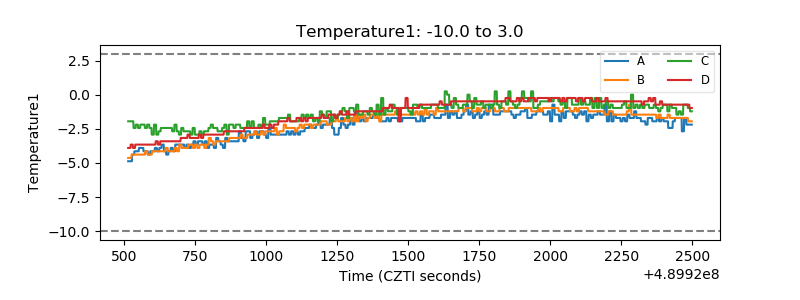 |
| Veto HV Monitor | 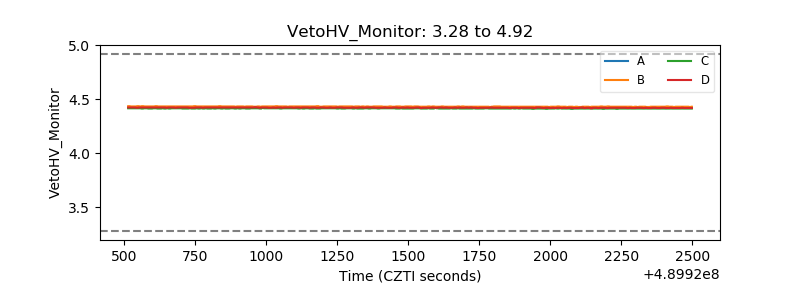 |
| Veto LLD | 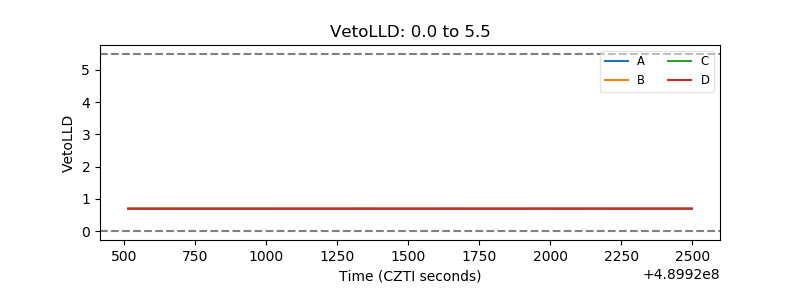 |
| Alpha Counter | 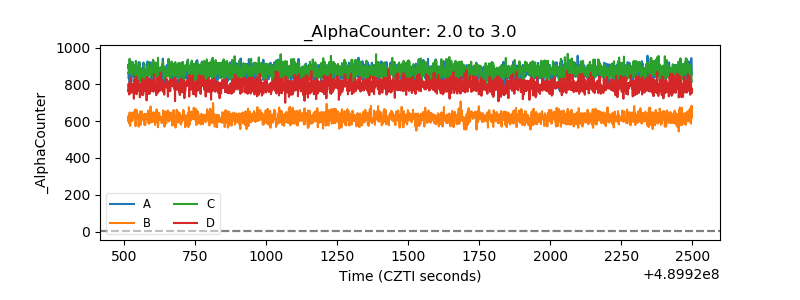 |
| _CPM_Rate | 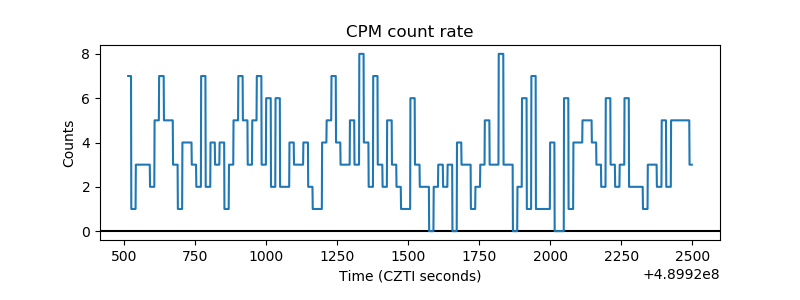 |
| CZT Counter | 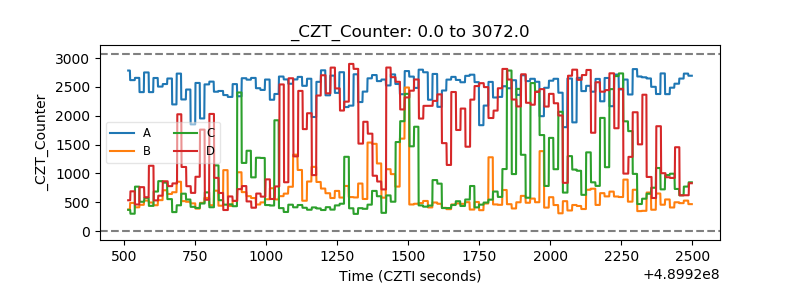 |
| +2.5 Volts monitor |  |
| +5 Volts monitor |  |
| _ROLL_ROT | 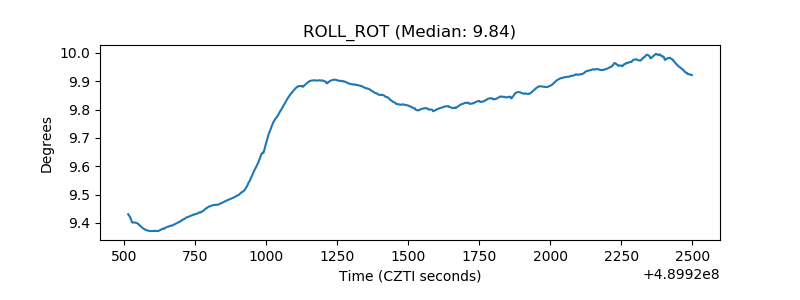 |
| _Roll_DEC | 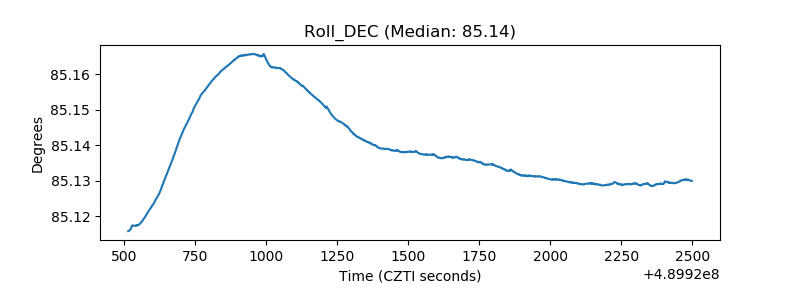 |
| _Roll_RA | 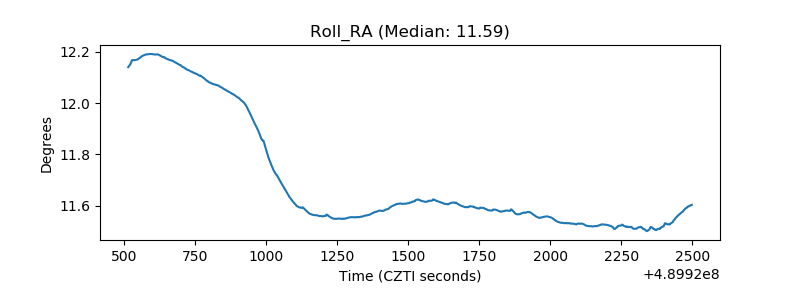 |
| Veto Counter | 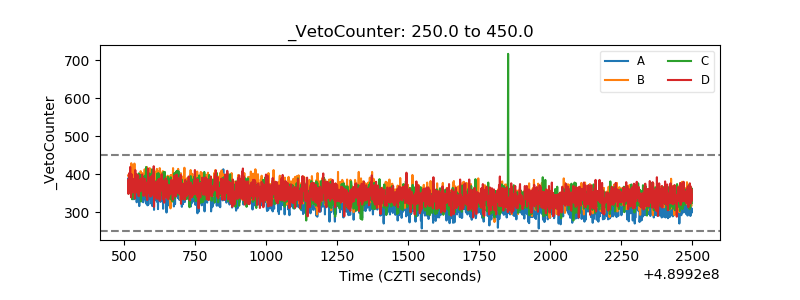 |