| Param | Original file | Final file |
|---|---|---|
| Filename | modeM0/AS1A13_003T01_9000006486_52934cztM0_level2.fits | modeM0/AS1A13_003T01_9000006486_52934cztM0_level2_quad_clean.evt |
| Size (bytes) | 856,359,360 | 71,899,200 |
| Size | 816.7 MB | 68.6 MB |
| Events in quadrant A | 15,647,003 | 34,292 |
| Events in quadrant B | 3,687,429 | 659,610 |
| Events in quadrant C | 4,199,379 | 562,833 |
| Events in quadrant D | 7,670,483 | 474,848 |
| Mode M9 | |||
|---|---|---|---|
| Quadrant | BADHDUFLAG | Total packets | Discarded packets |
| A | 0 | 11 | 0 |
| B | 0 | 11 | 0 |
| C | 0 | 11 | 0 |
| D | 0 | 11 | 0 |
| Mode M0 | |||
|---|---|---|---|
| Quadrant | BADHDUFLAG | Total packets | Discarded packets |
| A | 0 | 50895 | 1 |
| B | 0 | 15361 | 1 |
| C | 0 | 16978 | 1 |
| D | 0 | 27211 | 7 |
| Mode SS | |||
|---|---|---|---|
| Quadrant | BADHDUFLAG | Total packets | Discarded packets |
| A | 0 | 130 | 0 |
| B | 0 | 130 | 0 |
| C | 0 | 130 | 0 |
| D | 0 | 130 | 0 |
| Quadrant | Total seconds | Saturated seconds | Saturation percentage |
|---|---|---|---|
| A | 6386 | 6138 | 96.116505% |
| B | 6387 | 289 | 4.524816% |
| C | 6387 | 348 | 5.448567% |
| D | 6386 | 1190 | 18.634513% |
Noise dominated data is calculated using 1-second bins in cleaned event files. If a bin has >2000 counts, and if more than 50% of those come from <1% of pixels, then it is considered to be noise-dominated and hence unusable.
| Quadrant | # 1 sec bins | Bins with >0 counts | Bins with >2000 counts | High rate bins dominated by noise | Noise dominated (total time) | Noise dominated (detector-on time) | Marked lightcurve |
|---|---|---|---|---|---|---|---|
| A | 7455 | 6385 | 5268 | 5268 | 70.66% | 82.51% | 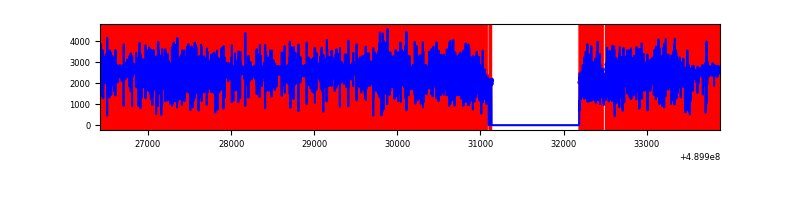 |
| B | 7457 | 6388 | 109 | 109 | 1.46% | 1.71% | 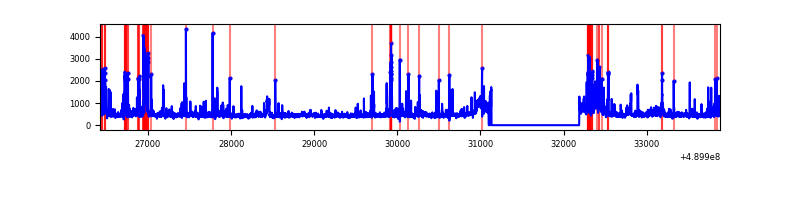 |
| C | 7457 | 6389 | 200 | 200 | 2.68% | 3.13% | 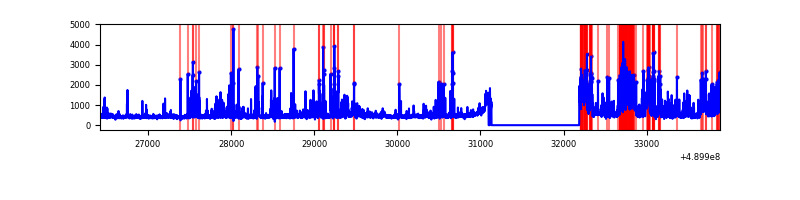 |
| D | 7456 | 6387 | 983 | 983 | 13.18% | 15.39% | 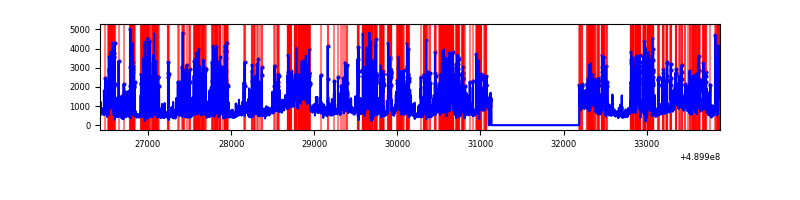 |
Top three noisy pixels from each quadrant. If the there are fewer than three noisy pixels in the level2.evt file, extra rows are filled as -1
| Pixel properties | Quadrant properties | ||||||
|---|---|---|---|---|---|---|---|
| Quadrant | DetID | PixID | Counts | Sigma | Mean | Median | Sigma |
| A | 9 | 191 | 14019559 | 176898.51 | 313 | 305 | 79.3 |
| A | 13 | 248 | 100542 | 1264.82 | 313 | 305 | 79.3 |
| A | 4 | 254 | 93177 | 1171.88 | 313 | 305 | 79.3 |
| B | 1 | 255 | 523505 | 3510.03 | 694 | 671 | 149.0 |
| B | 4 | 81 | 67726 | 450.17 | 694 | 671 | 149.0 |
| B | 1 | 239 | 59334 | 393.83 | 694 | 671 | 149.0 |
| C | 9 | 38 | 615063 | 3353.2 | 667 | 658 | 183.2 |
| C | 15 | 224 | 244631 | 1331.52 | 667 | 658 | 183.2 |
| C | 7 | 80 | 209158 | 1137.92 | 667 | 658 | 183.2 |
| D | 8 | 176 | 2458605 | 13622.26 | 633 | 607 | 180.4 |
| D | 15 | 78 | 556533 | 3080.95 | 633 | 607 | 180.4 |
| D | 10 | 172 | 452776 | 2505.93 | 633 | 607 | 180.4 |
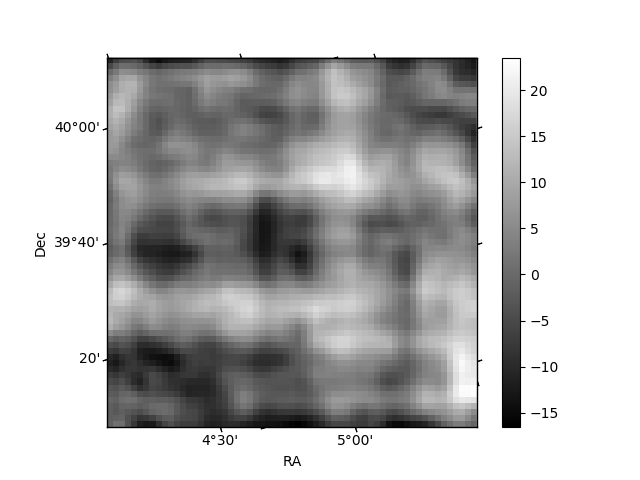
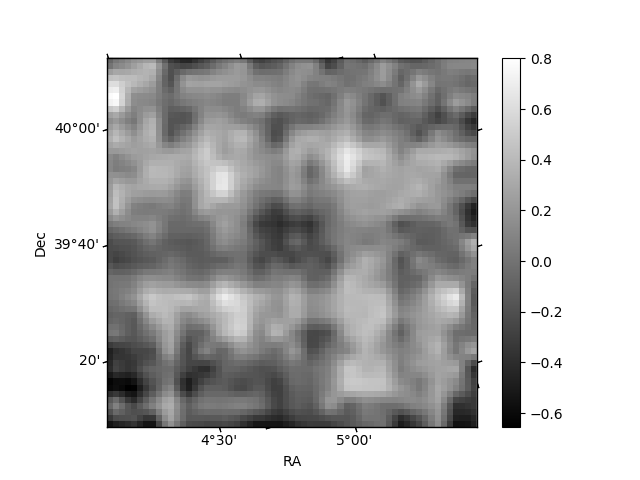
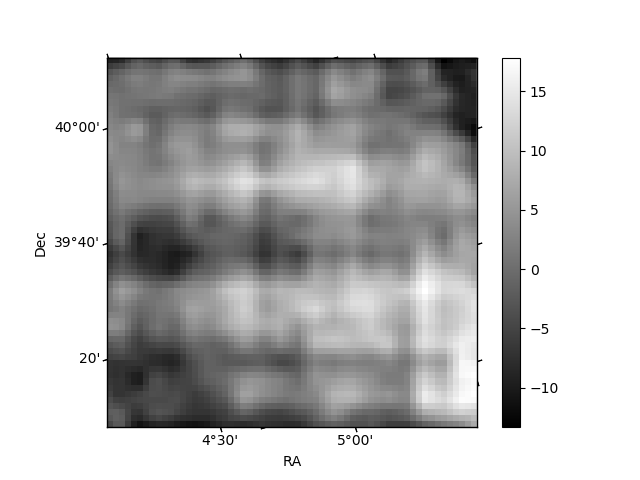
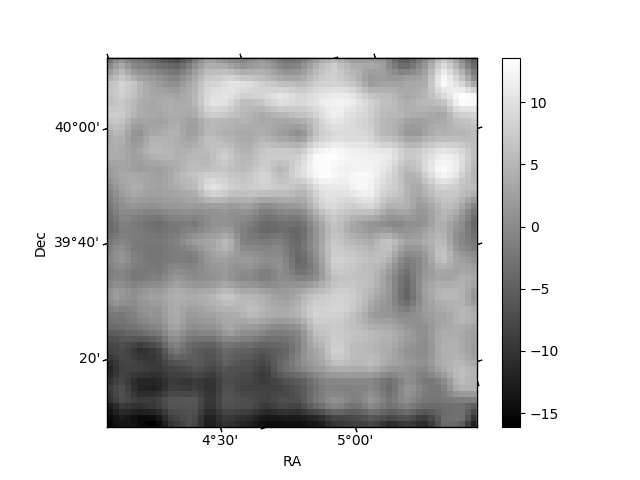
Histogram calculated using DETX and DETY for each event in the final _common_clean file
| Quadrant A | 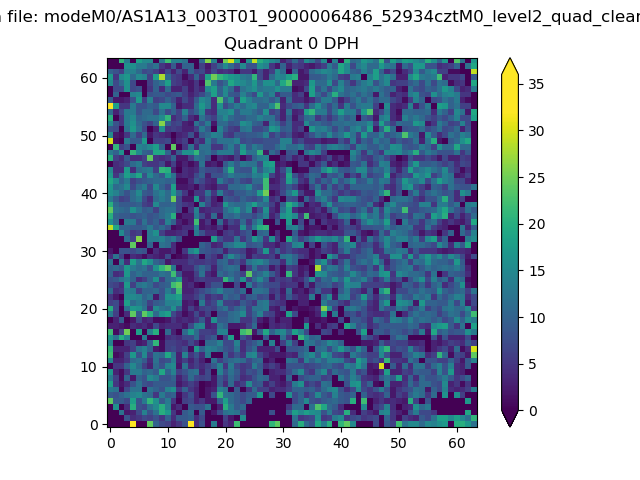 |
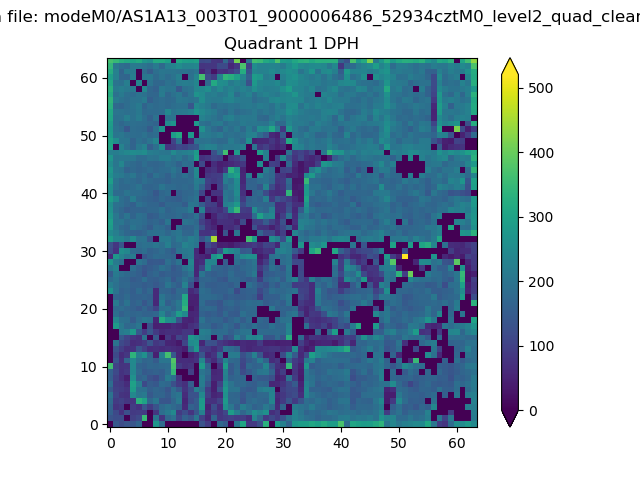 |
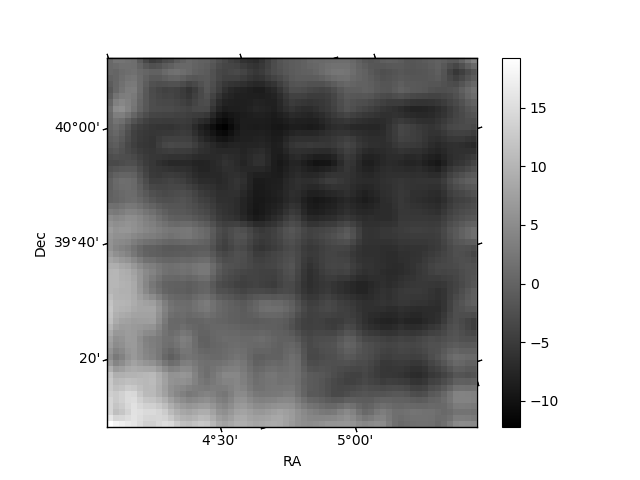
Quadrant B |
|---|---|---|---|
| Quadrant D | 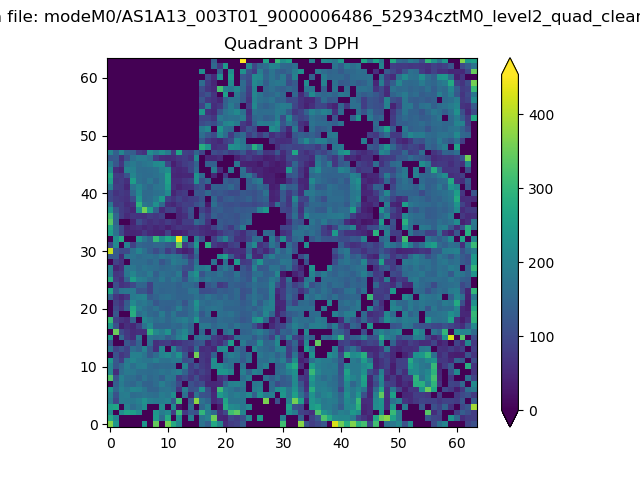 |
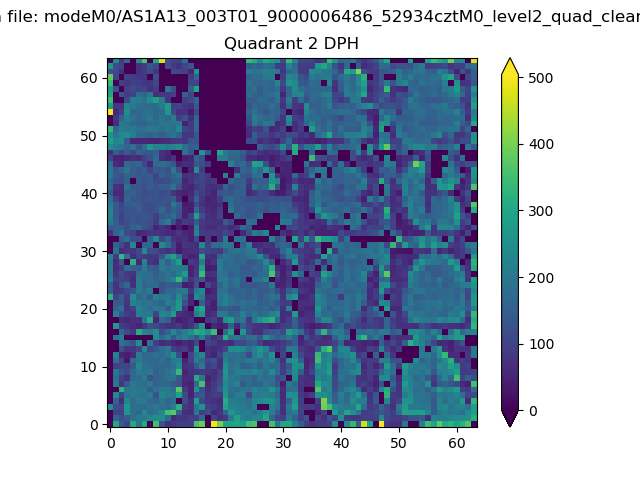 |
Quadrant C |
| Plot type | Count rate plots | Images |
|---|---|---|
| Comparison with Poisson distribution Blue bars denote a histogram of data divided into 1 sec bins. Red curve is a Poisson curve with rate = median count rate of data. |
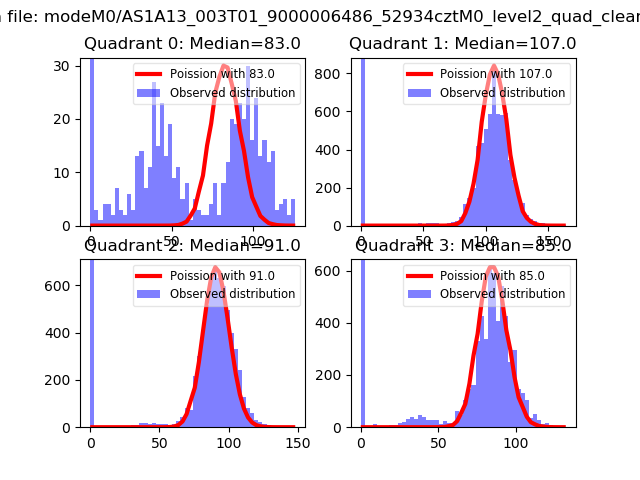 |
 |
| Quadrant-wise count rates Data is divided into 100 sec bins |
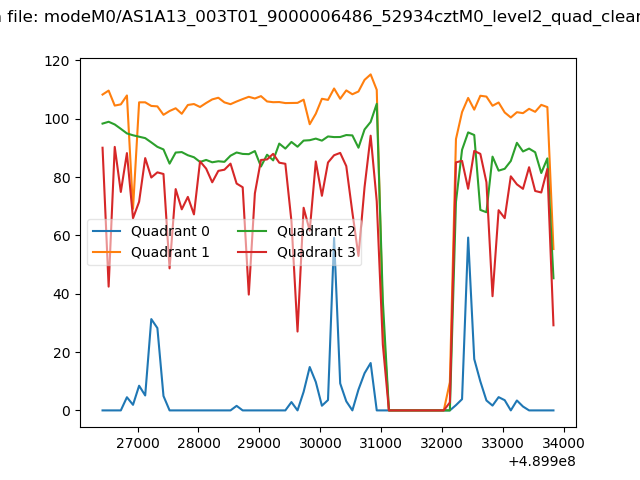 |
|
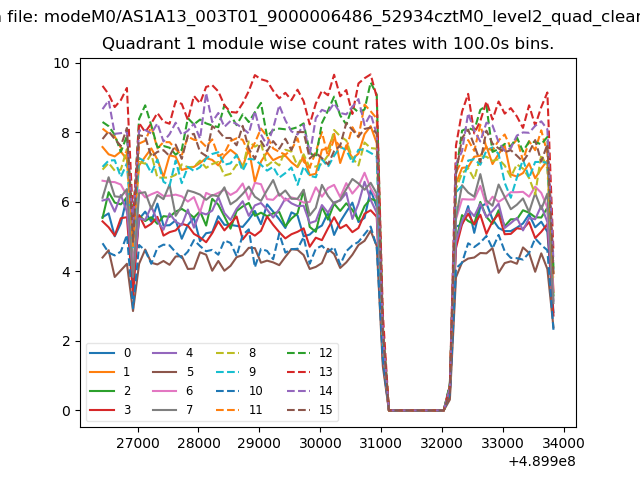
| Module-wise count rates for Quadrant A Data is divided into 100 sec bins |
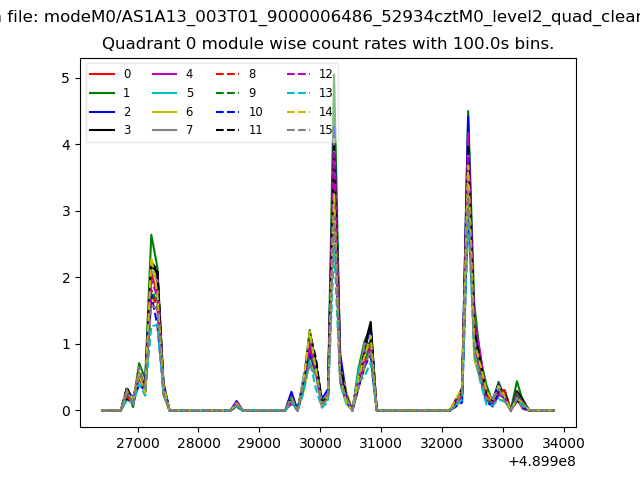 |
 |
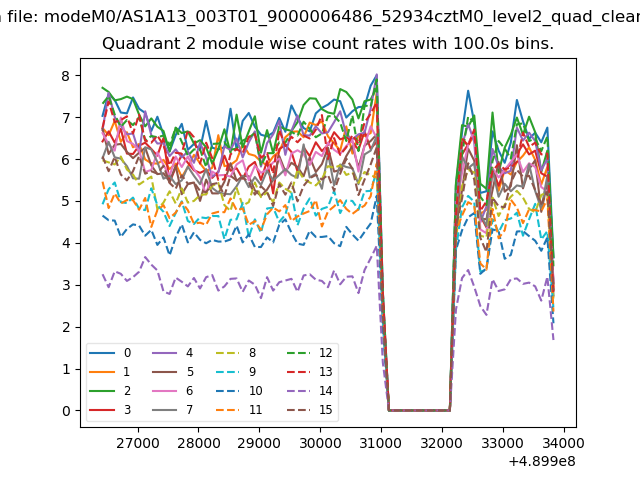
| Module-wise count rates for Quadrant B Data is divided into 100 sec bins |
 |
 |
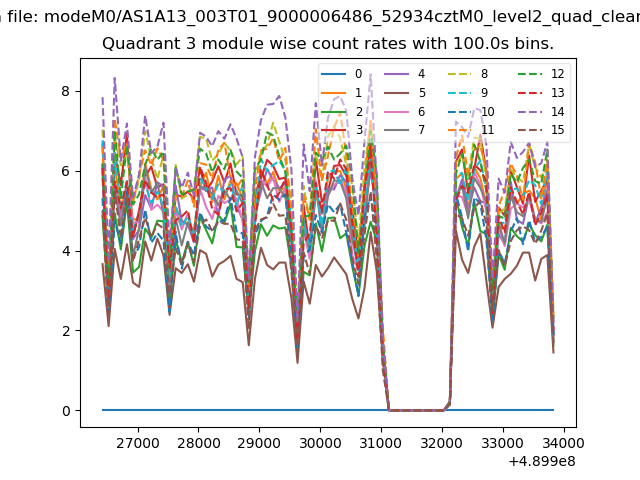
| Module-wise count rates for Quadrant C Data is divided into 100 sec bins |
 |
 |
| Module-wise count rates for Quadrant D Data is divided into 100 sec bins |
 |
 |
| Parameter | Plot |
|---|---|
| CZT HV Monitor |  |
| D_VDD | 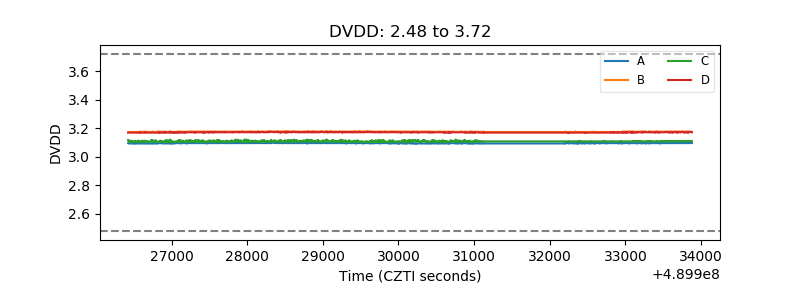 |
| Temperature 1 |  |
| Veto HV Monitor | 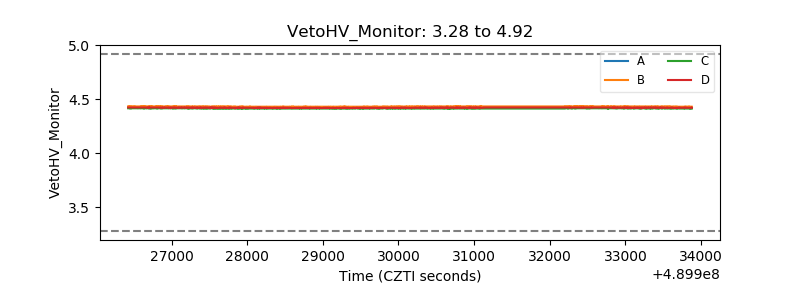 |
| Veto LLD | 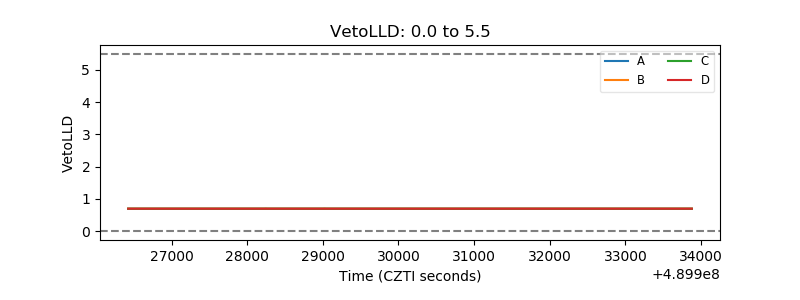 |
| Alpha Counter | 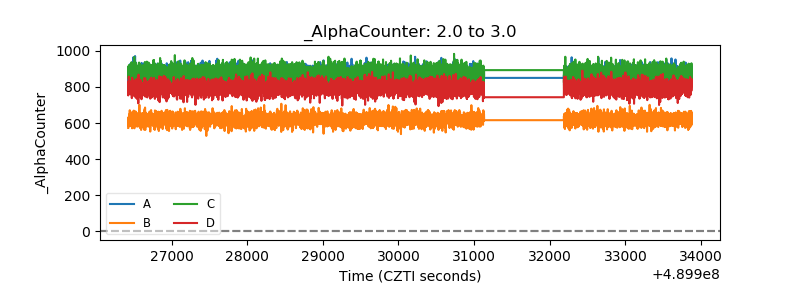 |
| _CPM_Rate | 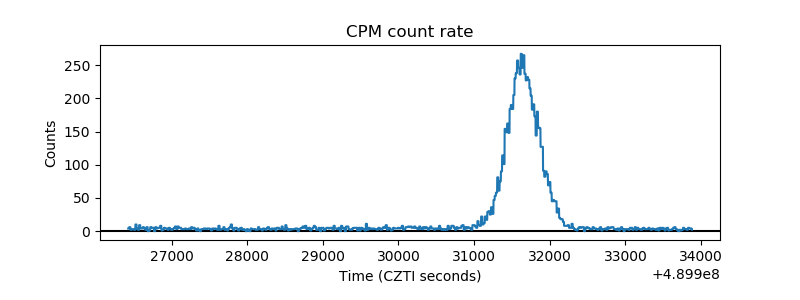 |
| CZT Counter | 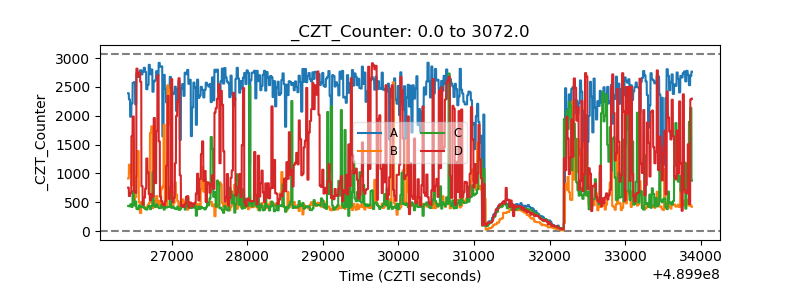 |
| +2.5 Volts monitor |  |
| +5 Volts monitor | 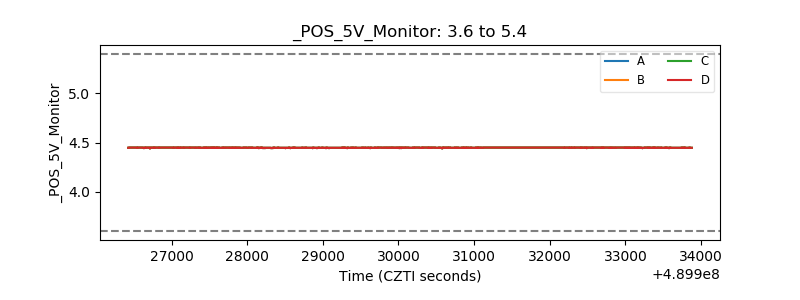 |
| _ROLL_ROT | 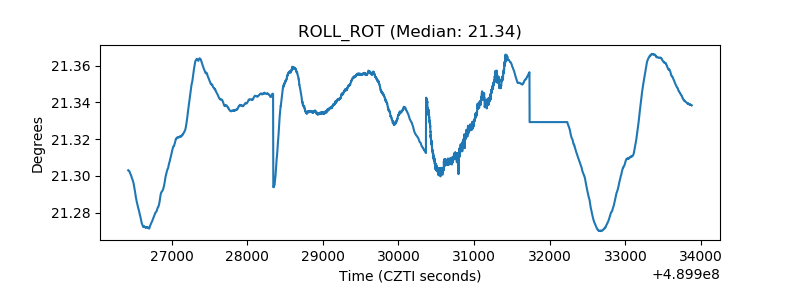 |
| _Roll_DEC | 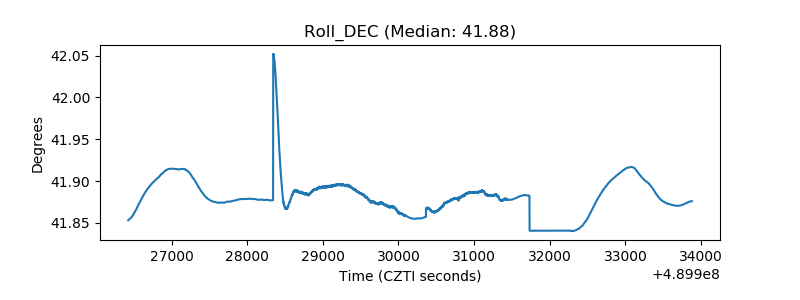 |
| _Roll_RA | 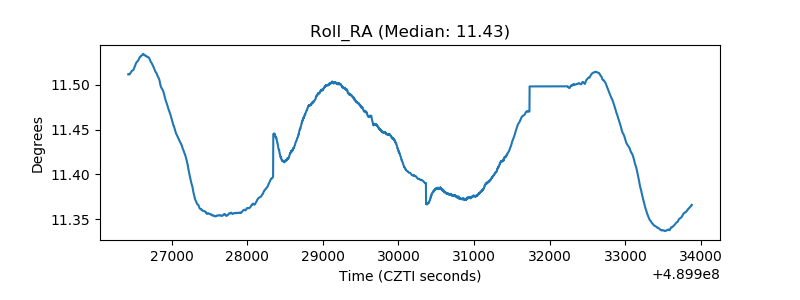 |
| Veto Counter | 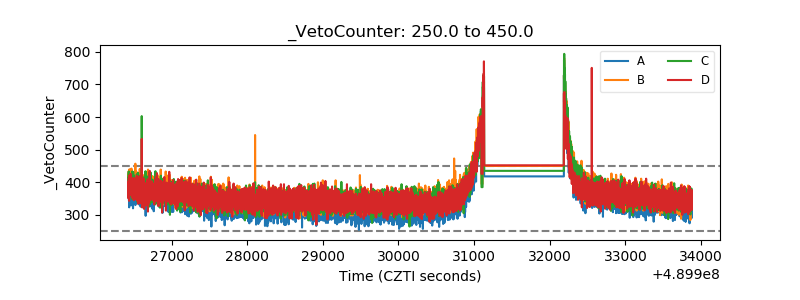 |