| Param | Original file | Final file |
|---|---|---|
| Filename | modeM0/AS1A13_003T01_9000006486_52936cztM0_level2.fits | modeM0/AS1A13_003T01_9000006486_52936cztM0_level2_quad_clean.evt |
| Size (bytes) | 1,184,811,840 | 72,054,720 |
| Size | 1.1 GB | 68.7 MB |
| Events in quadrant A | 18,331,429 | 12,527 |
| Events in quadrant B | 3,894,029 | 748,675 |
| Events in quadrant C | 7,838,901 | 575,793 |
| Events in quadrant D | 13,232,741 | 338,872 |
| Mode M9 | |||
|---|---|---|---|
| Quadrant | BADHDUFLAG | Total packets | Discarded packets |
| A | 0 | 5 | 0 |
| B | 0 | 5 | 0 |
| C | 0 | 5 | 0 |
| D | 0 | 5 | 0 |
| Mode M0 | |||
|---|---|---|---|
| Quadrant | BADHDUFLAG | Total packets | Discarded packets |
| A | 0 | 59442 | 0 |
| B | 0 | 16551 | 0 |
| C | 0 | 28252 | 0 |
| D | 0 | 44352 | 0 |
| Mode SS | |||
|---|---|---|---|
| Quadrant | BADHDUFLAG | Total packets | Discarded packets |
| A | 0 | 146 | 0 |
| B | 0 | 146 | 0 |
| C | 0 | 146 | 0 |
| D | 0 | 146 | 0 |
| Quadrant | Total seconds | Saturated seconds | Saturation percentage |
|---|---|---|---|
| A | 7265 | 7168 | 98.664831% |
| B | 7265 | 200 | 2.752925% |
| C | 7266 | 1210 | 16.652904% |
| D | 7266 | 3719 | 51.183595% |
Noise dominated data is calculated using 1-second bins in cleaned event files. If a bin has >2000 counts, and if more than 50% of those come from <1% of pixels, then it is considered to be noise-dominated and hence unusable.
| Quadrant | # 1 sec bins | Bins with >0 counts | Bins with >2000 counts | High rate bins dominated by noise | Noise dominated (total time) | Noise dominated (detector-on time) | Marked lightcurve |
|---|---|---|---|---|---|---|---|
| A | 7774 | 7264 | 6678 | 6678 | 85.90% | 91.93% | 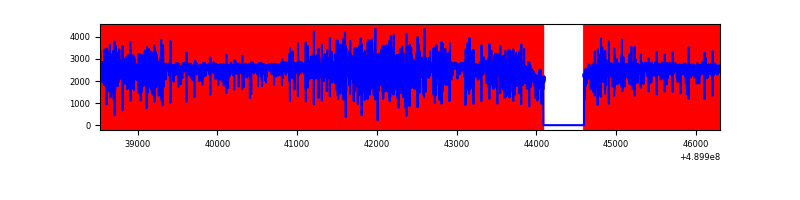 |
| B | 7775 | 7266 | 19 | 19 | 0.24% | 0.26% | 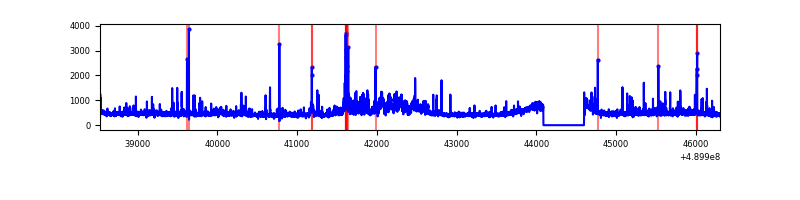 |
| C | 7776 | 7267 | 979 | 979 | 12.59% | 13.47% | 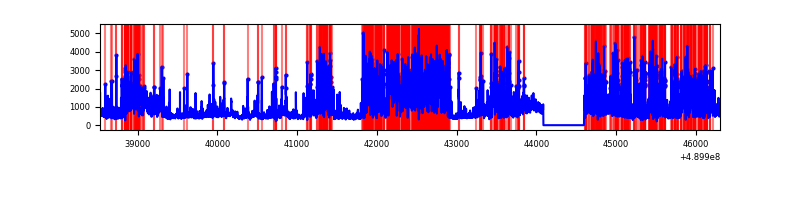 |
| D | 7775 | 7265 | 3069 | 3069 | 39.47% | 42.24% | 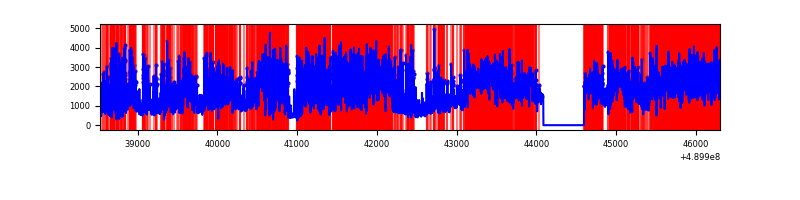 |
Top three noisy pixels from each quadrant. If the there are fewer than three noisy pixels in the level2.evt file, extra rows are filled as -1
| Pixel properties | Quadrant properties | ||||||
|---|---|---|---|---|---|---|---|
| Quadrant | DetID | PixID | Counts | Sigma | Mean | Median | Sigma |
| A | 9 | 191 | 16905043 | 244796.28 | 273 | 266 | 69.1 |
| A | 4 | 254 | 144599 | 2090.07 | 273 | 266 | 69.1 |
| A | 4 | 238 | 38141 | 548.46 | 273 | 266 | 69.1 |
| B | 10 | 254 | 378554 | 2228.21 | 796 | 769 | 169.5 |
| B | 4 | 81 | 67646 | 394.45 | 796 | 769 | 169.5 |
| B | 1 | 255 | 60842 | 354.32 | 796 | 769 | 169.5 |
| C | 7 | 80 | 1884089 | 9393.43 | 736 | 730 | 200.5 |
| C | 15 | 224 | 1423250 | 7094.95 | 736 | 730 | 200.5 |
| C | 1 | 109 | 515720 | 2568.56 | 736 | 730 | 200.5 |
| D | 6 | 42 | 3355536 | 19133.02 | 612 | 583 | 175.3 |
| D | 8 | 176 | 2442239 | 13924.56 | 612 | 583 | 175.3 |
| D | 15 | 78 | 2399718 | 13682.07 | 612 | 583 | 175.3 |
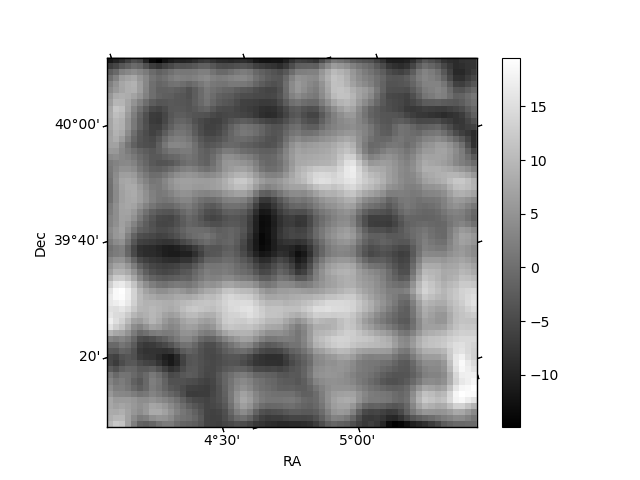
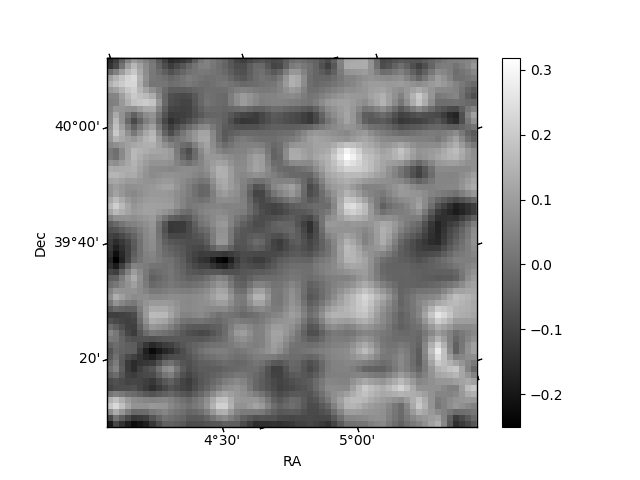
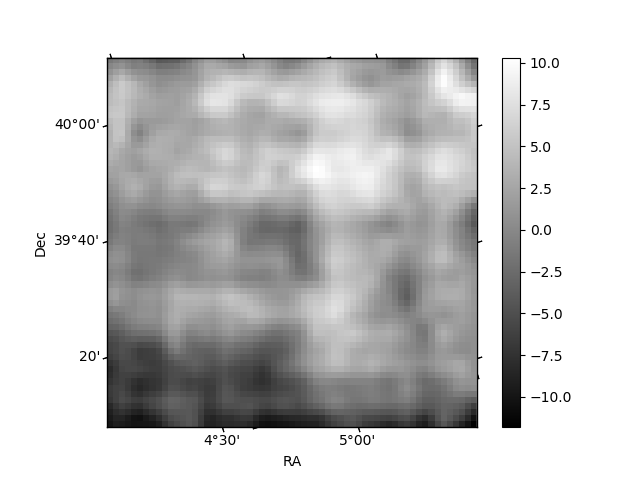
Histogram calculated using DETX and DETY for each event in the final _common_clean file
| Quadrant A | 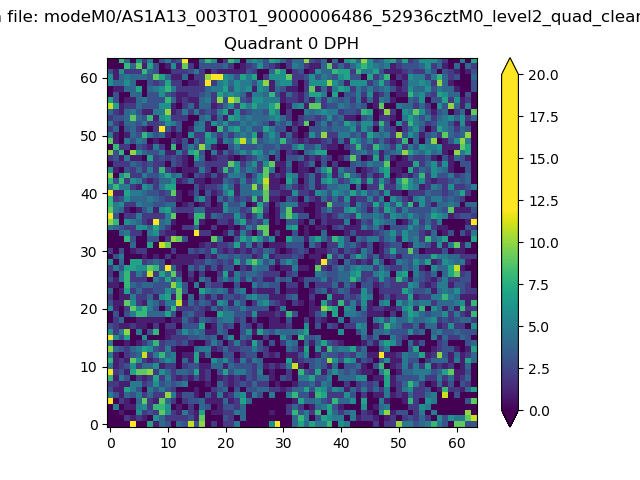 |
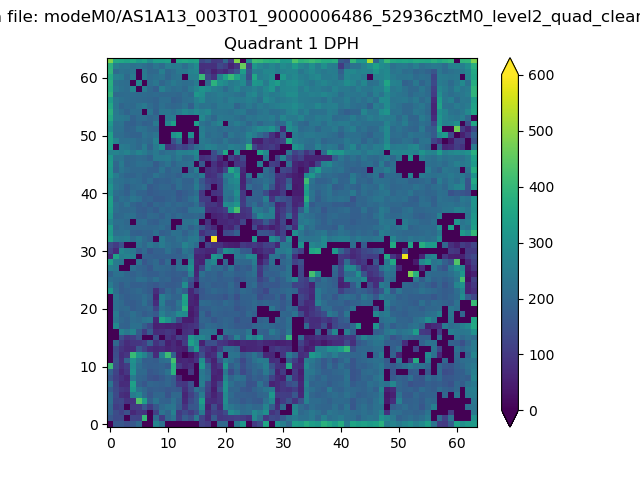 |
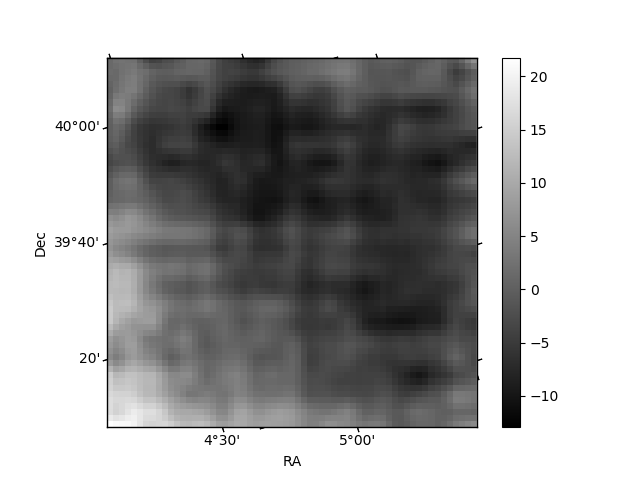
Quadrant B |
|---|---|---|---|
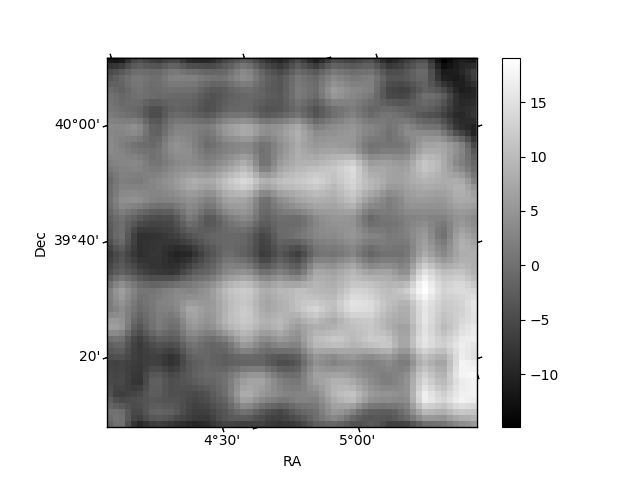
| Quadrant D | 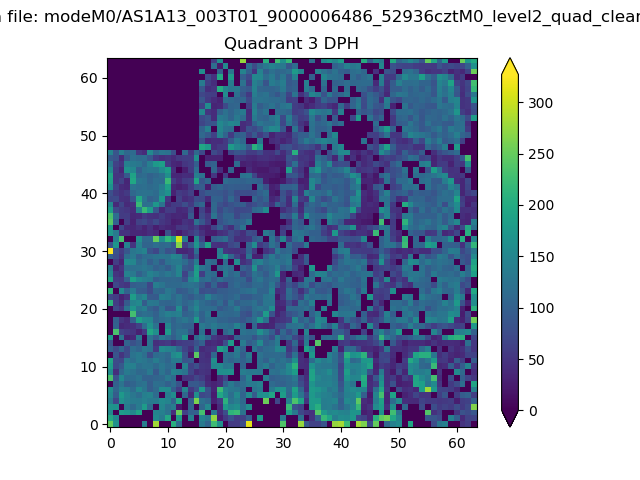 |
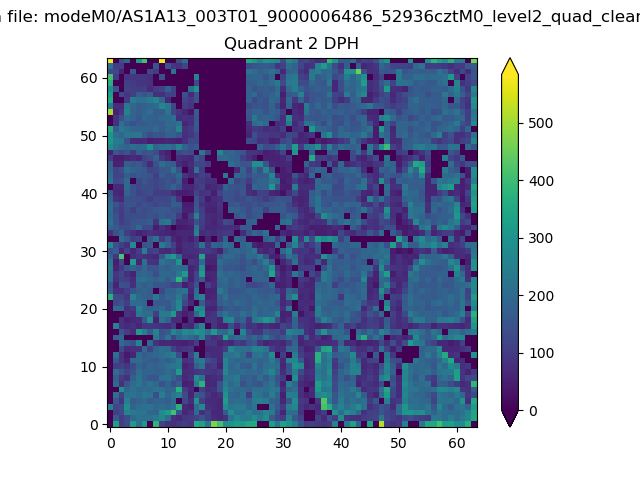 |
Quadrant C |
| Plot type | Count rate plots | Images |
|---|---|---|
| Comparison with Poisson distribution Blue bars denote a histogram of data divided into 1 sec bins. Red curve is a Poisson curve with rate = median count rate of data. |
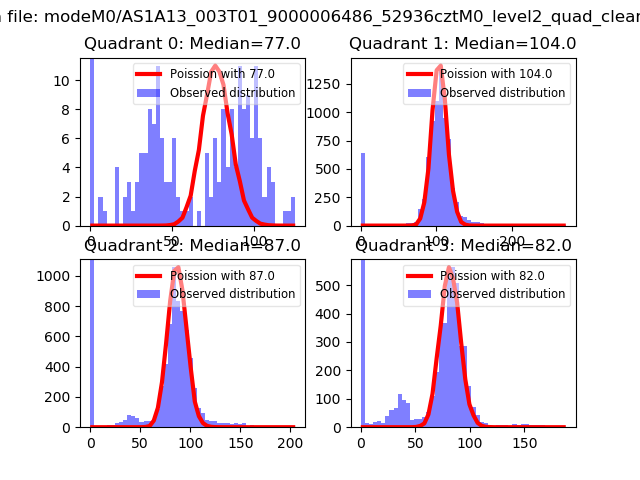 |
 |
| Quadrant-wise count rates Data is divided into 100 sec bins |
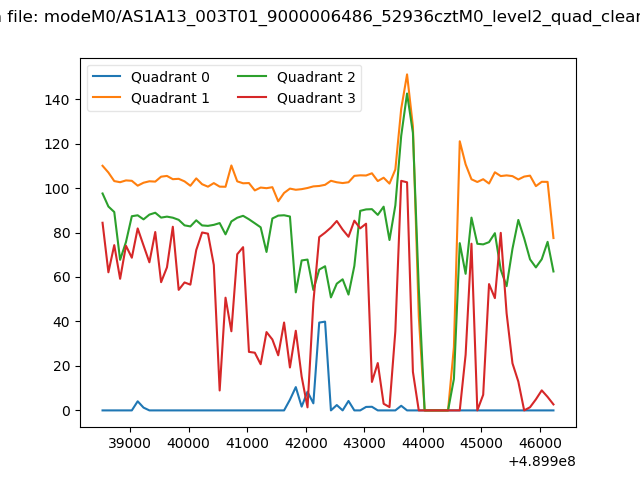 |
|
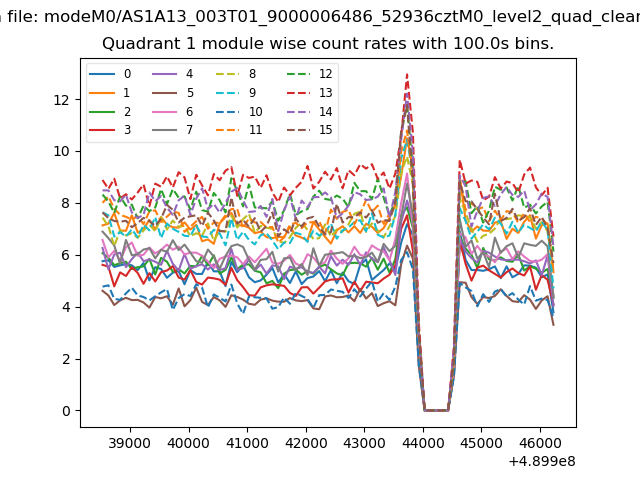
| Module-wise count rates for Quadrant A Data is divided into 100 sec bins |
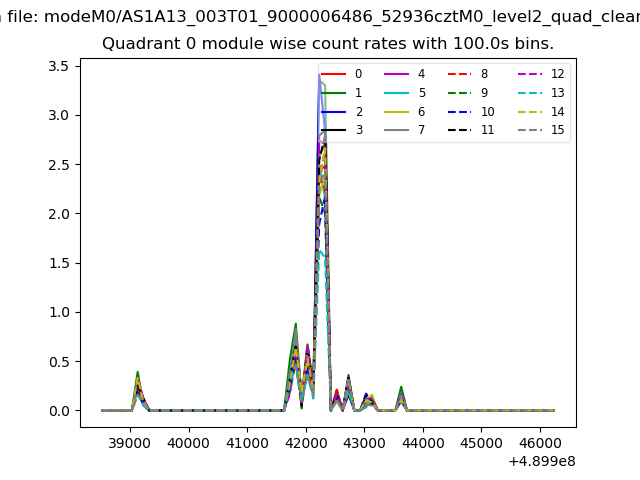 |
 |
| Module-wise count rates for Quadrant B Data is divided into 100 sec bins |
 |
 |
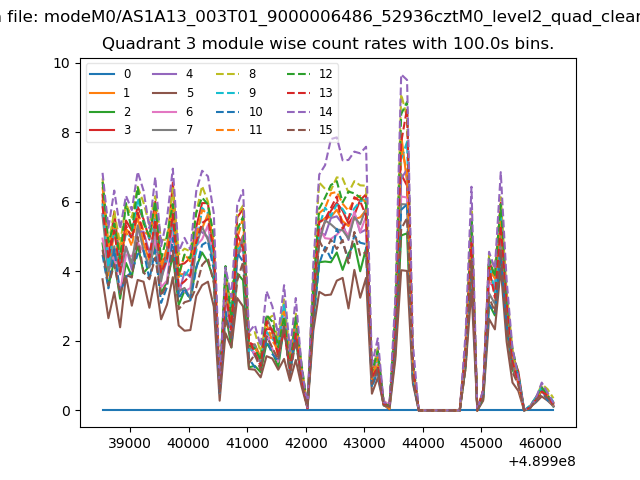
| Module-wise count rates for Quadrant C Data is divided into 100 sec bins |
 |
 |
| Module-wise count rates for Quadrant D Data is divided into 100 sec bins |
 |
 |
| Parameter | Plot |
|---|---|
| CZT HV Monitor | 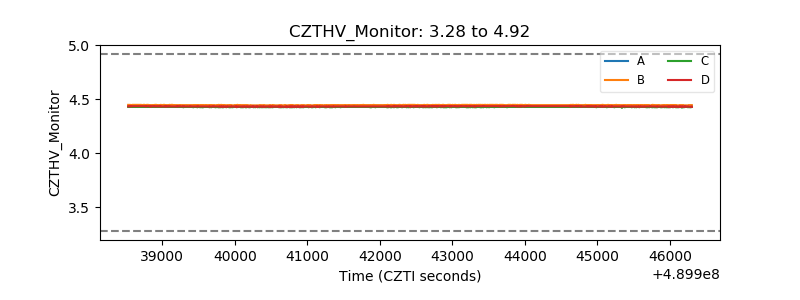 |
| D_VDD | 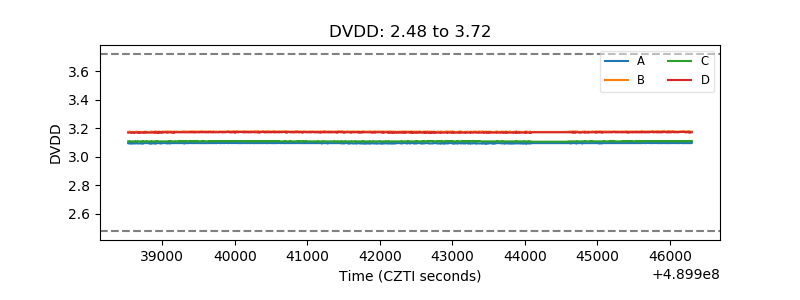 |
| Temperature 1 | 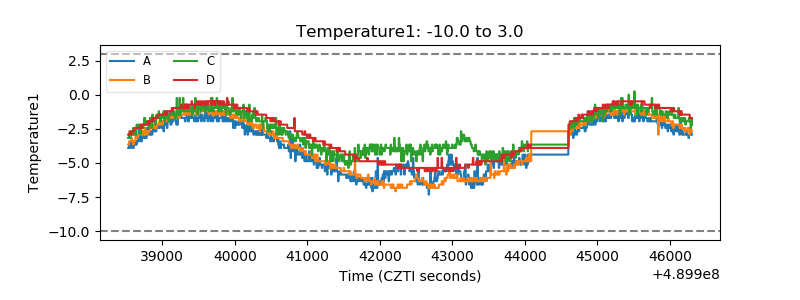 |
| Veto HV Monitor |  |
| Veto LLD | 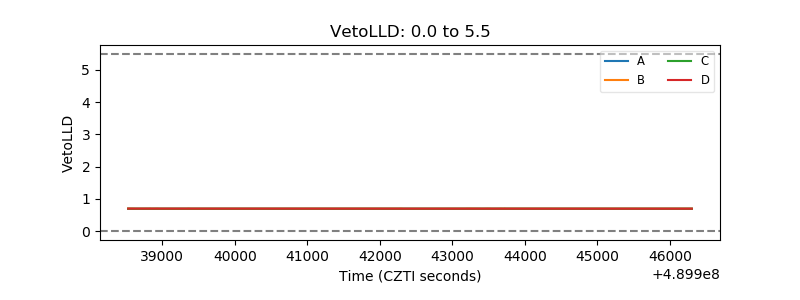 |
| Alpha Counter | 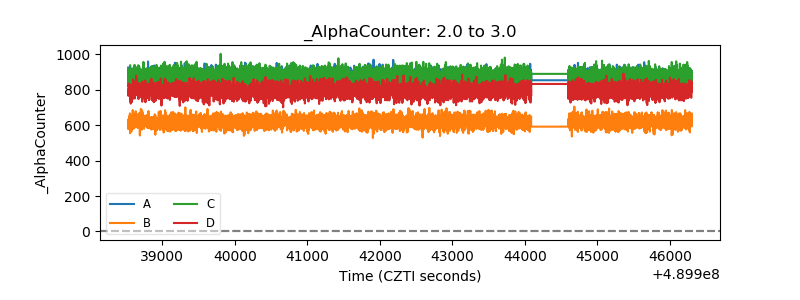 |
| _CPM_Rate | 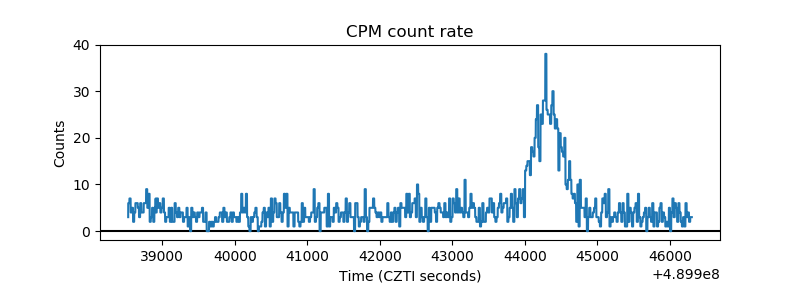 |
| CZT Counter | 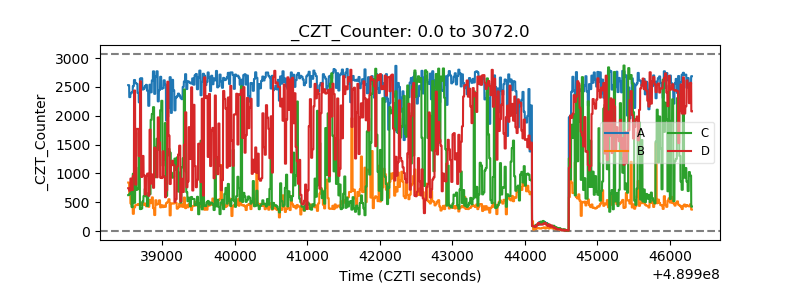 |
| +2.5 Volts monitor |  |
| +5 Volts monitor |  |
| _ROLL_ROT | 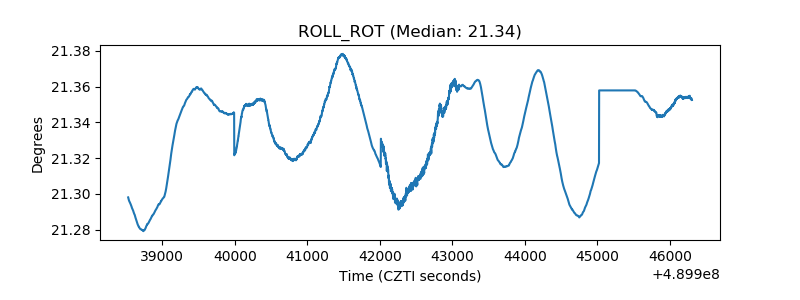 |
| _Roll_DEC | 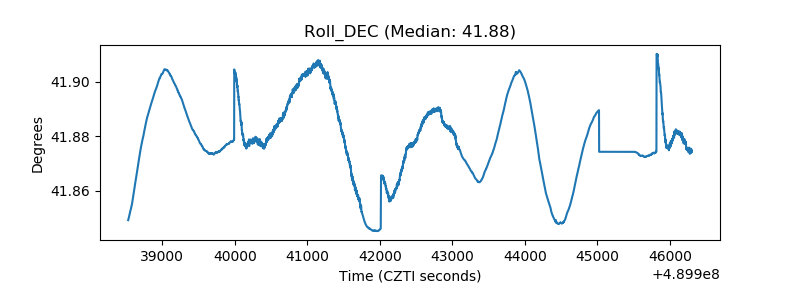 |
| _Roll_RA | 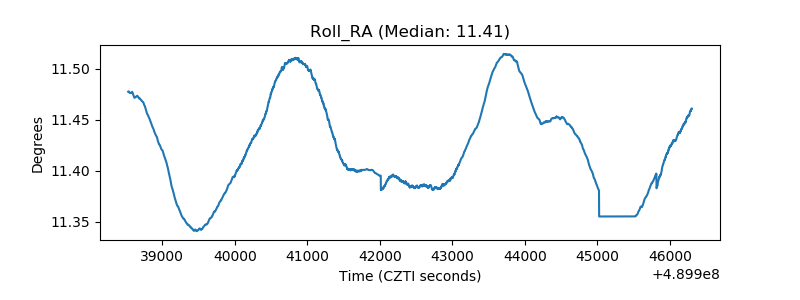 |
| Veto Counter | 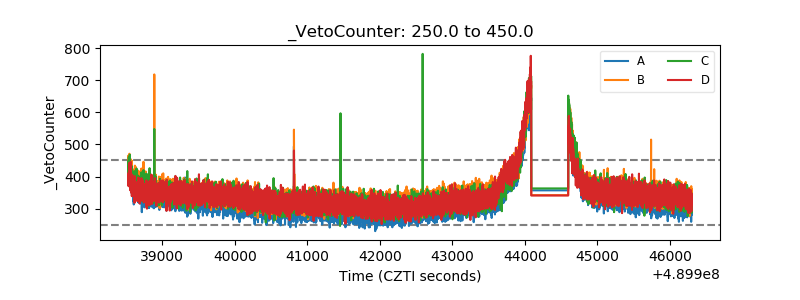 |