| Param | Original file | Final file |
|---|---|---|
| Filename | modeM0/AS1A13_003T01_9000006486_52937cztM0_level2.fits | modeM0/AS1A13_003T01_9000006486_52937cztM0_level2_quad_clean.evt |
| Size (bytes) | 1,047,772,800 | 71,637,120 |
| Size | 999.2 MB | 68.3 MB |
| Events in quadrant A | 17,258,697 | 15,983 |
| Events in quadrant B | 3,705,060 | 709,334 |
| Events in quadrant C | 5,087,243 | 593,024 |
| Events in quadrant D | 12,198,630 | 367,874 |
| Mode M0 | |||
|---|---|---|---|
| Quadrant | BADHDUFLAG | Total packets | Discarded packets |
| A | 0 | 55898 | 1 |
| B | 0 | 15827 | 2 |
| C | 0 | 19981 | 1 |
| D | 0 | 41041 | 1 |
| Mode SS | |||
|---|---|---|---|
| Quadrant | BADHDUFLAG | Total packets | Discarded packets |
| A | 0 | 138 | 0 |
| B | 0 | 138 | 0 |
| C | 0 | 138 | 0 |
| D | 0 | 138 | 0 |
| Quadrant | Total seconds | Saturated seconds | Saturation percentage |
|---|---|---|---|
| A | 6925 | 6819 | 98.469314% |
| B | 6925 | 211 | 3.046931% |
| C | 6925 | 420 | 6.064982% |
| D | 6925 | 3112 | 44.938628% |
Noise dominated data is calculated using 1-second bins in cleaned event files. If a bin has >2000 counts, and if more than 50% of those come from <1% of pixels, then it is considered to be noise-dominated and hence unusable.
| Quadrant | # 1 sec bins | Bins with >0 counts | Bins with >2000 counts | High rate bins dominated by noise | Noise dominated (total time) | Noise dominated (detector-on time) | Marked lightcurve |
|---|---|---|---|---|---|---|---|
| A | 6939 | 6924 | 6218 | 6218 | 89.61% | 89.80% | 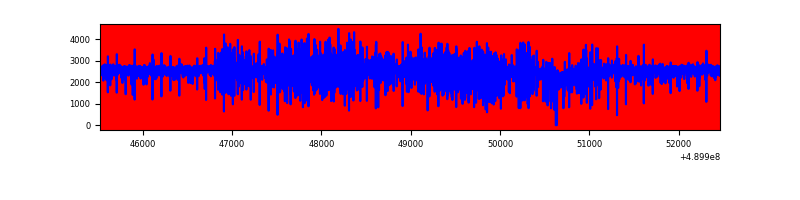 |
| B | 6940 | 6926 | 46 | 46 | 0.66% | 0.66% | 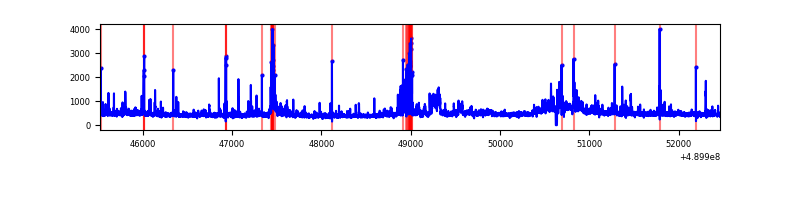 |
| C | 6940 | 6926 | 306 | 306 | 4.41% | 4.42% | 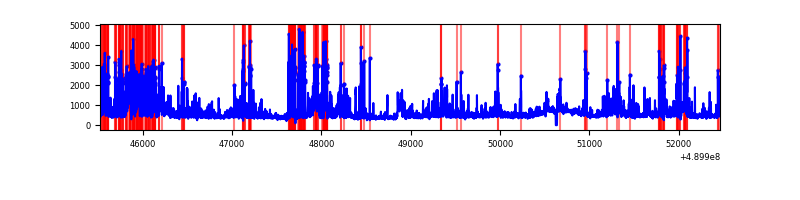 |
| D | 6940 | 6926 | 2549 | 2549 | 36.73% | 36.80% | 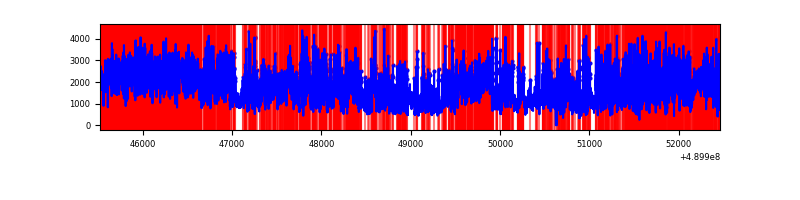 |
Top three noisy pixels from each quadrant. If the there are fewer than three noisy pixels in the level2.evt file, extra rows are filled as -1
| Pixel properties | Quadrant properties | ||||||
|---|---|---|---|---|---|---|---|
| Quadrant | DetID | PixID | Counts | Sigma | Mean | Median | Sigma |
| A | 9 | 191 | 15665089 | 220827.88 | 280 | 273 | 70.9 |
| A | 4 | 238 | 103020 | 1448.43 | 280 | 273 | 70.9 |
| A | 5 | 241 | 96300 | 1353.7 | 280 | 273 | 70.9 |
| B | 10 | 254 | 208221 | 1298.68 | 753 | 727 | 159.8 |
| B | 1 | 239 | 143198 | 891.71 | 753 | 727 | 159.8 |
| B | 4 | 81 | 74464 | 461.51 | 753 | 727 | 159.8 |
| C | 9 | 38 | 465636 | 2364.52 | 723 | 716 | 196.6 |
| C | 7 | 80 | 444675 | 2257.92 | 723 | 716 | 196.6 |
| C | 1 | 109 | 424201 | 2153.79 | 723 | 716 | 196.6 |
| D | 15 | 78 | 3833226 | 21611.9 | 622 | 594 | 177.3 |
| D | 6 | 42 | 2971338 | 16751.78 | 622 | 594 | 177.3 |
| D | 8 | 176 | 1655407 | 9331.35 | 622 | 594 | 177.3 |
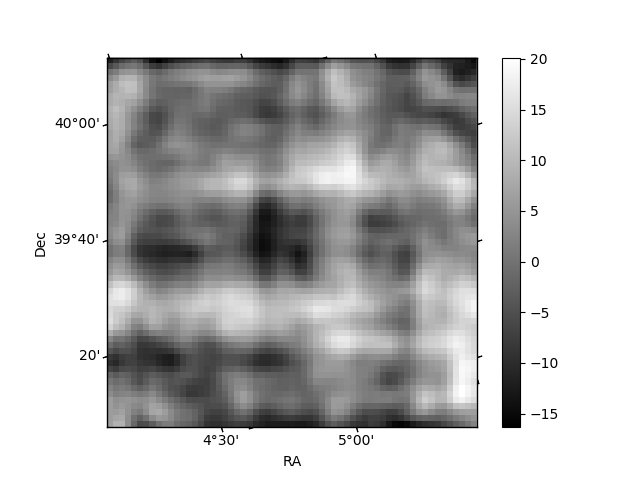
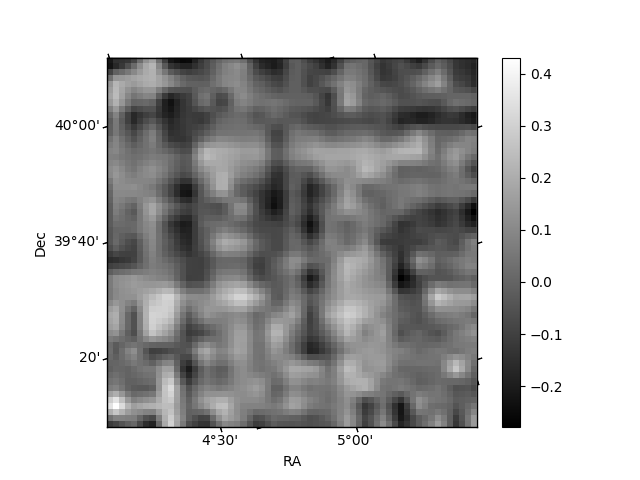
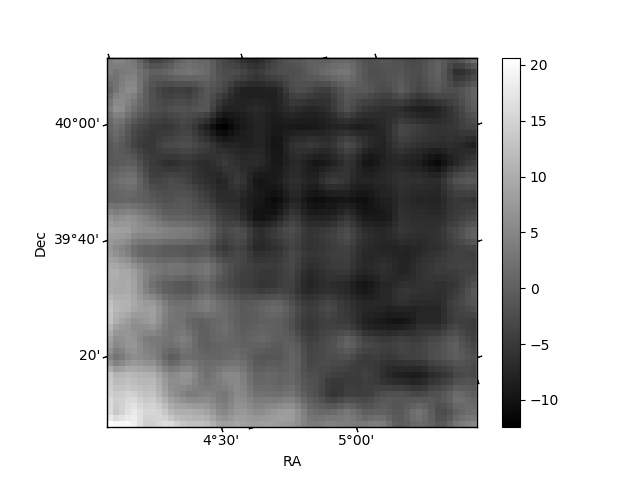
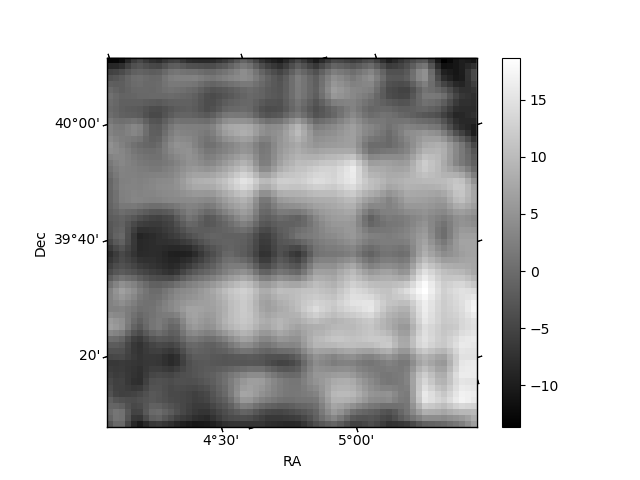
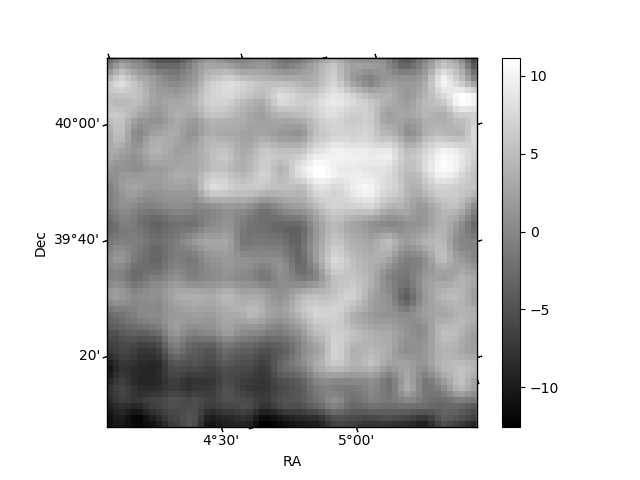
Histogram calculated using DETX and DETY for each event in the final _common_clean file
| Quadrant A | 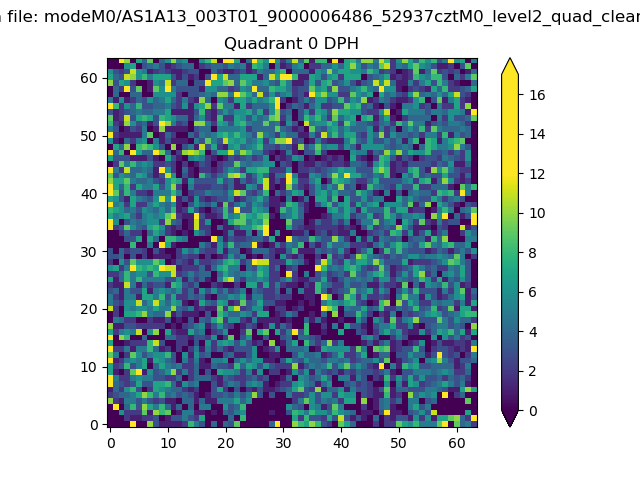 |
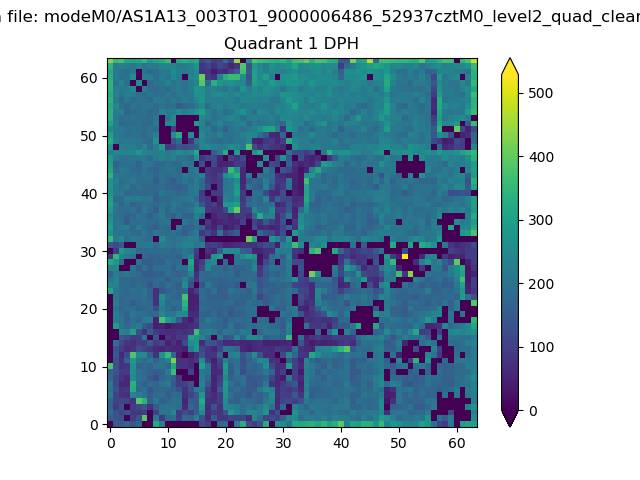 |
Quadrant B |
|---|---|---|---|
| Quadrant D | 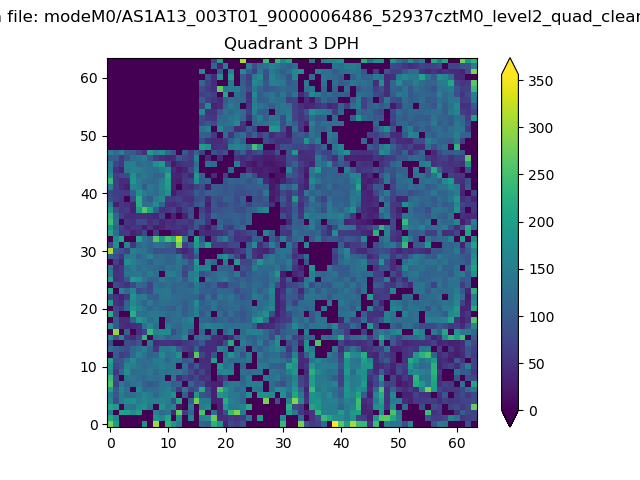 |
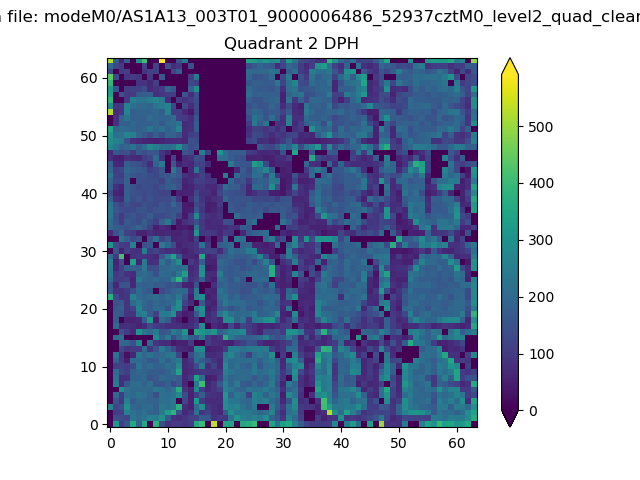 |
Quadrant C |
| Plot type | Count rate plots | Images |
|---|---|---|
| Comparison with Poisson distribution Blue bars denote a histogram of data divided into 1 sec bins. Red curve is a Poisson curve with rate = median count rate of data. |
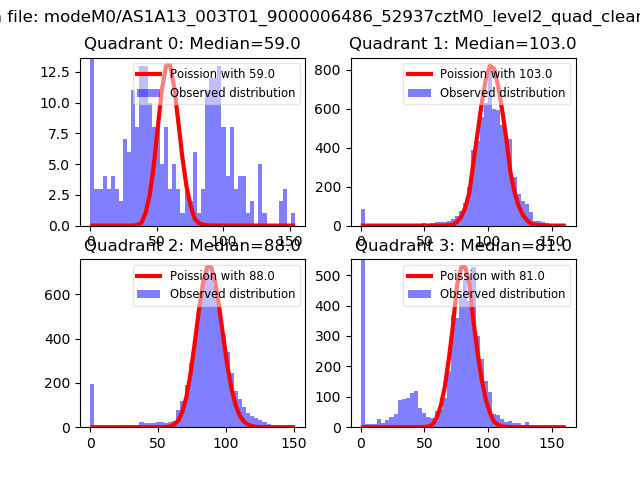 |
 |
| Quadrant-wise count rates Data is divided into 100 sec bins |
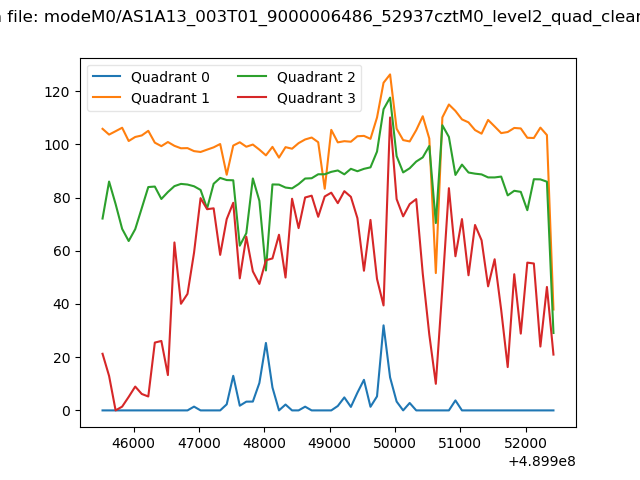 |
|
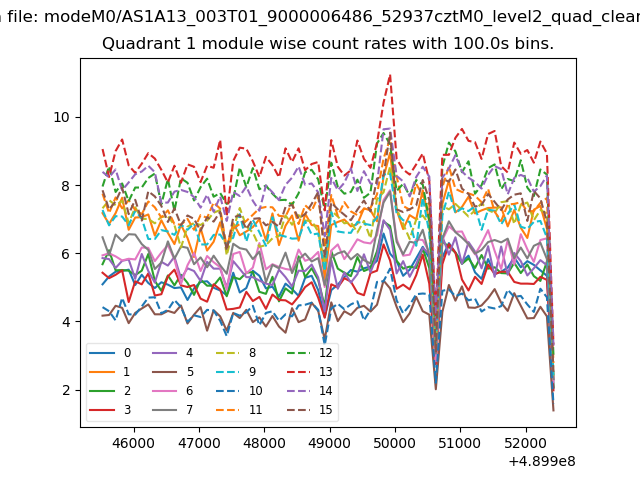
| Module-wise count rates for Quadrant A Data is divided into 100 sec bins |
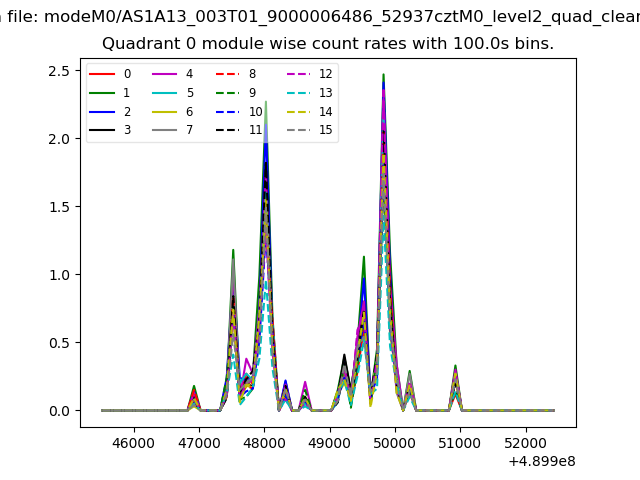 |
 |
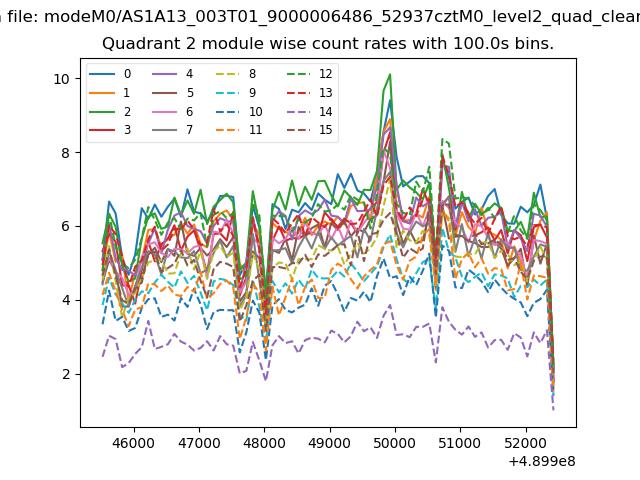
| Module-wise count rates for Quadrant B Data is divided into 100 sec bins |
 |
 |
| Module-wise count rates for Quadrant C Data is divided into 100 sec bins |
 |
 |
| Module-wise count rates for Quadrant D Data is divided into 100 sec bins |
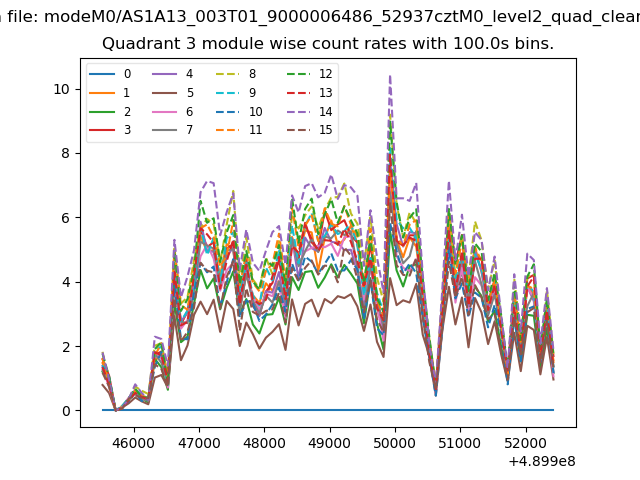 |
 |
| Parameter | Plot |
|---|---|
| CZT HV Monitor | 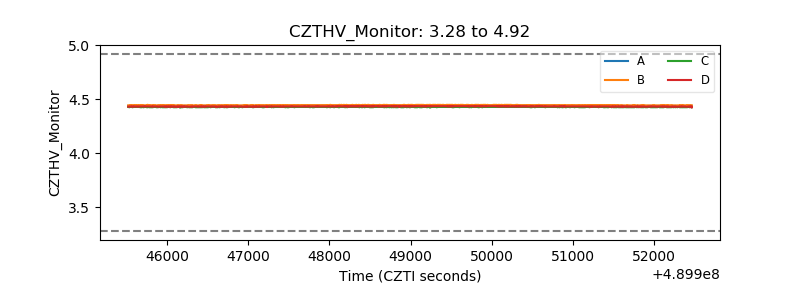 |
| D_VDD | 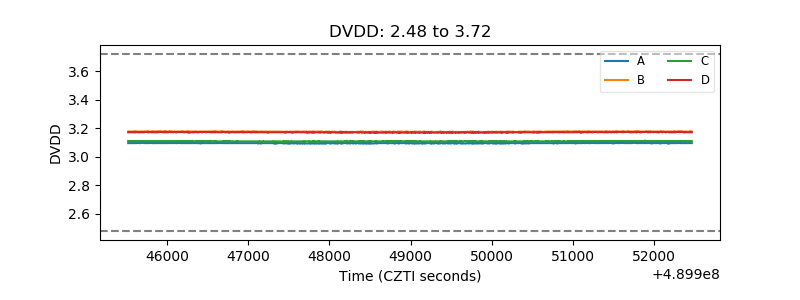 |
| Temperature 1 | 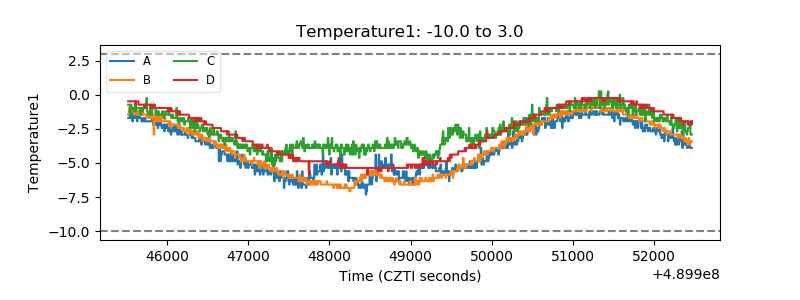 |
| Veto HV Monitor | 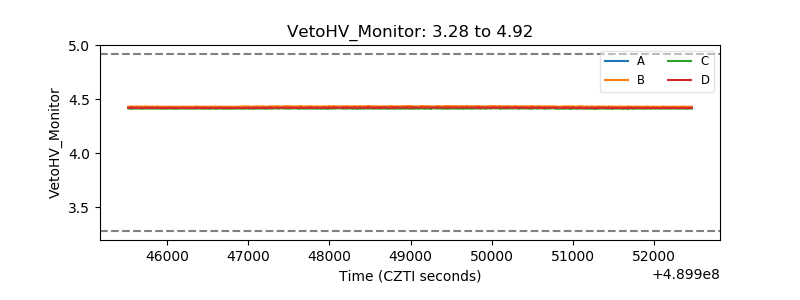 |
| Veto LLD | 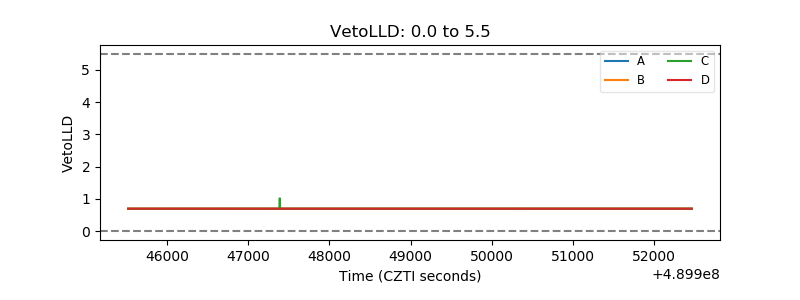 |
| Alpha Counter | 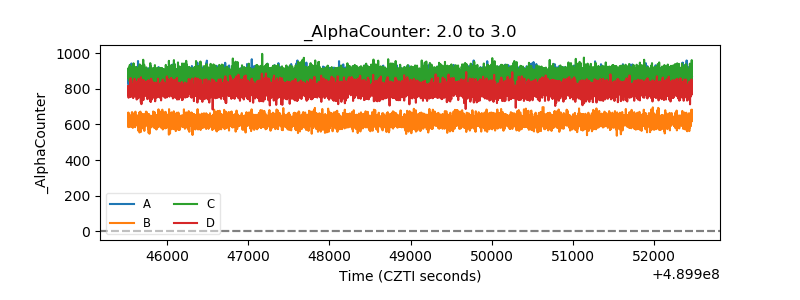 |
| _CPM_Rate | 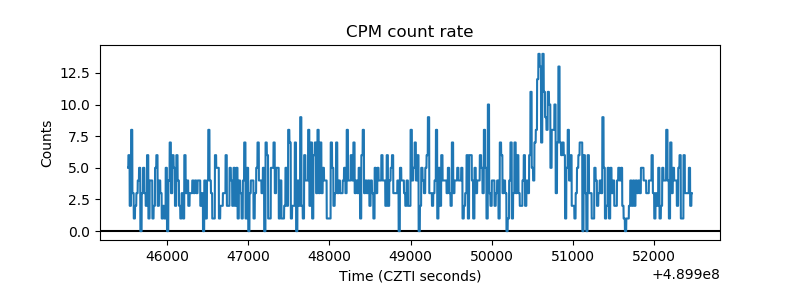 |
| CZT Counter | 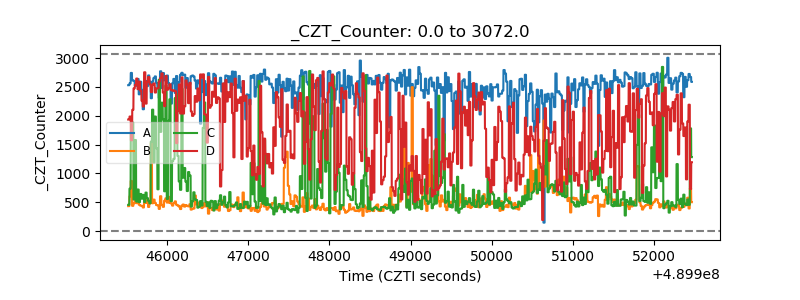 |
| +2.5 Volts monitor |  |
| +5 Volts monitor |  |
| _ROLL_ROT | 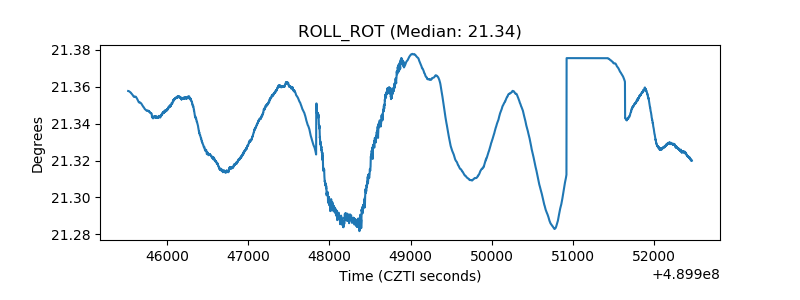 |
| _Roll_DEC | 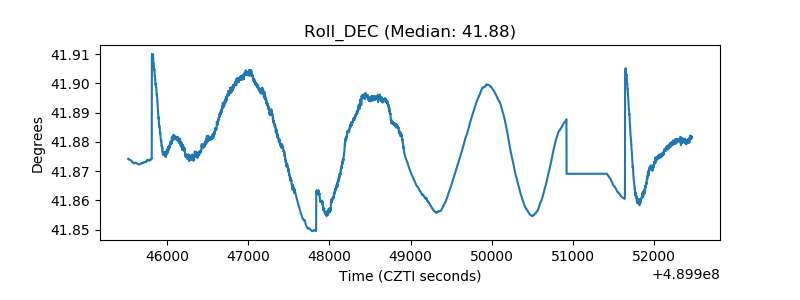 |
| _Roll_RA | 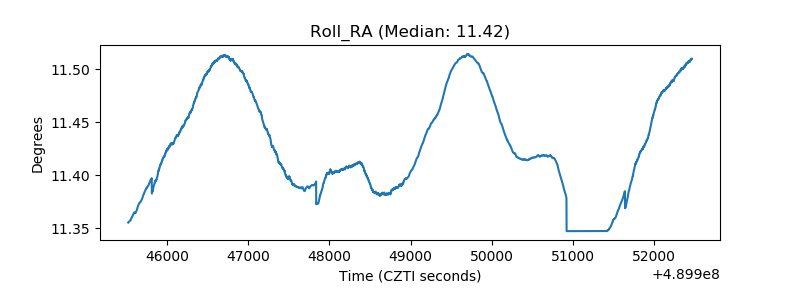 |
| Veto Counter | 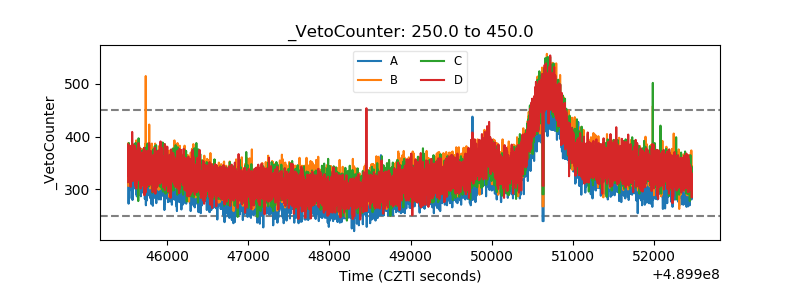 |