| Param | Original file | Final file |
|---|---|---|
| Filename | modeM0/AS1A13_003T01_9000006486_52938cztM0_level2.fits | modeM0/AS1A13_003T01_9000006486_52938cztM0_level2_quad_clean.evt |
| Size (bytes) | 1,060,905,600 | 80,144,640 |
| Size | 1011.8 MB | 76.4 MB |
| Events in quadrant A | 17,758,118 | 85,663 |
| Events in quadrant B | 4,279,169 | 755,072 |
| Events in quadrant C | 4,725,164 | 644,843 |
| Events in quadrant D | 11,938,041 | 427,122 |
| Mode M0 | |||
|---|---|---|---|
| Quadrant | BADHDUFLAG | Total packets | Discarded packets |
| A | 0 | 57799 | 2 |
| B | 0 | 17823 | 0 |
| C | 0 | 19110 | 0 |
| D | 0 | 40627 | 0 |
| Mode SS | |||
|---|---|---|---|
| Quadrant | BADHDUFLAG | Total packets | Discarded packets |
| A | 0 | 146 | 0 |
| B | 0 | 146 | 0 |
| C | 0 | 146 | 0 |
| D | 0 | 146 | 0 |
| Quadrant | Total seconds | Saturated seconds | Saturation percentage |
|---|---|---|---|
| A | 7382 | 6602 | 89.433758% |
| B | 7383 | 173 | 2.343221% |
| C | 7383 | 171 | 2.316132% |
| D | 7383 | 2807 | 38.019775% |
Noise dominated data is calculated using 1-second bins in cleaned event files. If a bin has >2000 counts, and if more than 50% of those come from <1% of pixels, then it is considered to be noise-dominated and hence unusable.
| Quadrant | # 1 sec bins | Bins with >0 counts | Bins with >2000 counts | High rate bins dominated by noise | Noise dominated (total time) | Noise dominated (detector-on time) | Marked lightcurve |
|---|---|---|---|---|---|---|---|
| A | 7381 | 7381 | 6138 | 6138 | 83.16% | 83.16% | 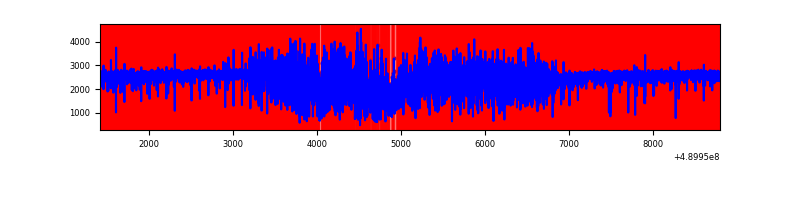 |
| B | 7383 | 7383 | 92 | 92 | 1.25% | 1.25% | 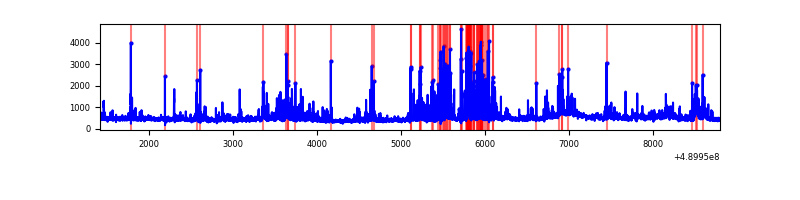 |
| C | 7383 | 7383 | 149 | 149 | 2.02% | 2.02% | 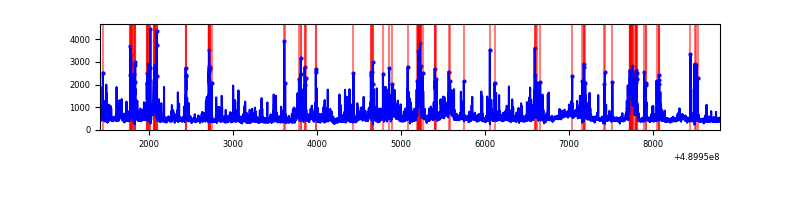 |
| D | 7383 | 7383 | 2152 | 2152 | 29.15% | 29.15% | 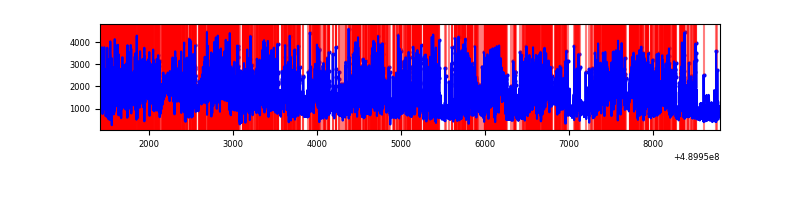 |
Top three noisy pixels from each quadrant. If the there are fewer than three noisy pixels in the level2.evt file, extra rows are filled as -1
| Pixel properties | Quadrant properties | ||||||
|---|---|---|---|---|---|---|---|
| Quadrant | DetID | PixID | Counts | Sigma | Mean | Median | Sigma |
| A | 9 | 191 | 15392137 | 178179.88 | 338 | 329 | 86.4 |
| A | 4 | 238 | 675832 | 7819.81 | 338 | 329 | 86.4 |
| A | 4 | 249 | 93733 | 1081.27 | 338 | 329 | 86.4 |
| B | 1 | 239 | 557251 | 3286.85 | 790 | 762 | 169.3 |
| B | 8 | 3 | 164456 | 966.84 | 790 | 762 | 169.3 |
| B | 1 | 255 | 99797 | 584.94 | 790 | 762 | 169.3 |
| C | 15 | 224 | 525087 | 2508.19 | 767 | 761 | 209.0 |
| C | 10 | 19 | 217487 | 1036.74 | 767 | 761 | 209.0 |
| C | 9 | 38 | 212111 | 1011.02 | 767 | 761 | 209.0 |
| D | 8 | 176 | 4264239 | 22618.85 | 658 | 629 | 188.5 |
| D | 15 | 78 | 3892259 | 20645.46 | 658 | 629 | 188.5 |
| D | 2 | 249 | 256511 | 1357.48 | 658 | 629 | 188.5 |
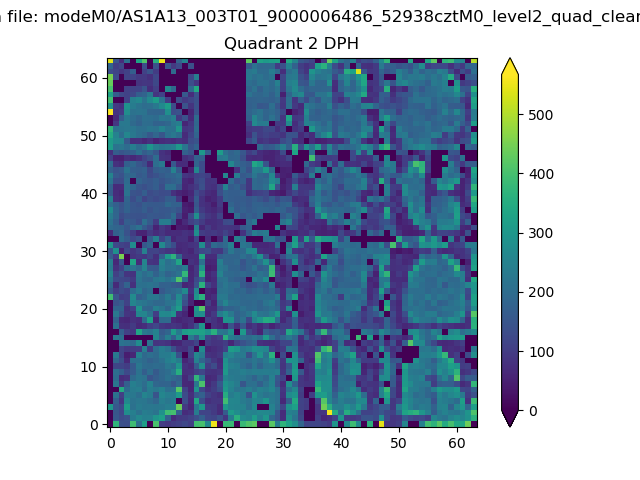
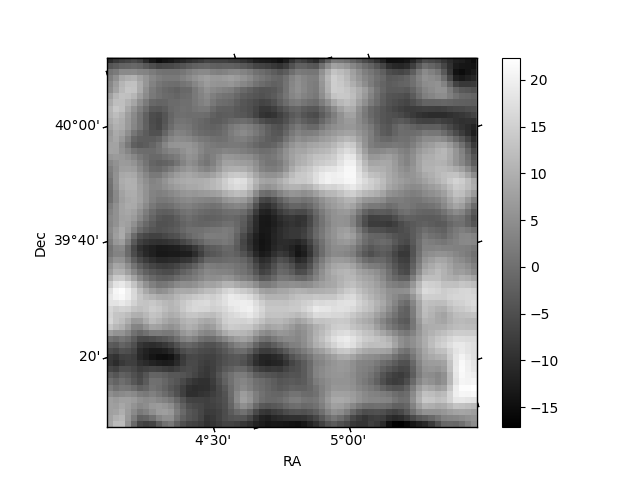
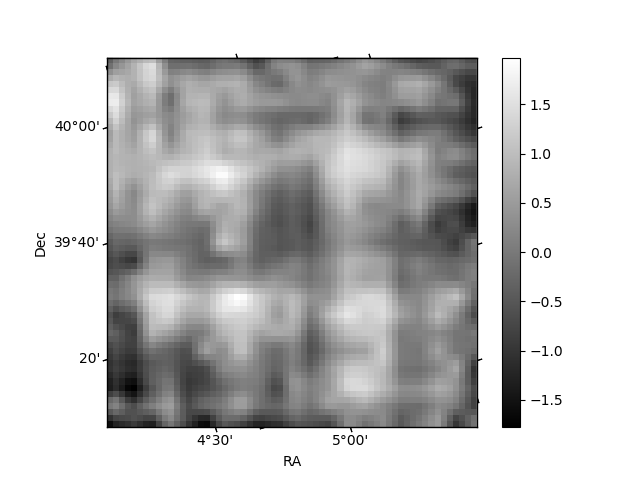
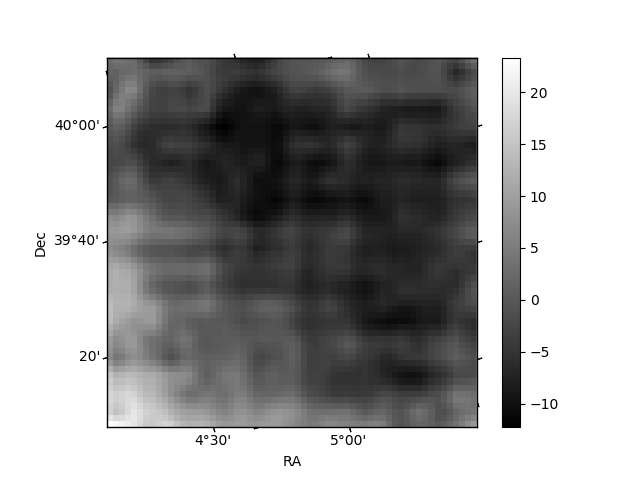
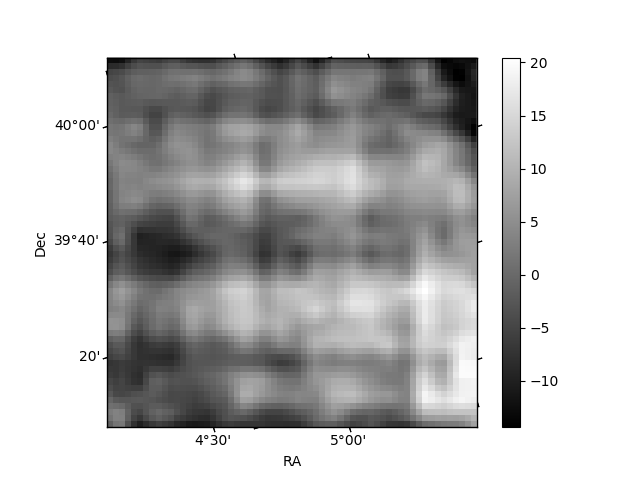
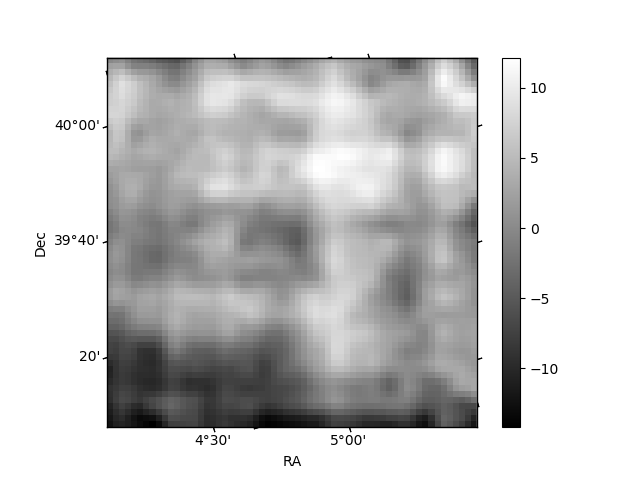
Histogram calculated using DETX and DETY for each event in the final _common_clean file
| Quadrant A | 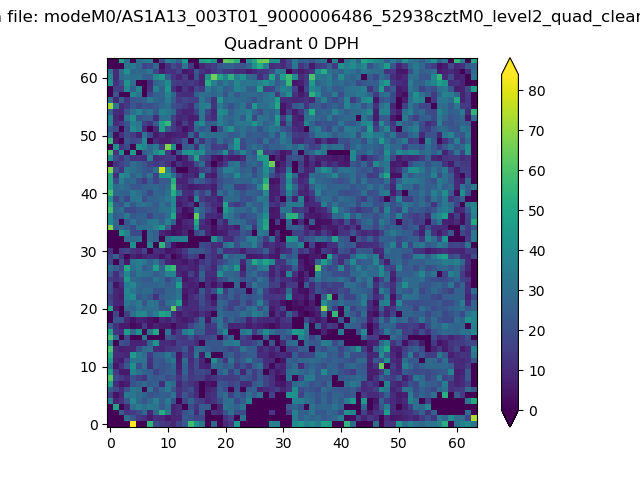 |
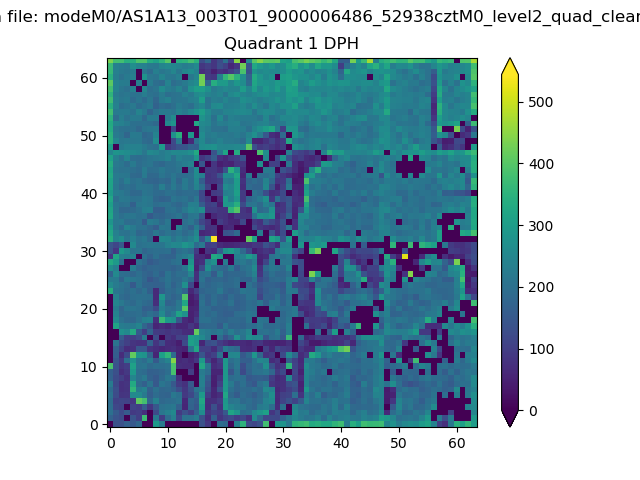 |
Quadrant B |
|---|---|---|---|
| Quadrant D | 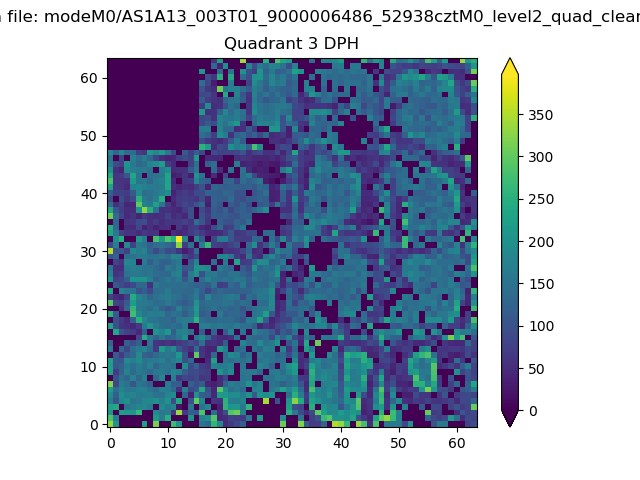 |
 |
Quadrant C |
| Plot type | Count rate plots | Images |
|---|---|---|
| Comparison with Poisson distribution Blue bars denote a histogram of data divided into 1 sec bins. Red curve is a Poisson curve with rate = median count rate of data. |
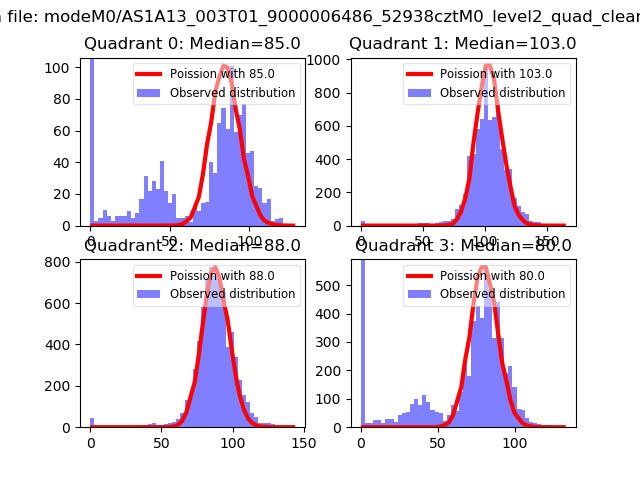 |
 |
| Quadrant-wise count rates Data is divided into 100 sec bins |
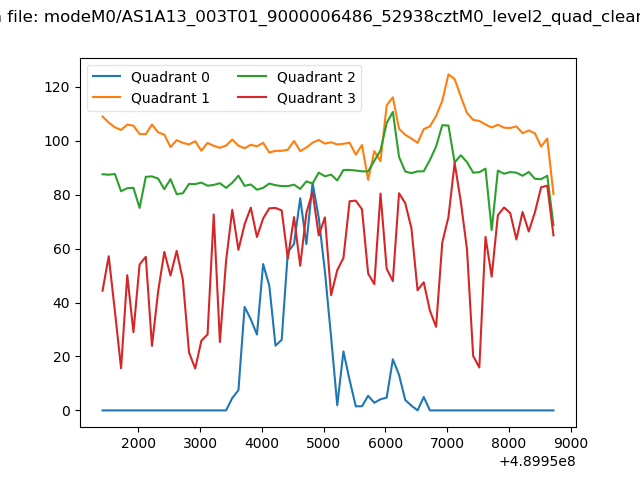 |
|
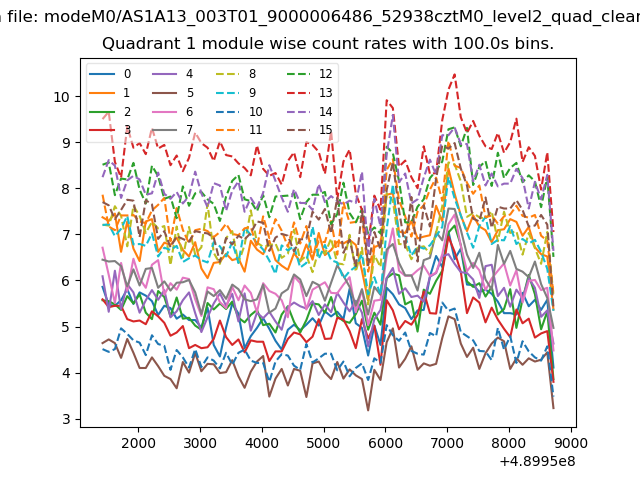
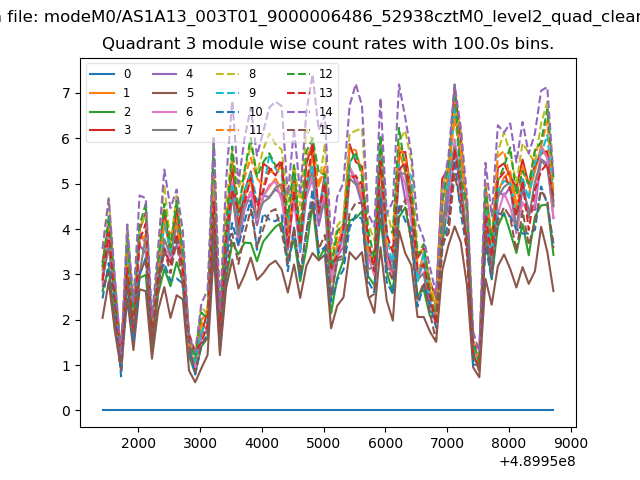
| Module-wise count rates for Quadrant A Data is divided into 100 sec bins |
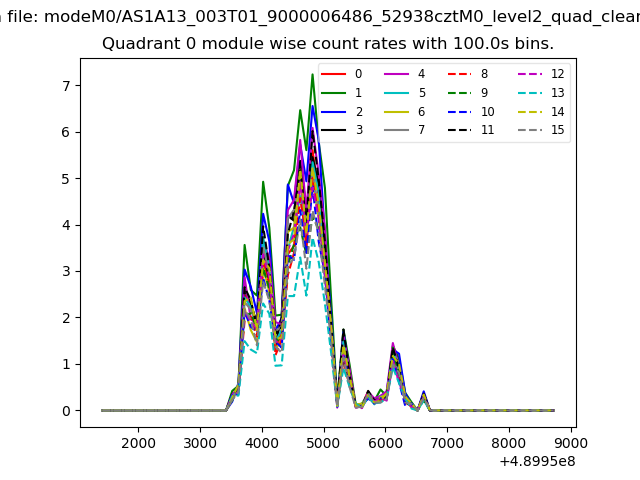 |
 |
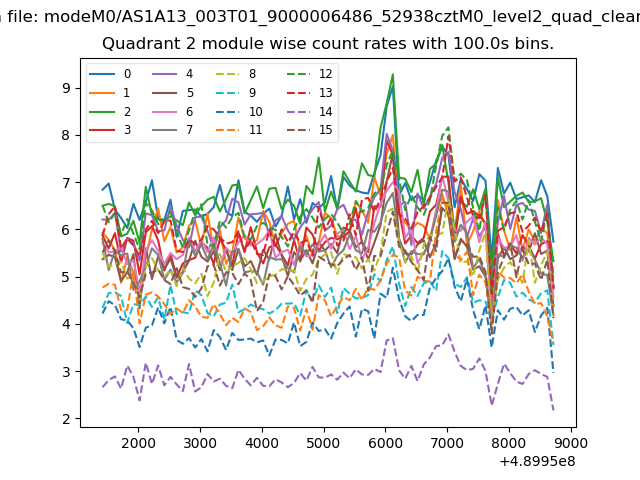
| Module-wise count rates for Quadrant B Data is divided into 100 sec bins |
 |
 |
| Module-wise count rates for Quadrant C Data is divided into 100 sec bins |
 |
 |
| Module-wise count rates for Quadrant D Data is divided into 100 sec bins |
 |
 |
| Parameter | Plot |
|---|---|
| CZT HV Monitor | 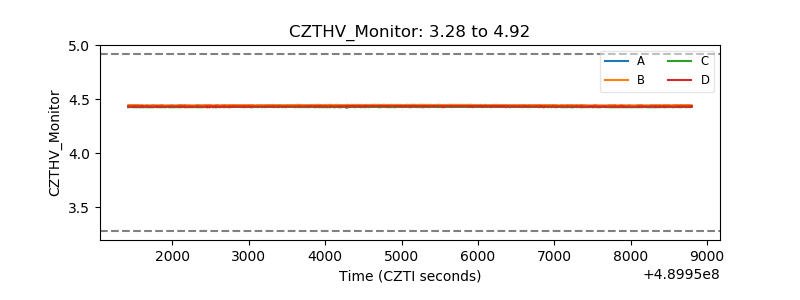 |
| D_VDD | 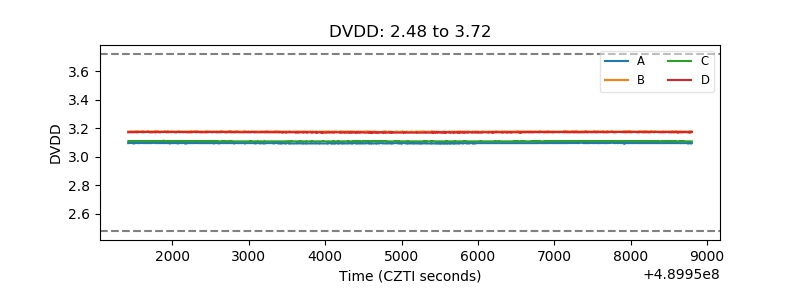 |
| Temperature 1 | 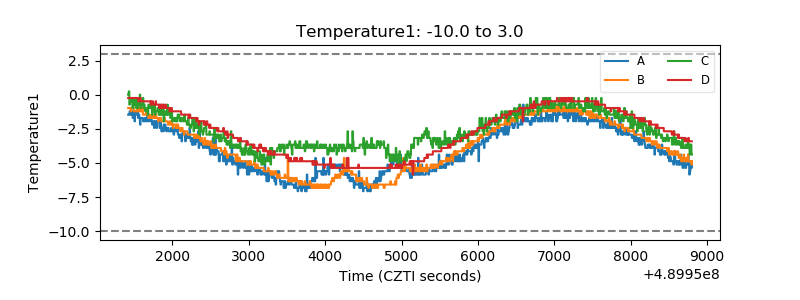 |
| Veto HV Monitor | 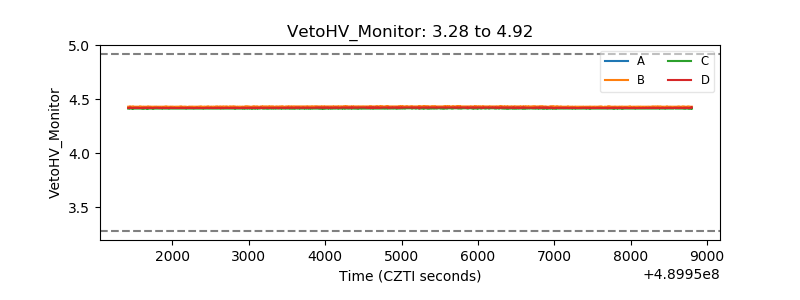 |
| Veto LLD | 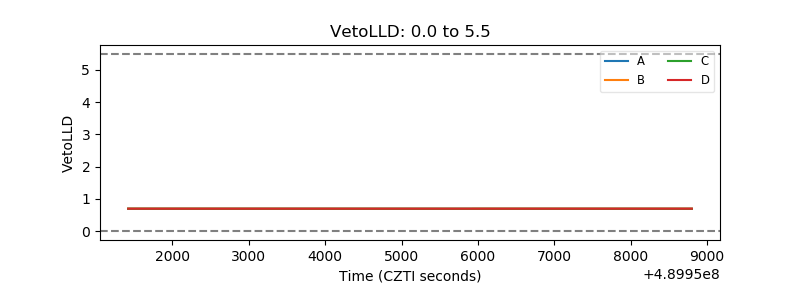 |
| Alpha Counter | 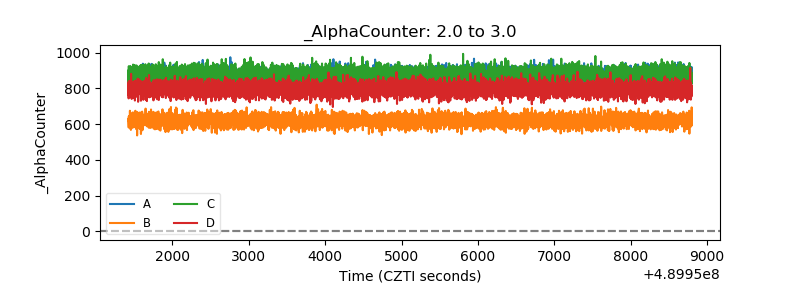 |
| _CPM_Rate | 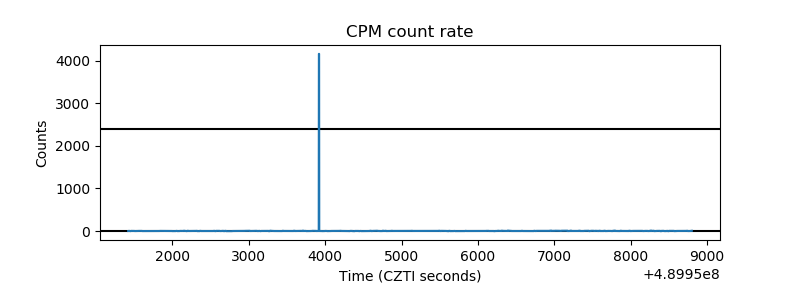 |
| CZT Counter | 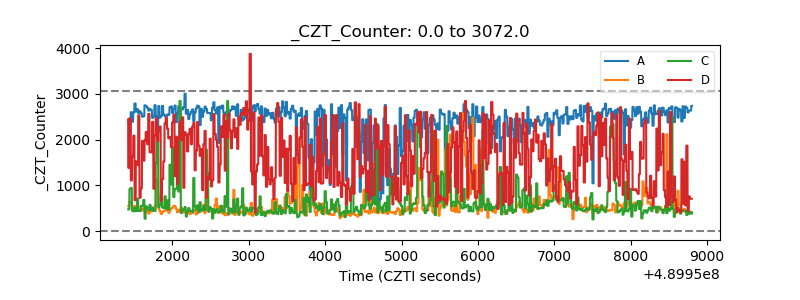 |
| +2.5 Volts monitor | 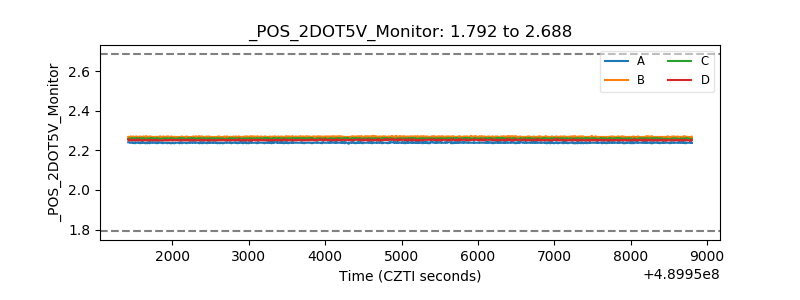 |
| +5 Volts monitor | 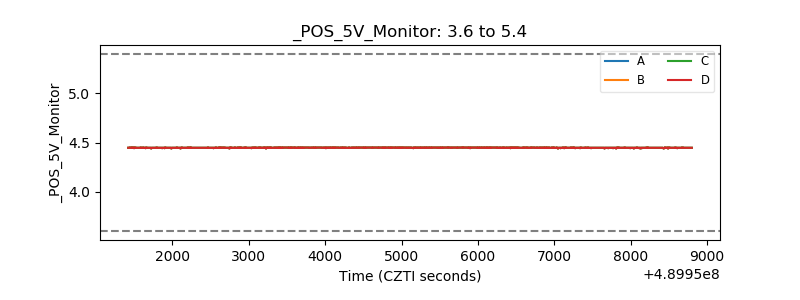 |
| _ROLL_ROT | 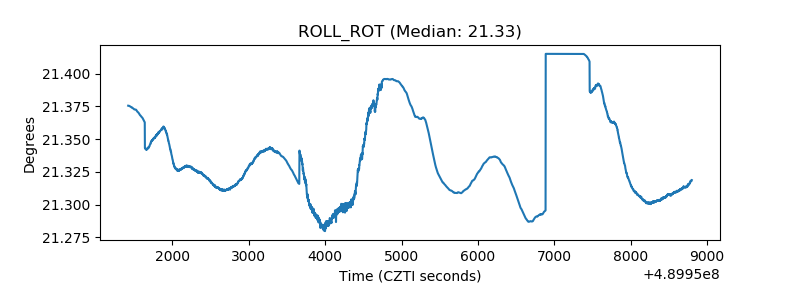 |
| _Roll_DEC | 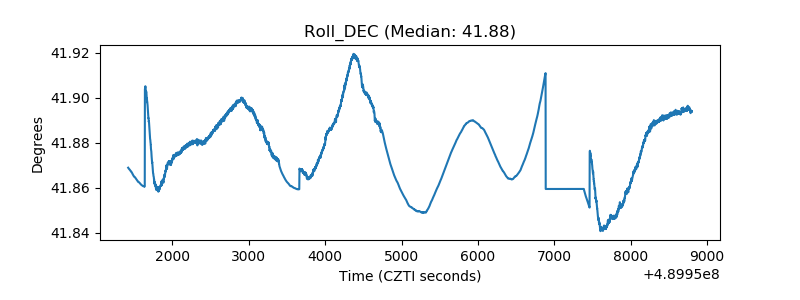 |
| _Roll_RA | 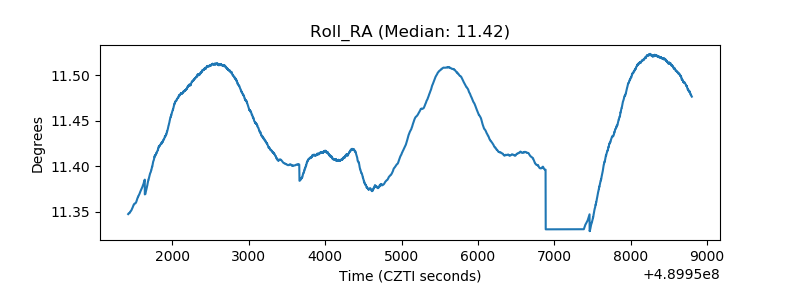 |
| Veto Counter | 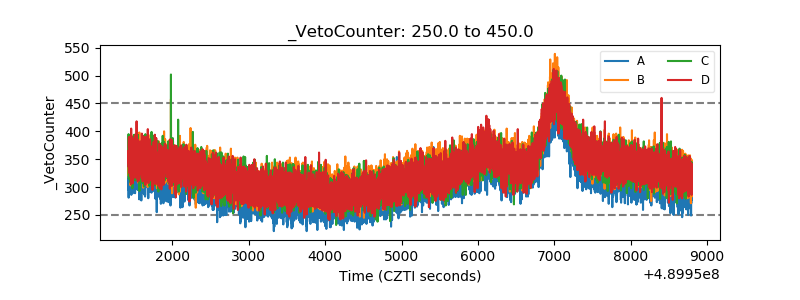 |