| Param | Original file | Final file |
|---|---|---|
| Filename | modeM0/AS1A13_003T01_9000006486_52943cztM0_level2.fits | modeM0/AS1A13_003T01_9000006486_52943cztM0_level2_quad_clean.evt |
| Size (bytes) | 976,936,320 | 63,973,440 |
| Size | 931.7 MB | 61.0 MB |
| Events in quadrant A | 15,666,036 | 7,070 |
| Events in quadrant B | 2,807,656 | 656,604 |
| Events in quadrant C | 11,576,954 | 325,542 |
| Events in quadrant D | 5,637,257 | 518,496 |
| Mode M9 | |||
|---|---|---|---|
| Quadrant | BADHDUFLAG | Total packets | Discarded packets |
| A | 0 | 9 | 0 |
| B | 0 | 9 | 0 |
| C | 0 | 9 | 0 |
| D | 0 | 9 | 0 |
| Mode M0 | |||
|---|---|---|---|
| Quadrant | BADHDUFLAG | Total packets | Discarded packets |
| A | 0 | 50734 | 6 |
| B | 0 | 13044 | 1 |
| C | 0 | 38689 | 1 |
| D | 0 | 21061 | 1 |
| Mode SS | |||
|---|---|---|---|
| Quadrant | BADHDUFLAG | Total packets | Discarded packets |
| A | 0 | 124 | 0 |
| B | 0 | 124 | 0 |
| C | 0 | 124 | 0 |
| D | 0 | 124 | 0 |
| Quadrant | Total seconds | Saturated seconds | Saturation percentage |
|---|---|---|---|
| A | 6148 | 6099 | 99.202993% |
| B | 6148 | 44 | 0.715680% |
| C | 6149 | 3022 | 49.146203% |
| D | 6149 | 495 | 8.050089% |
Noise dominated data is calculated using 1-second bins in cleaned event files. If a bin has >2000 counts, and if more than 50% of those come from <1% of pixels, then it is considered to be noise-dominated and hence unusable.
| Quadrant | # 1 sec bins | Bins with >0 counts | Bins with >2000 counts | High rate bins dominated by noise | Noise dominated (total time) | Noise dominated (detector-on time) | Marked lightcurve |
|---|---|---|---|---|---|---|---|
| A | 7073 | 6148 | 5842 | 5842 | 82.60% | 95.02% | 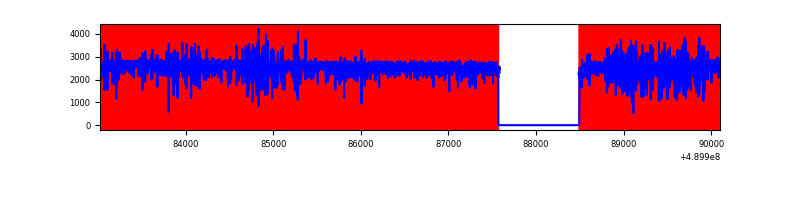 |
| B | 7073 | 6149 | 13 | 13 | 0.18% | 0.21% | 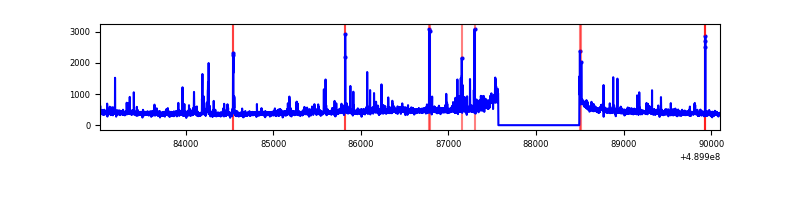 |
| C | 7074 | 6149 | 2871 | 2871 | 40.59% | 46.69% | 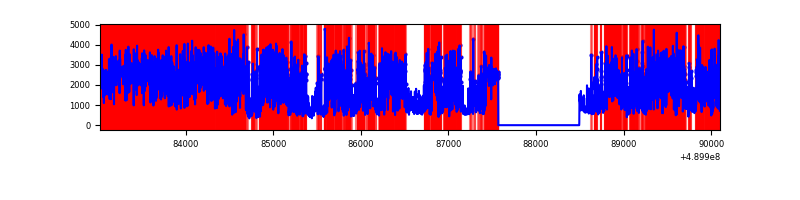 |
| D | 7074 | 6150 | 436 | 436 | 6.16% | 7.09% | 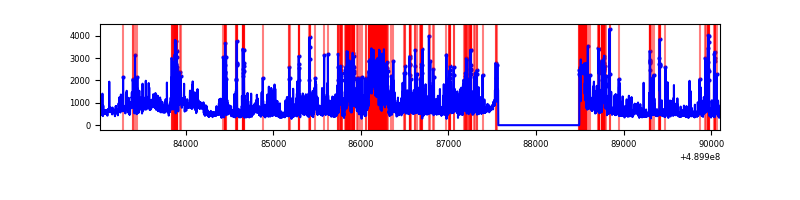 |
Top three noisy pixels from each quadrant. If the there are fewer than three noisy pixels in the level2.evt file, extra rows are filled as -1
| Pixel properties | Quadrant properties | ||||||
|---|---|---|---|---|---|---|---|
| Quadrant | DetID | PixID | Counts | Sigma | Mean | Median | Sigma |
| A | 9 | 191 | 14145877 | 249250.14 | 217 | 212 | 56.8 |
| A | 8 | 43 | 289671 | 5100.34 | 217 | 212 | 56.8 |
| A | 4 | 207 | 142876 | 2513.78 | 217 | 212 | 56.8 |
| B | 1 | 255 | 68532 | 486.43 | 643 | 621 | 139.6 |
| B | 8 | 3 | 33292 | 234.01 | 643 | 621 | 139.6 |
| B | 0 | 182 | 26949 | 188.58 | 643 | 621 | 139.6 |
| C | 15 | 254 | 5010998 | 37605.12 | 477 | 473 | 133.2 |
| C | 7 | 80 | 3142593 | 23582.31 | 477 | 473 | 133.2 |
| C | 4 | 177 | 551513 | 4135.68 | 477 | 473 | 133.2 |
| D | 15 | 78 | 1317933 | 7521.86 | 606 | 580 | 175.1 |
| D | 8 | 176 | 1271630 | 7257.48 | 606 | 580 | 175.1 |
| D | 11 | 176 | 205428 | 1169.65 | 606 | 580 | 175.1 |
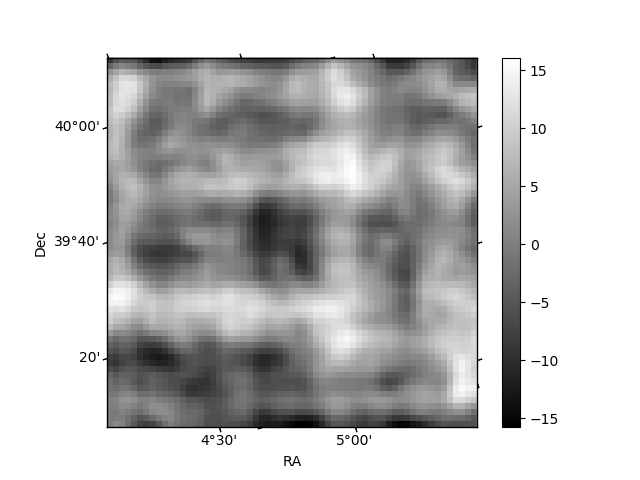
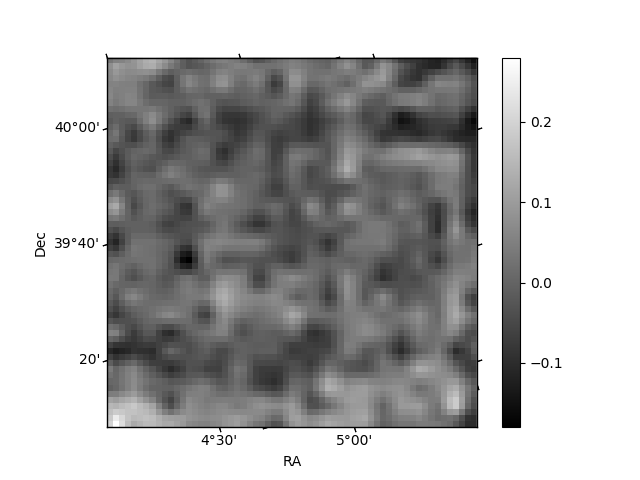
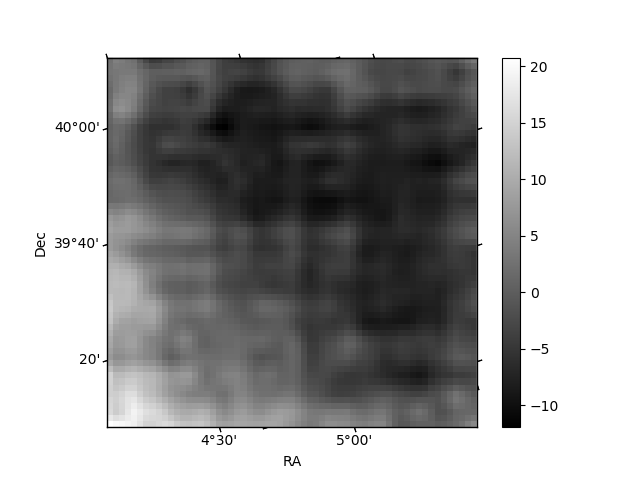
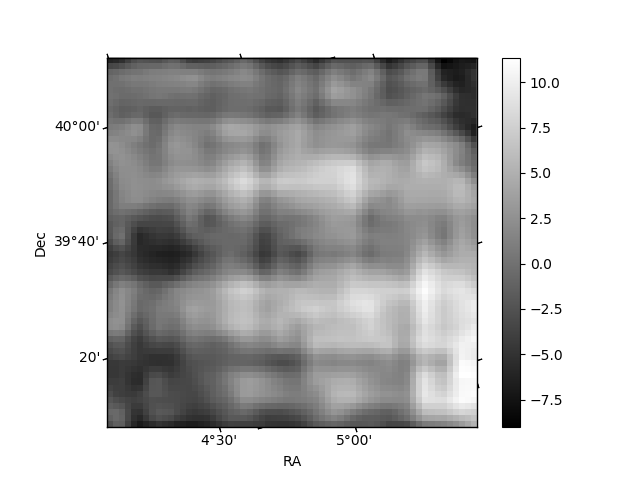
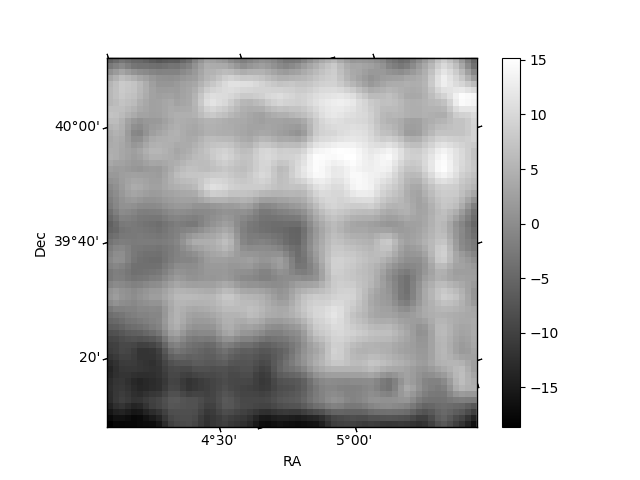
Histogram calculated using DETX and DETY for each event in the final _common_clean file
| Quadrant A | 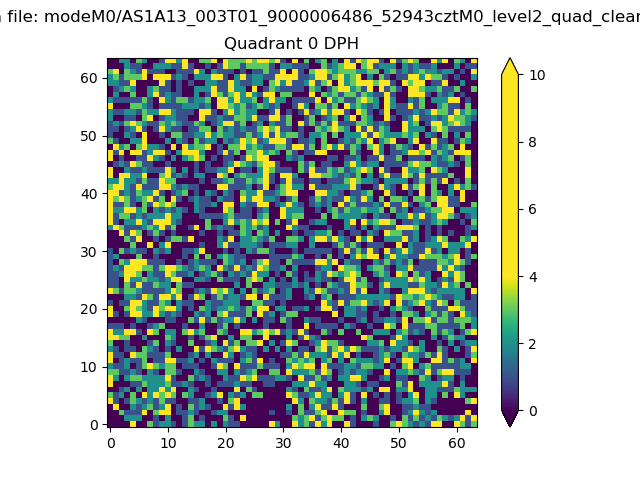 |
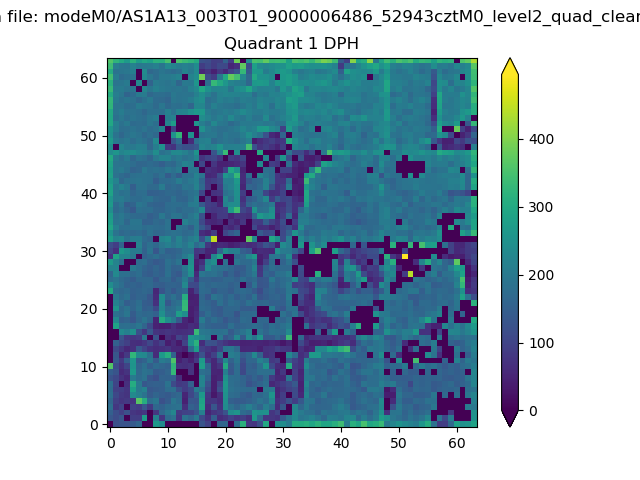 |
Quadrant B |
|---|---|---|---|
| Quadrant D | 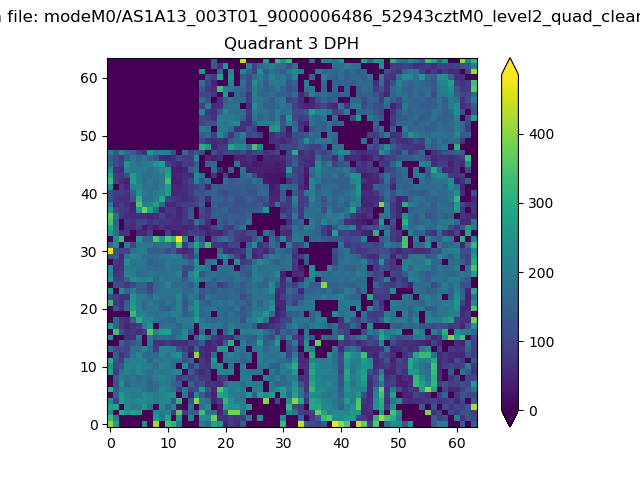 |
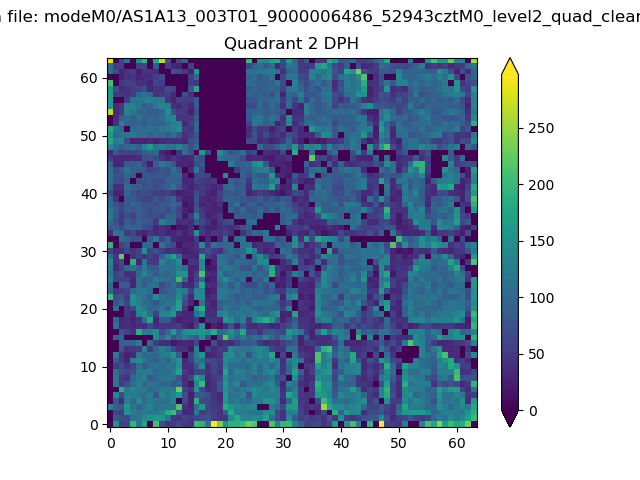 |
Quadrant C |
| Plot type | Count rate plots | Images |
|---|---|---|
| Comparison with Poisson distribution Blue bars denote a histogram of data divided into 1 sec bins. Red curve is a Poisson curve with rate = median count rate of data. |
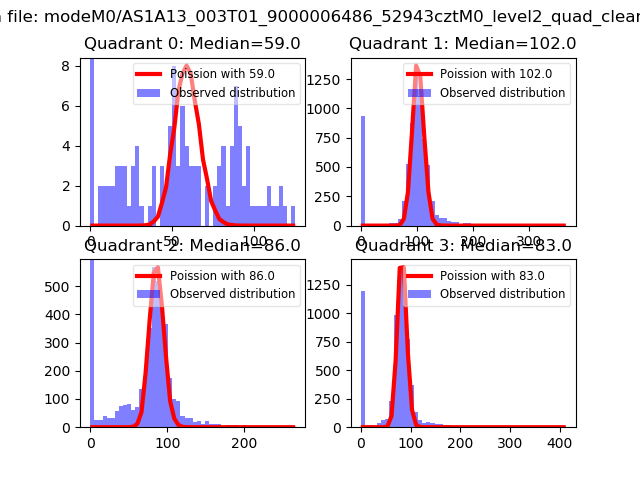 |
 |
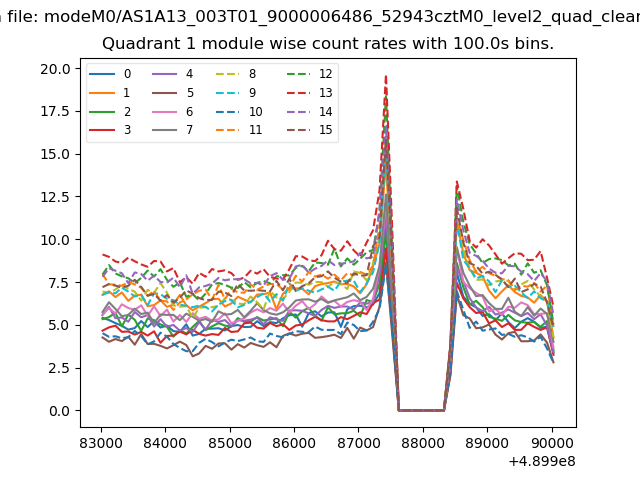
| Quadrant-wise count rates Data is divided into 100 sec bins |
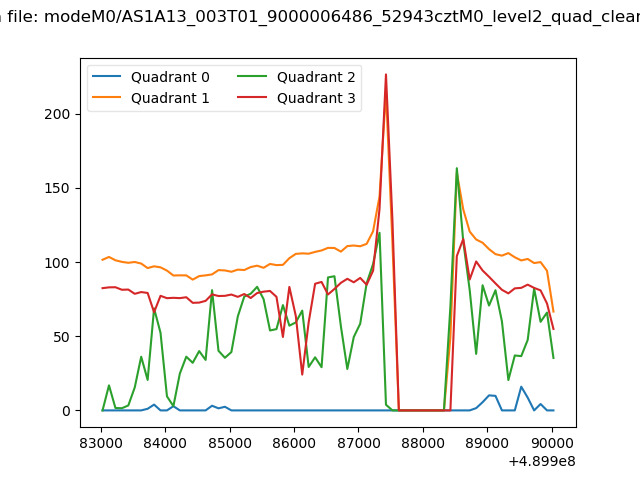 |
|
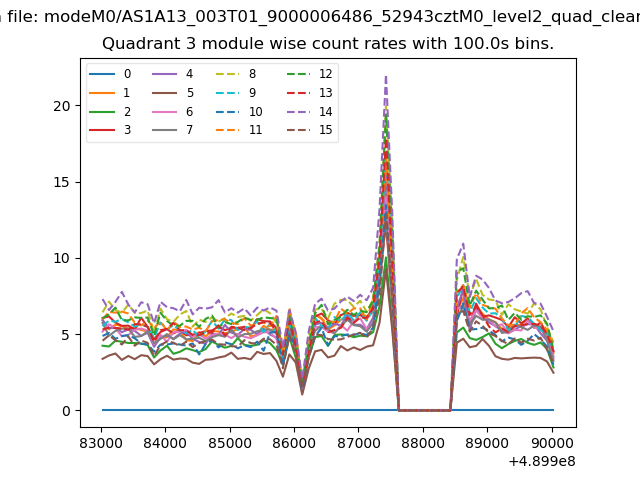
| Module-wise count rates for Quadrant A Data is divided into 100 sec bins |
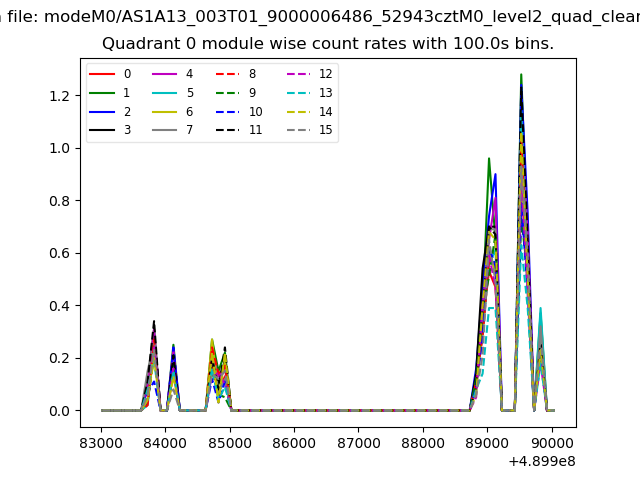 |
 |
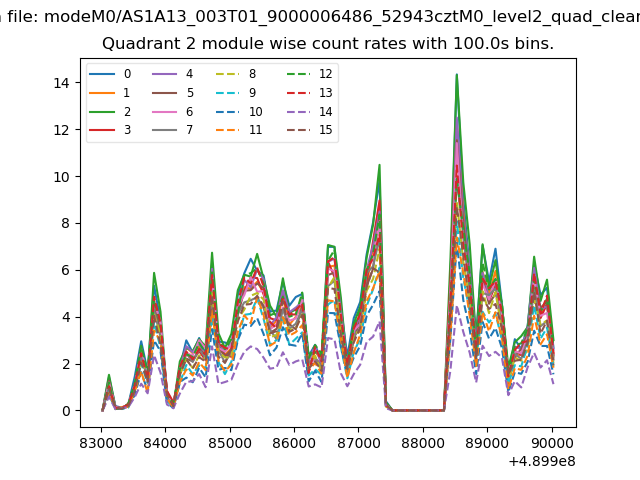
| Module-wise count rates for Quadrant B Data is divided into 100 sec bins |
 |
 |
| Module-wise count rates for Quadrant C Data is divided into 100 sec bins |
 |
 |
| Module-wise count rates for Quadrant D Data is divided into 100 sec bins |
 |
 |
| Parameter | Plot |
|---|---|
| CZT HV Monitor | 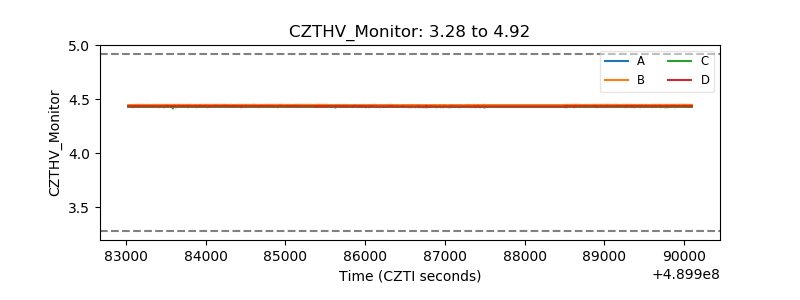 |
| D_VDD | 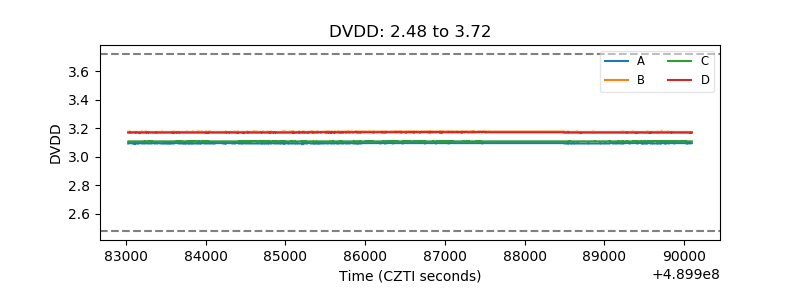 |
| Temperature 1 | 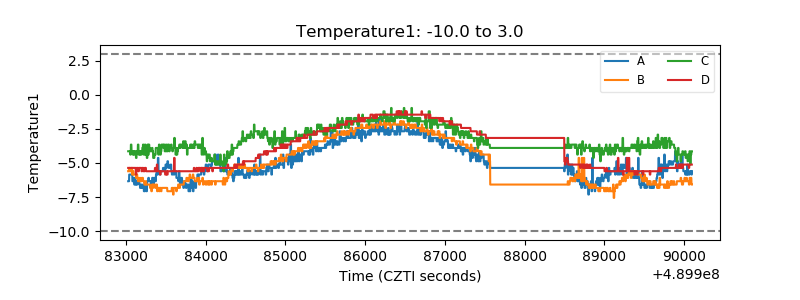 |
| Veto HV Monitor | 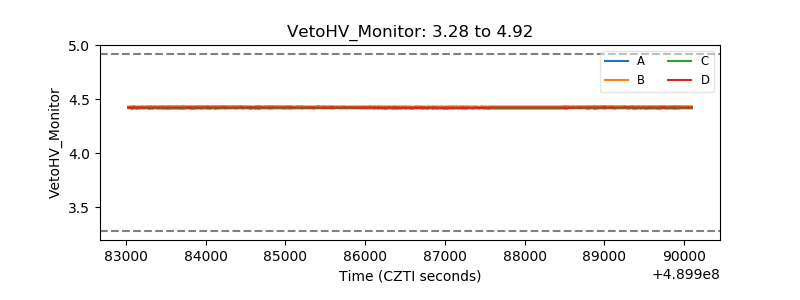 |
| Veto LLD | 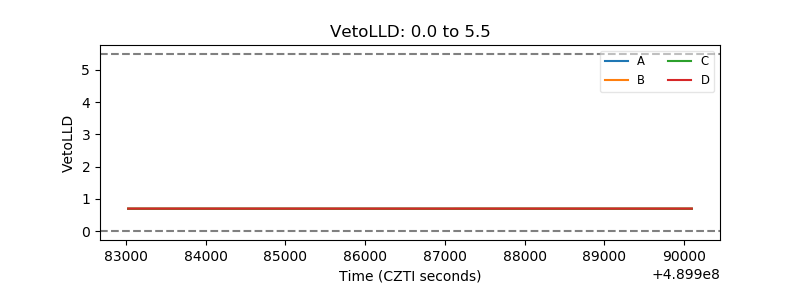 |
| Alpha Counter | 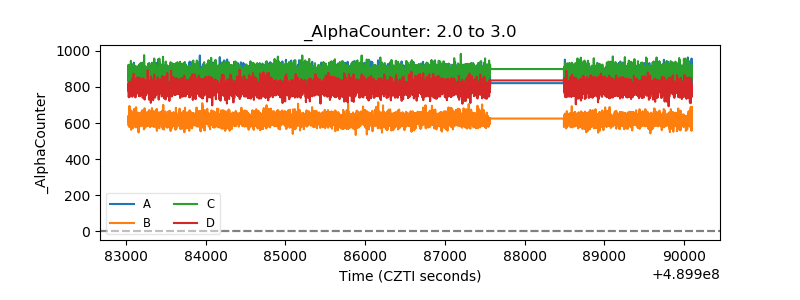 |
| _CPM_Rate | 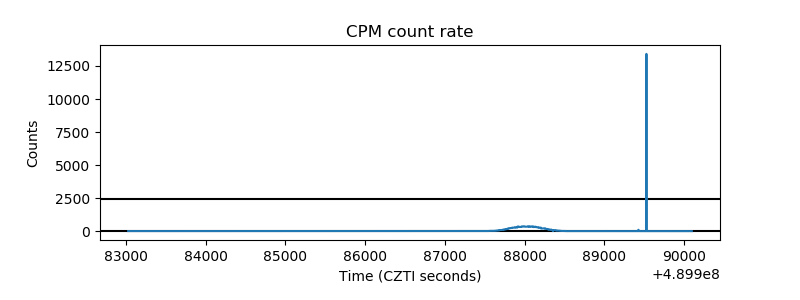 |
| CZT Counter | 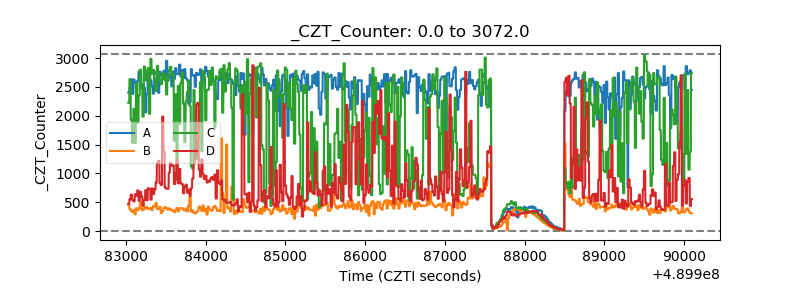 |
| +2.5 Volts monitor |  |
| +5 Volts monitor |  |
| _ROLL_ROT | 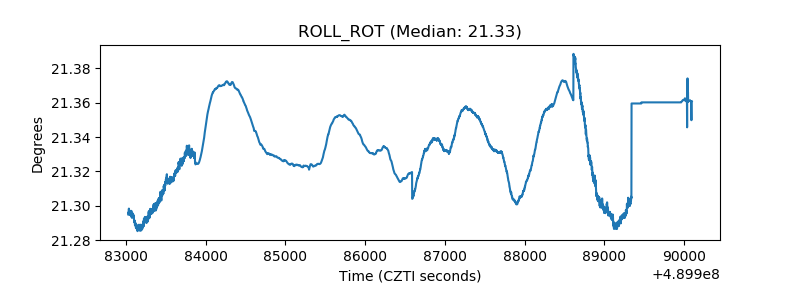 |
| _Roll_DEC | 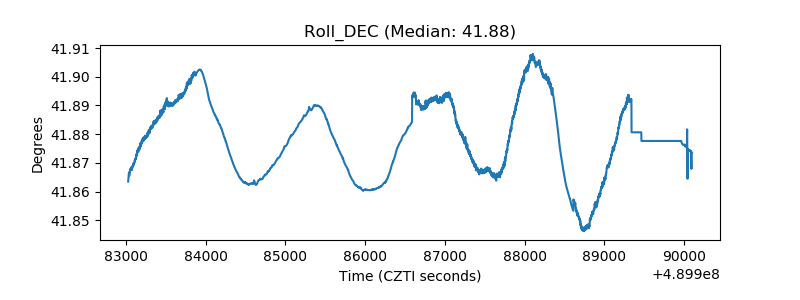 |
| _Roll_RA | 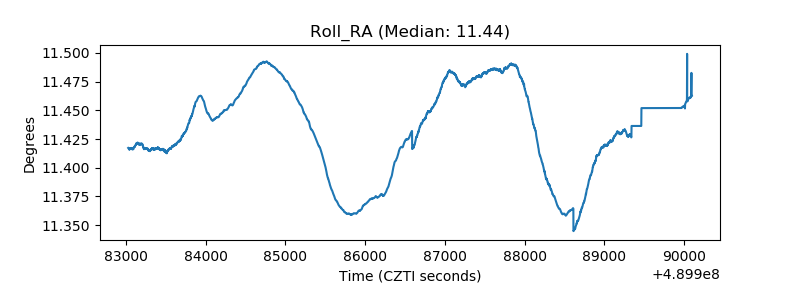 |
| Veto Counter | 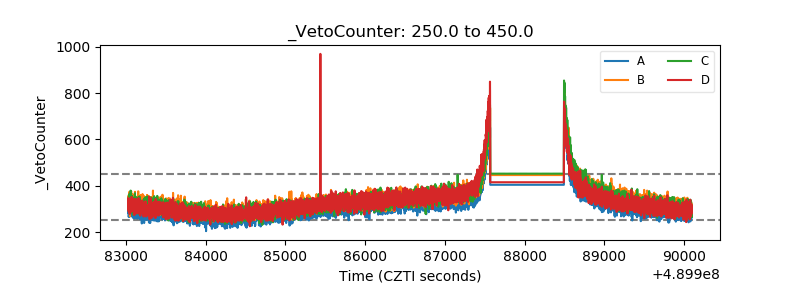 |