| Param | Original file | Final file |
|---|---|---|
| Filename | modeM0/AS1A13_003T01_9000006486_52945cztM0_level2.fits | modeM0/AS1A13_003T01_9000006486_52945cztM0_level2_quad_clean.evt |
| Size (bytes) | 33,903,360 | 4,158,720 |
| Size | 32.3 MB | 4.0 MB |
| Events in quadrant A | 296,995 | 80 |
| Events in quadrant B | 313,668 | 49,231 |
| Events in quadrant C | 329,965 | 7,778 |
| Events in quadrant D | 284,796 | 36,621 |
| Mode M0 | |||
|---|---|---|---|
| Quadrant | BADHDUFLAG | Total packets | Discarded packets |
| A | 0 | 969 | 0 |
| B | 0 | 1281 | 0 |
| C | 0 | 1115 | 0 |
| D | 0 | 1188 | 0 |
| Mode SS | |||
|---|---|---|---|
| Quadrant | BADHDUFLAG | Total packets | Discarded packets |
| A | 0 | 9 | 0 |
| B | 0 | 13 | 0 |
| C | 0 | 14 | 0 |
| D | 0 | 11 | 0 |
| Quadrant | Total seconds | Saturated seconds | Saturation percentage |
|---|---|---|---|
| A | 133 | 133 | 100.000000% |
| B | 520 | 0 | 0.000000% |
| C | 198 | 46 | 23.232323% |
| D | 480 | 8 | 1.666667% |
Noise dominated data is calculated using 1-second bins in cleaned event files. If a bin has >2000 counts, and if more than 50% of those come from <1% of pixels, then it is considered to be noise-dominated and hence unusable.
| Quadrant | # 1 sec bins | Bins with >0 counts | Bins with >2000 counts | High rate bins dominated by noise | Noise dominated (total time) | Noise dominated (detector-on time) | Marked lightcurve |
|---|---|---|---|---|---|---|---|
| A | 1165 | 145 | 91 | 91 | 7.81% | 62.76% | 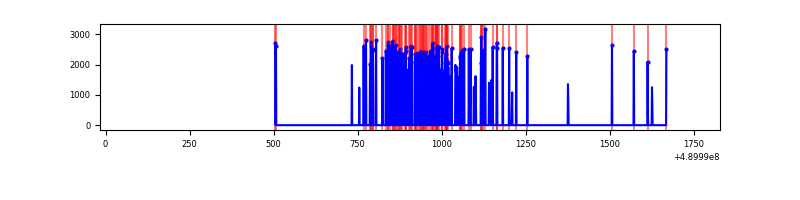 |
| B | 1649 | 794 | 0 | 0 | 0.00% | 0.00% | 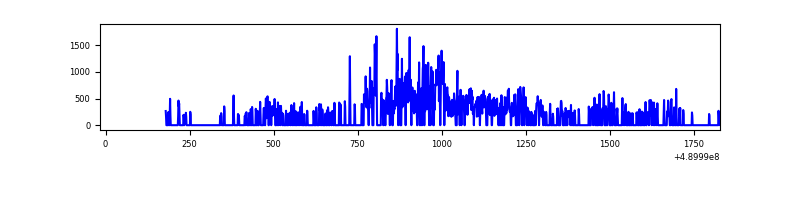 |
| C | 1210 | 321 | 28 | 28 | 2.31% | 8.72% | 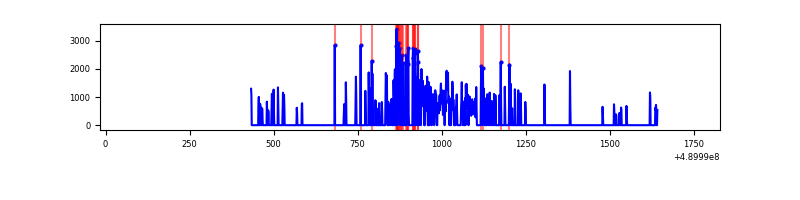 |
| D | 1753 | 738 | 2 | 2 | 0.11% | 0.27% | 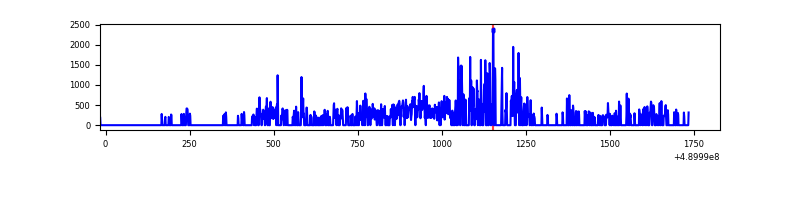 |
Top three noisy pixels from each quadrant. If the there are fewer than three noisy pixels in the level2.evt file, extra rows are filled as -1
| Pixel properties | Quadrant properties | ||||||
|---|---|---|---|---|---|---|---|
| Quadrant | DetID | PixID | Counts | Sigma | Mean | Median | Sigma |
| A | 9 | 191 | 279887 | 144466.78 | 3 | 3 | 1.9 |
| A | 15 | 174 | 756 | 388.67 | 3 | 3 | 1.9 |
| A | 3 | 114 | 741 | 380.93 | 3 | 3 | 1.9 |
| B | 10 | 254 | 102840 | 8164.37 | 48 | 47 | 12.6 |
| B | 5 | 185 | 11172 | 883.61 | 48 | 47 | 12.6 |
| B | 4 | 156 | 1493 | 114.85 | 48 | 47 | 12.6 |
| C | 7 | 80 | 134465 | 22024.51 | 16 | 15 | 6.1 |
| C | 10 | 171 | 77718 | 12728.67 | 16 | 15 | 6.1 |
| C | 15 | 254 | 20744 | 3395.66 | 16 | 15 | 6.1 |
| D | 15 | 78 | 65907 | 4781.44 | 42 | 40 | 13.8 |
| D | 8 | 176 | 27759 | 2012.19 | 42 | 40 | 13.8 |
| D | 2 | 120 | 5244 | 377.77 | 42 | 40 | 13.8 |
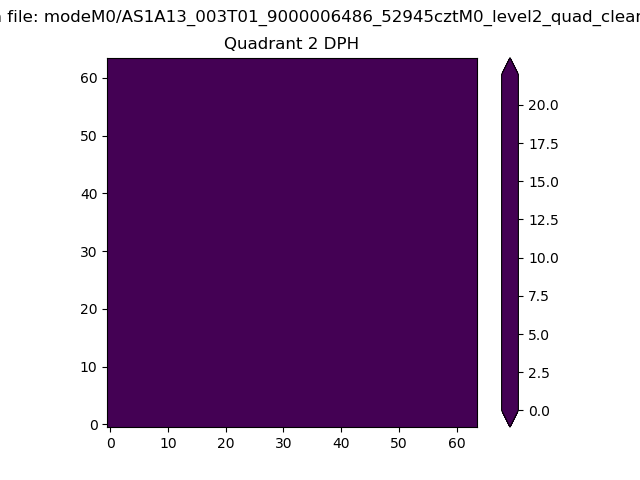
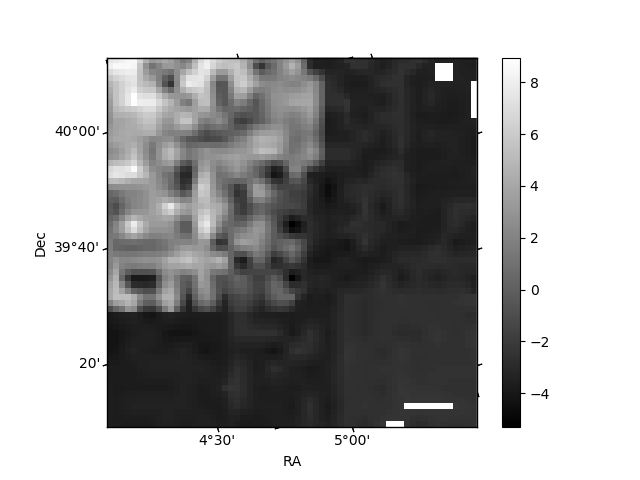
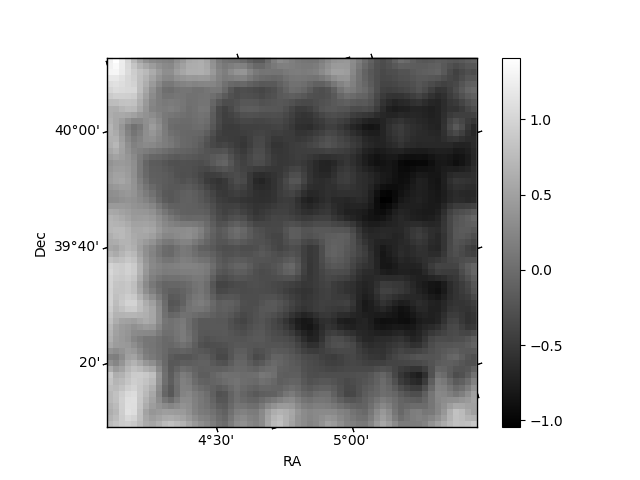
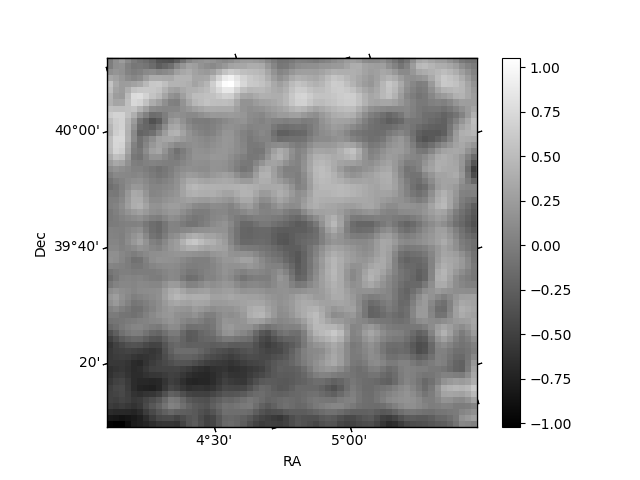
Histogram calculated using DETX and DETY for each event in the final _common_clean file
| Quadrant A | 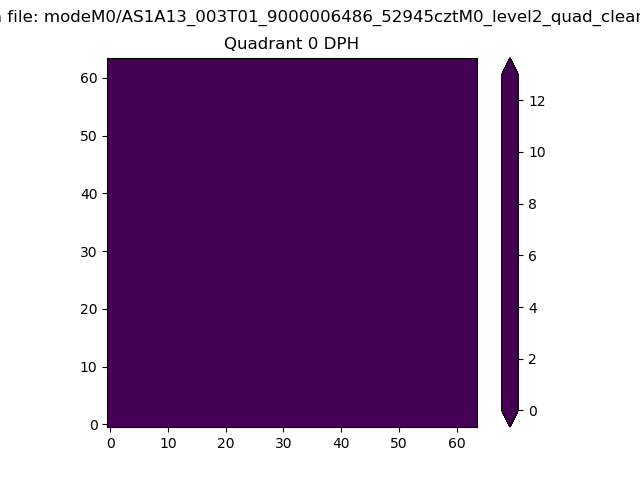 |
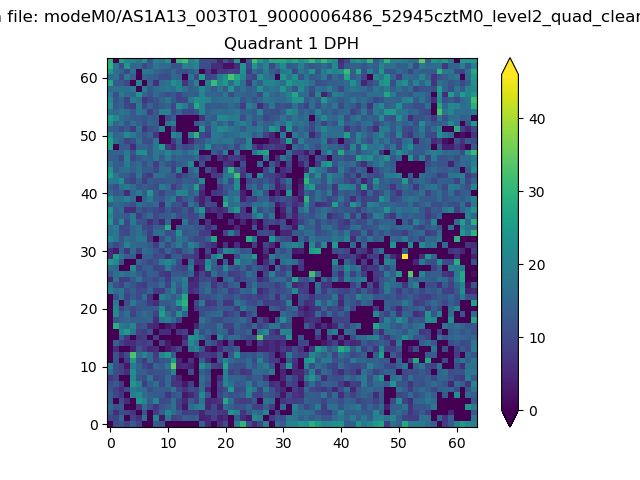 |
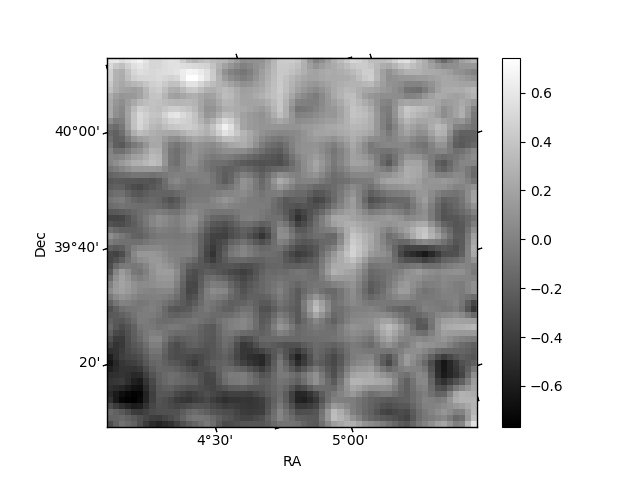
Quadrant B |
|---|---|---|---|
| Quadrant D | 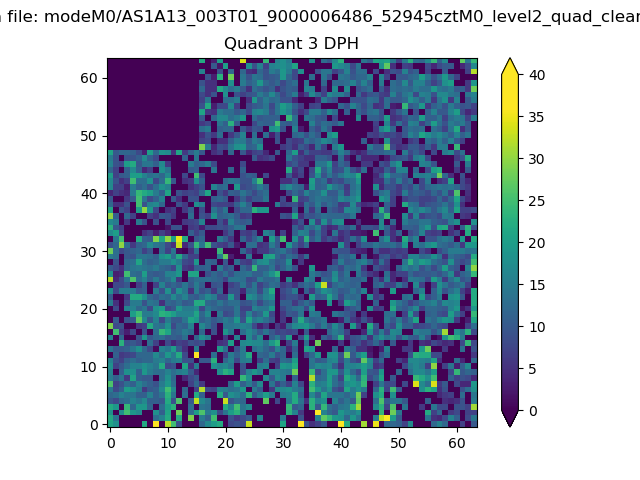 |
 |
Quadrant C |
| Plot type | Count rate plots | Images |
|---|---|---|
| Comparison with Poisson distribution Blue bars denote a histogram of data divided into 1 sec bins. Red curve is a Poisson curve with rate = median count rate of data. |
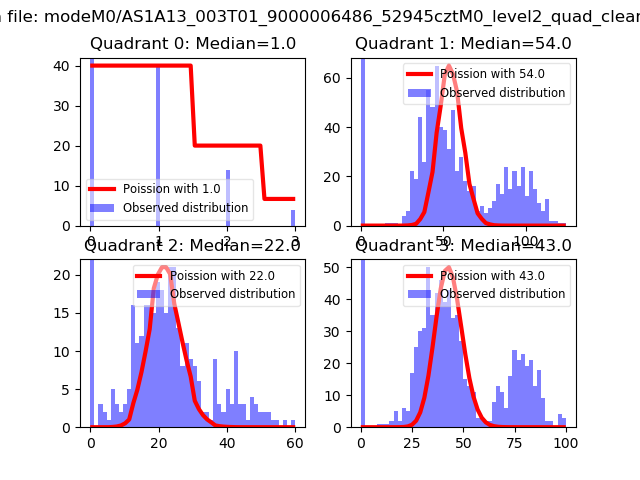 |
 |
| Quadrant-wise count rates Data is divided into 100 sec bins |
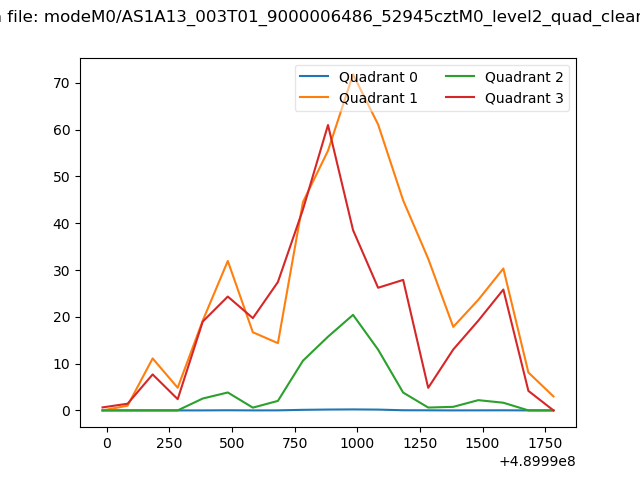 |
|
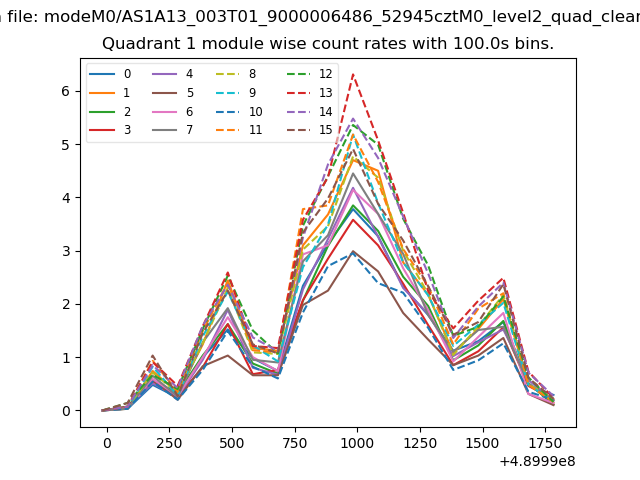
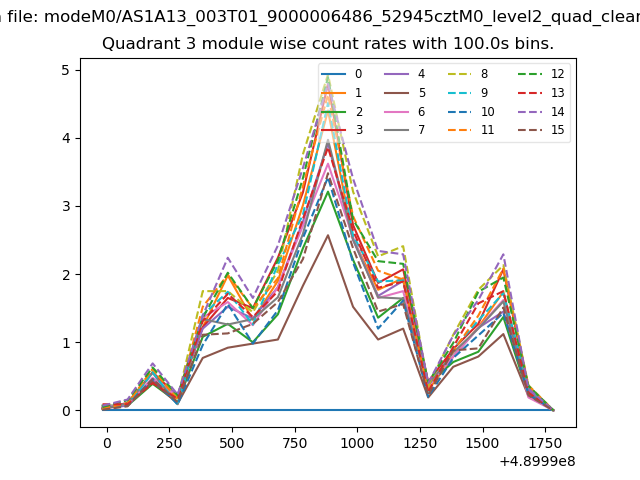
| Module-wise count rates for Quadrant A Data is divided into 100 sec bins |
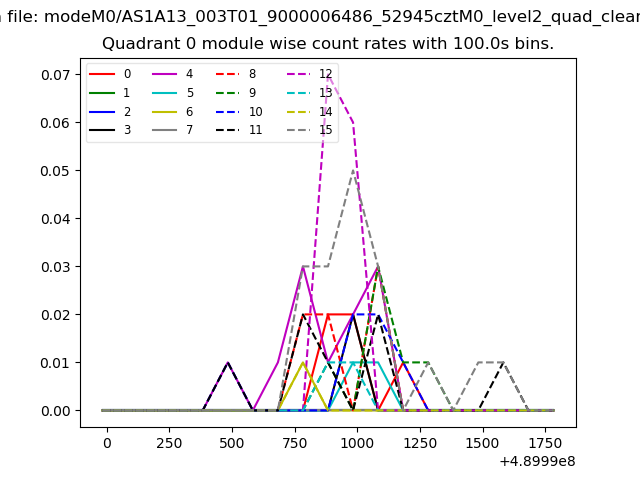 |
 |
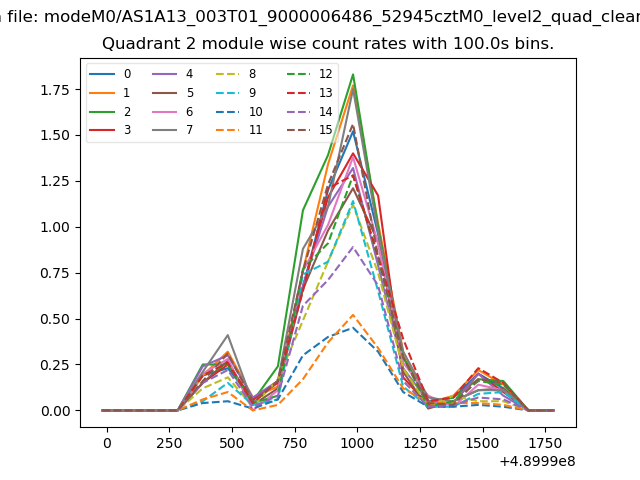
| Module-wise count rates for Quadrant B Data is divided into 100 sec bins |
 |
 |
| Module-wise count rates for Quadrant C Data is divided into 100 sec bins |
 |
 |
| Module-wise count rates for Quadrant D Data is divided into 100 sec bins |
 |
 |
| Parameter | Plot |
|---|---|
| CZT HV Monitor | 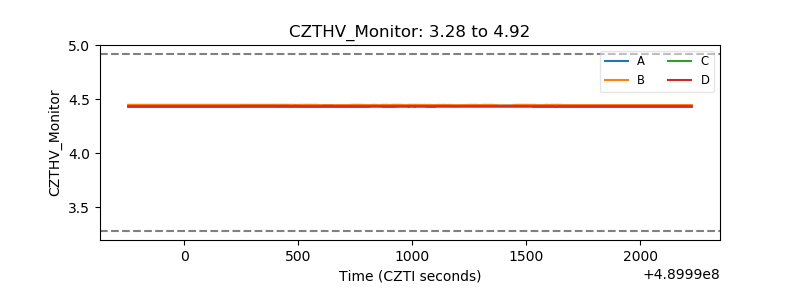 |
| D_VDD | 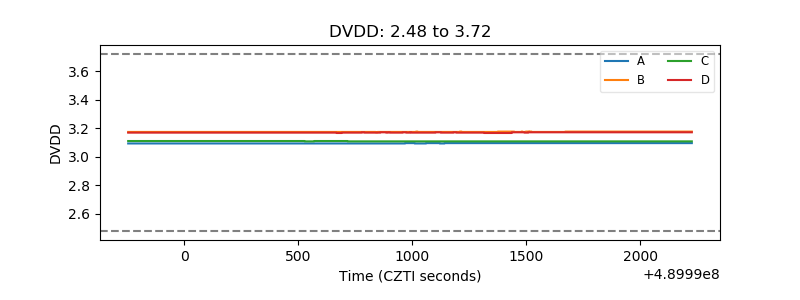 |
| Temperature 1 | 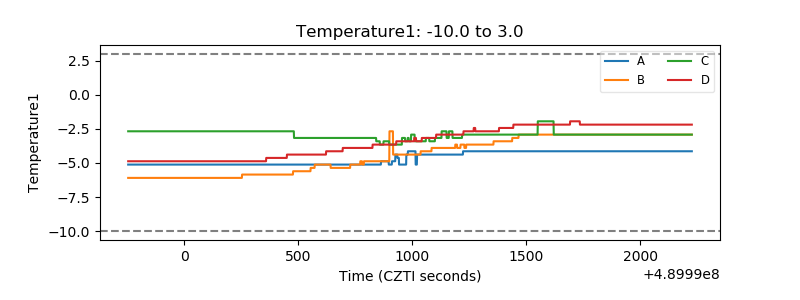 |
| Veto HV Monitor | 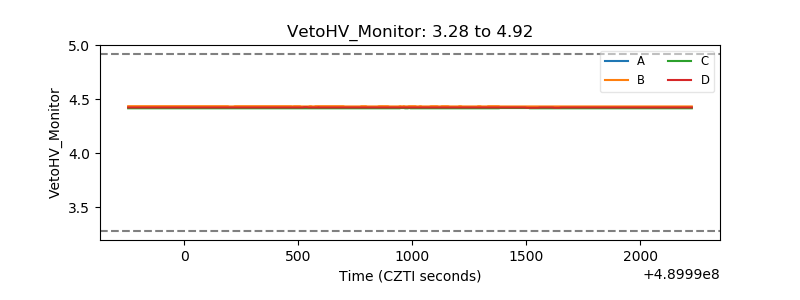 |
| Veto LLD | 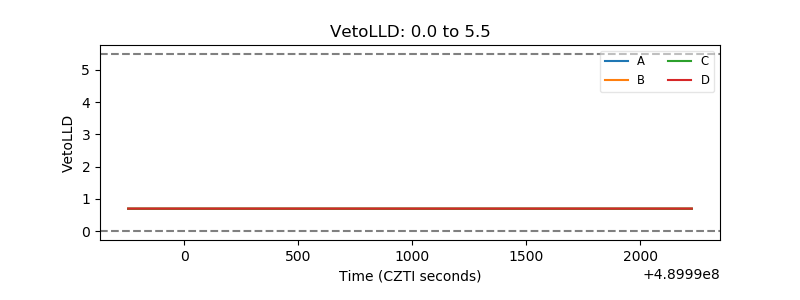 |
| Alpha Counter | 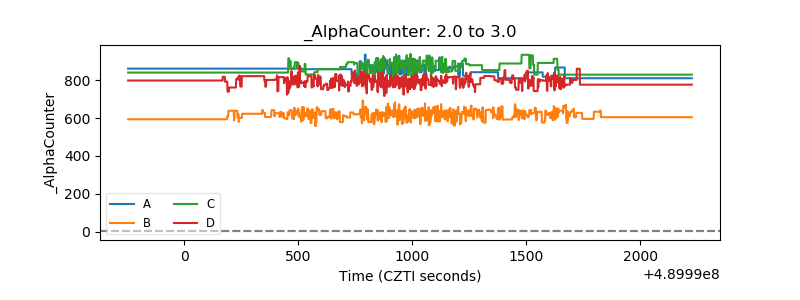 |
| _CPM_Rate | 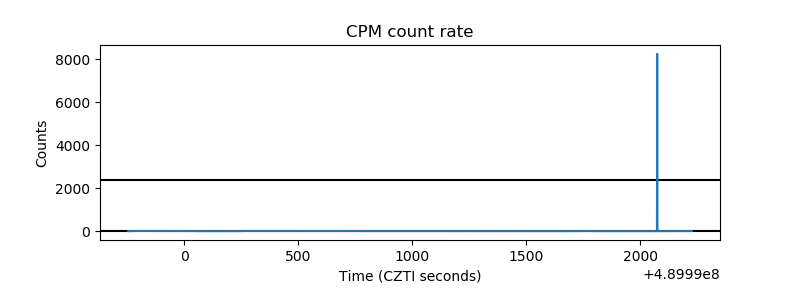 |
| CZT Counter | 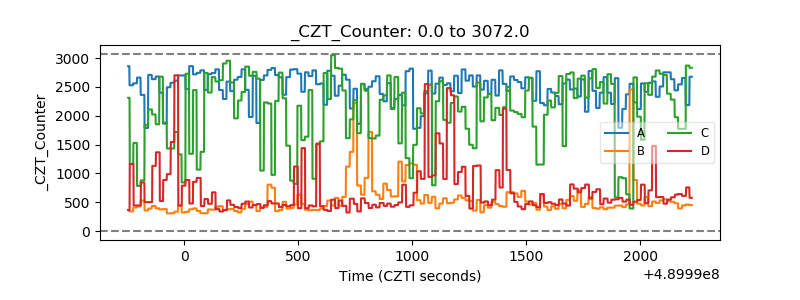 |
| +2.5 Volts monitor | 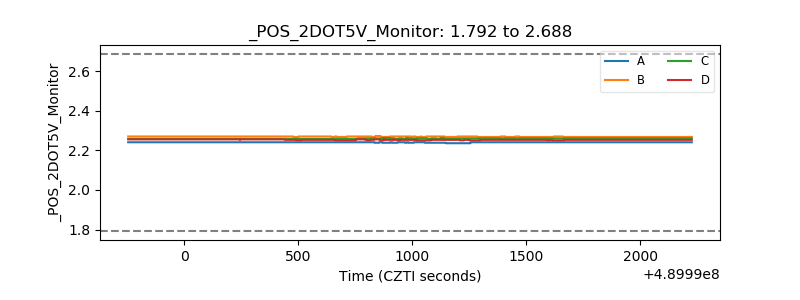 |
| +5 Volts monitor | 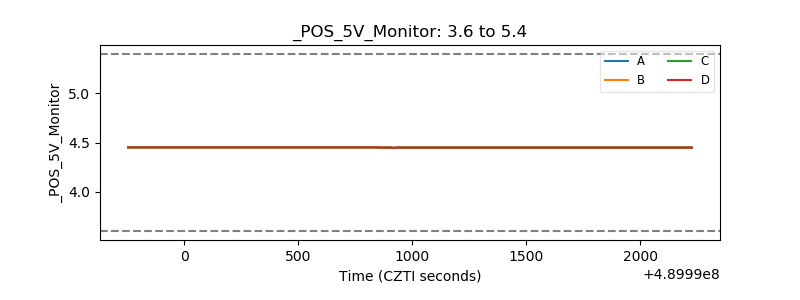 |
| _ROLL_ROT | 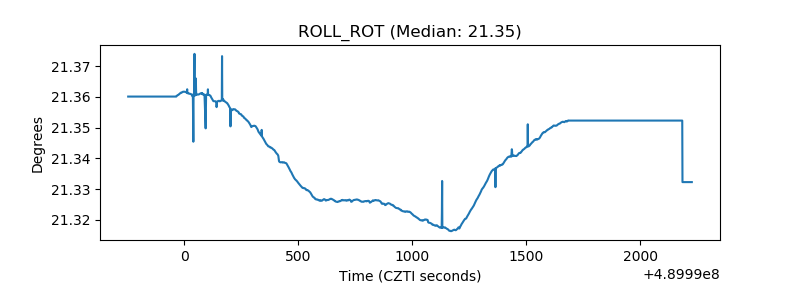 |
| _Roll_DEC | 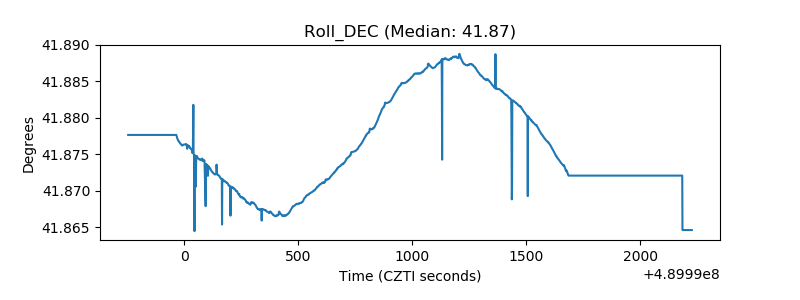 |
| _Roll_RA | 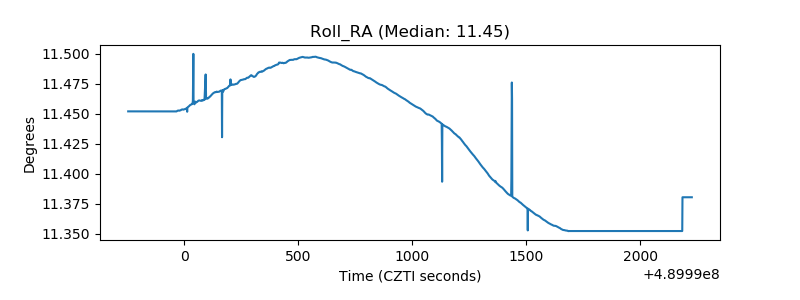 |
| Veto Counter | 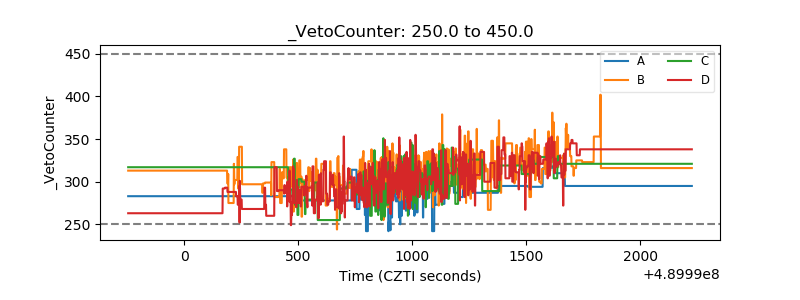 |