| Param | Original file | Final file |
|---|---|---|
| Filename | modeM0/AS1A13_003T01_9000006486_52946cztM0_level2.fits | modeM0/AS1A13_003T01_9000006486_52946cztM0_level2_quad_clean.evt |
| Size (bytes) | 943,948,800 | 62,478,720 |
| Size | 900.2 MB | 59.6 MB |
| Events in quadrant A | 15,415,606 | 17,846 |
| Events in quadrant B | 3,207,718 | 639,472 |
| Events in quadrant C | 9,814,534 | 345,572 |
| Events in quadrant D | 6,031,571 | 462,211 |
| Mode M9 | |||
|---|---|---|---|
| Quadrant | BADHDUFLAG | Total packets | Discarded packets |
| A | 0 | 11 | 0 |
| B | 0 | 11 | 0 |
| C | 0 | 11 | 0 |
| D | 0 | 11 | 0 |
| Mode M0 | |||
|---|---|---|---|
| Quadrant | BADHDUFLAG | Total packets | Discarded packets |
| A | 0 | 50056 | 8 |
| B | 0 | 13863 | 2 |
| C | 0 | 33489 | 18 |
| D | 0 | 22134 | 1 |
| Mode SS | |||
|---|---|---|---|
| Quadrant | BADHDUFLAG | Total packets | Discarded packets |
| A | 0 | 124 | 0 |
| B | 0 | 124 | 0 |
| C | 0 | 124 | 0 |
| D | 0 | 124 | 0 |
| Quadrant | Total seconds | Saturated seconds | Saturation percentage |
|---|---|---|---|
| A | 6107 | 5950 | 97.429180% |
| B | 6107 | 147 | 2.407074% |
| C | 6104 | 2466 | 40.399738% |
| D | 6108 | 953 | 15.602489% |
Noise dominated data is calculated using 1-second bins in cleaned event files. If a bin has >2000 counts, and if more than 50% of those come from <1% of pixels, then it is considered to be noise-dominated and hence unusable.
| Quadrant | # 1 sec bins | Bins with >0 counts | Bins with >2000 counts | High rate bins dominated by noise | Noise dominated (total time) | Noise dominated (detector-on time) | Marked lightcurve |
|---|---|---|---|---|---|---|---|
| A | 7202 | 6106 | 5679 | 5679 | 78.85% | 93.01% | 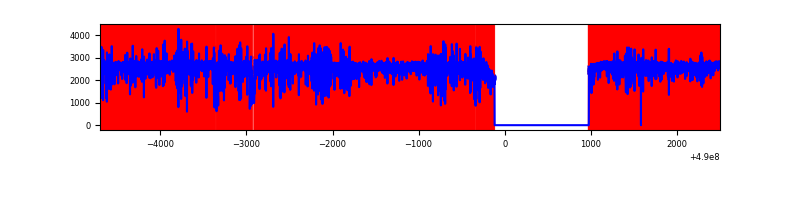 |
| B | 7203 | 6109 | 68 | 68 | 0.94% | 1.11% | 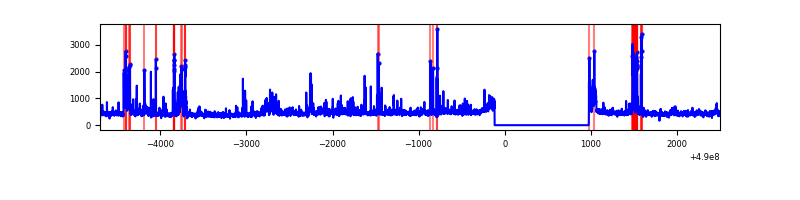 |
| C | 7203 | 6108 | 2194 | 2194 | 30.46% | 35.92% | 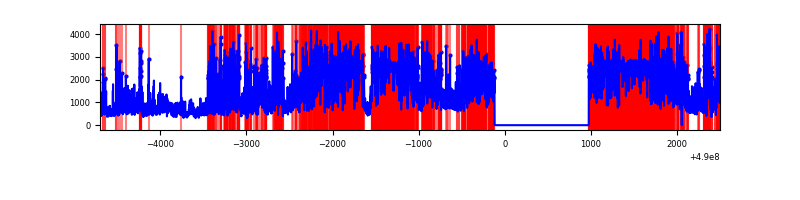 |
| D | 7203 | 6109 | 660 | 660 | 9.16% | 10.80% | 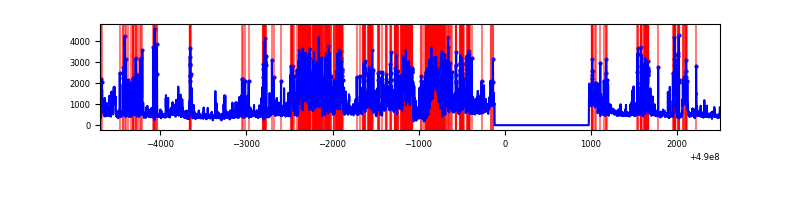 |
Top three noisy pixels from each quadrant. If the there are fewer than three noisy pixels in the level2.evt file, extra rows are filled as -1
| Pixel properties | Quadrant properties | ||||||
|---|---|---|---|---|---|---|---|
| Quadrant | DetID | PixID | Counts | Sigma | Mean | Median | Sigma |
| A | 9 | 191 | 14193297 | 211878.04 | 266 | 259 | 67.0 |
| A | 12 | 17 | 50854 | 755.3 | 266 | 259 | 67.0 |
| A | 0 | 8 | 28354 | 419.41 | 266 | 259 | 67.0 |
| B | 1 | 255 | 372759 | 2657.49 | 648 | 627 | 140.0 |
| B | 10 | 254 | 96438 | 684.21 | 648 | 627 | 140.0 |
| B | 10 | 63 | 46488 | 327.5 | 648 | 627 | 140.0 |
| C | 15 | 254 | 3137636 | 23067.68 | 485 | 480 | 136.0 |
| C | 13 | 3 | 2041878 | 15010.51 | 485 | 480 | 136.0 |
| C | 10 | 171 | 1308622 | 9618.84 | 485 | 480 | 136.0 |
| D | 8 | 176 | 1785132 | 10755.49 | 578 | 551 | 165.9 |
| D | 15 | 78 | 920572 | 5544.87 | 578 | 551 | 165.9 |
| D | 2 | 249 | 290865 | 1749.69 | 578 | 551 | 165.9 |
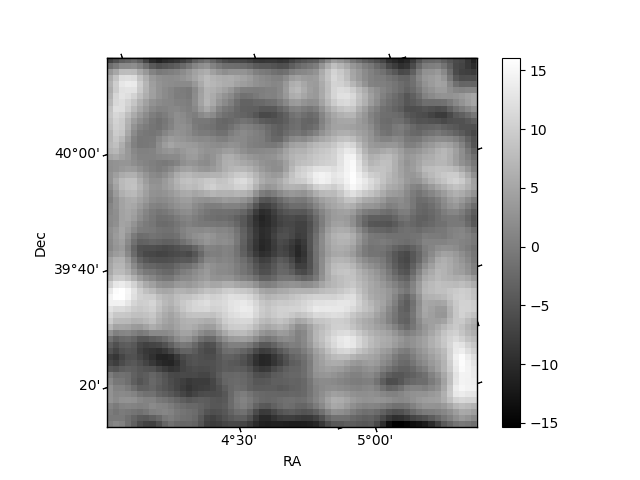
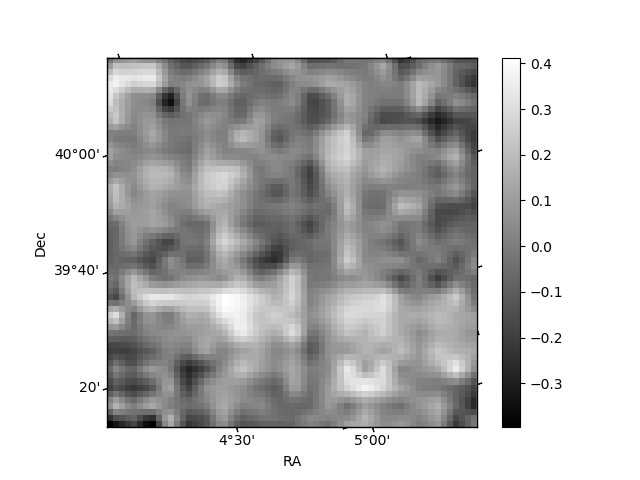
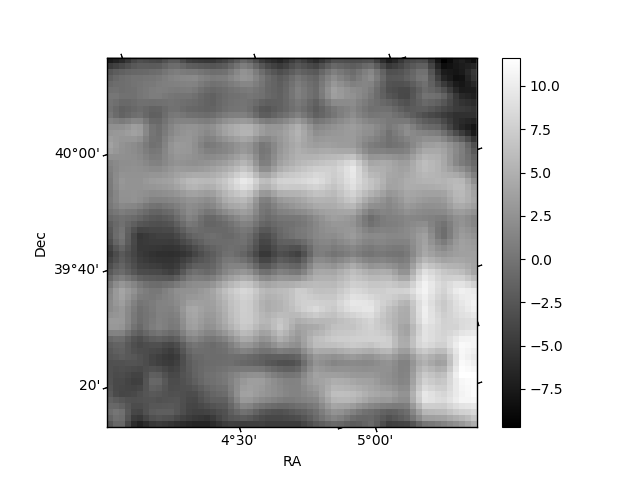
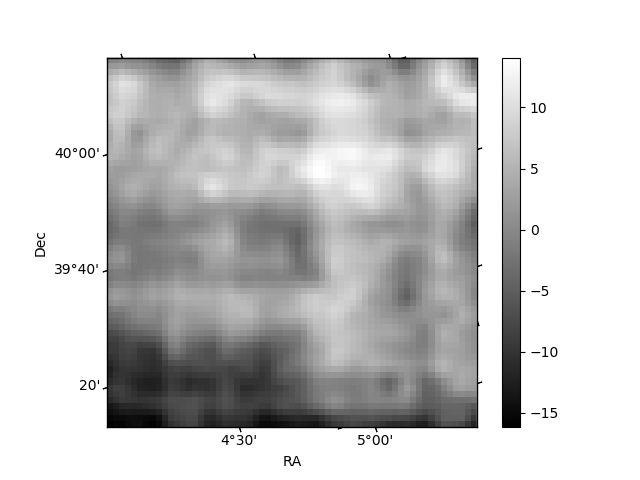
Histogram calculated using DETX and DETY for each event in the final _common_clean file
| Quadrant A | 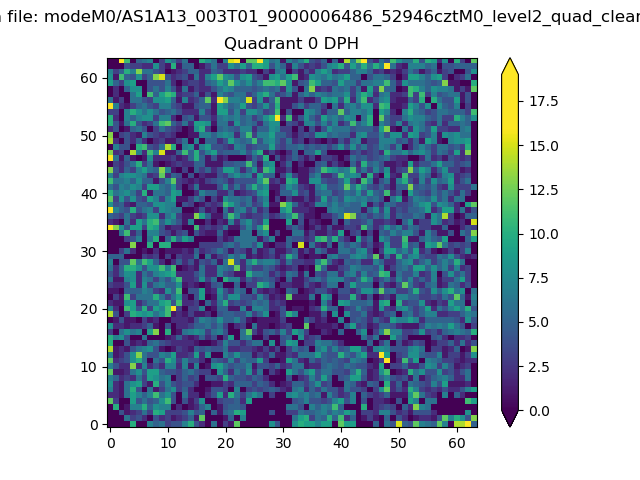 |
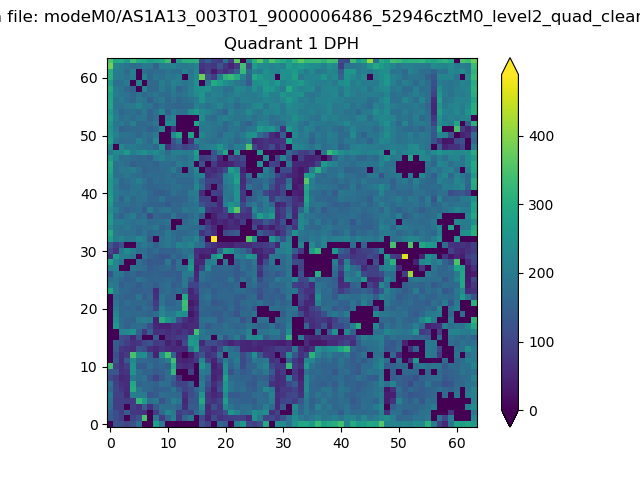 |
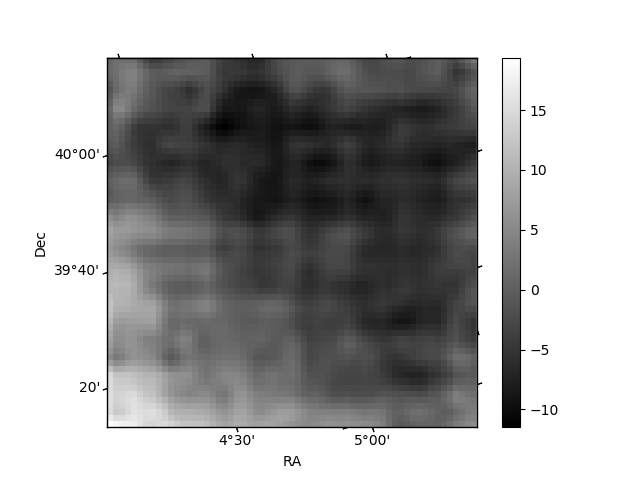
Quadrant B |
|---|---|---|---|
| Quadrant D | 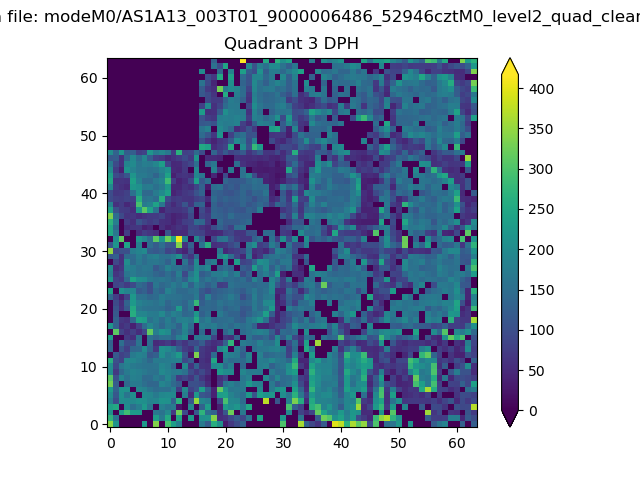 |
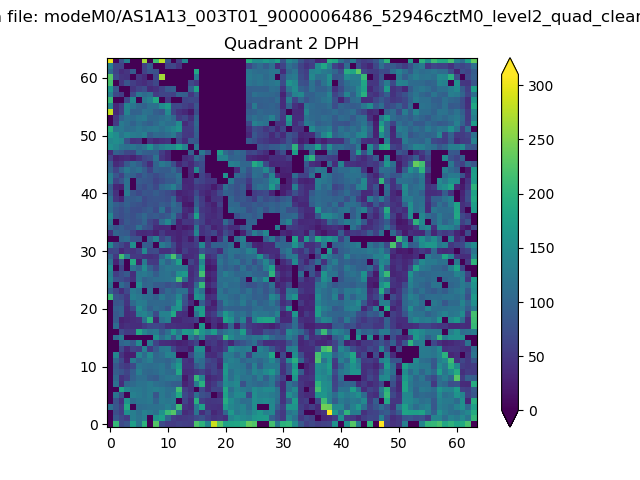 |
Quadrant C |
| Plot type | Count rate plots | Images |
|---|---|---|
| Comparison with Poisson distribution Blue bars denote a histogram of data divided into 1 sec bins. Red curve is a Poisson curve with rate = median count rate of data. |
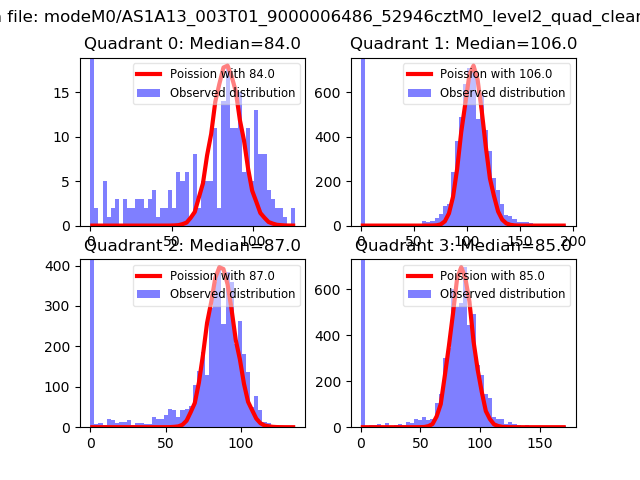 |
 |
| Quadrant-wise count rates Data is divided into 100 sec bins |
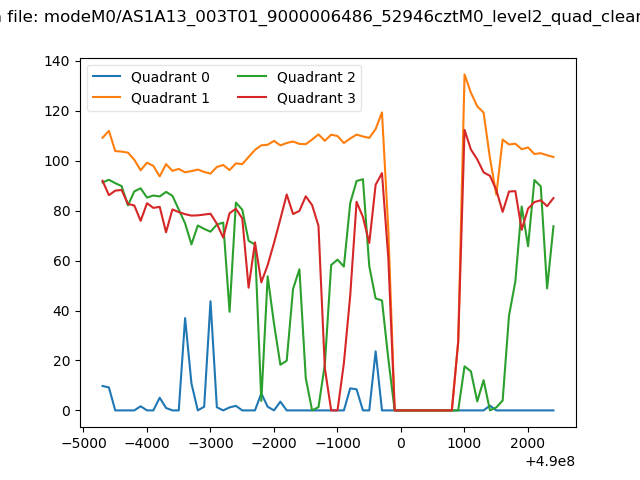 |
|
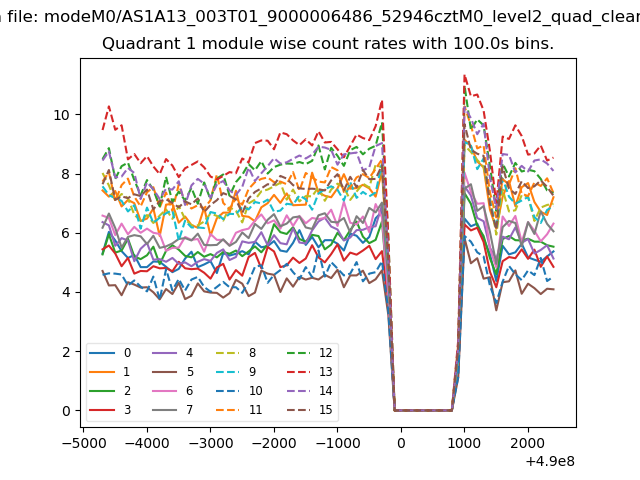
| Module-wise count rates for Quadrant A Data is divided into 100 sec bins |
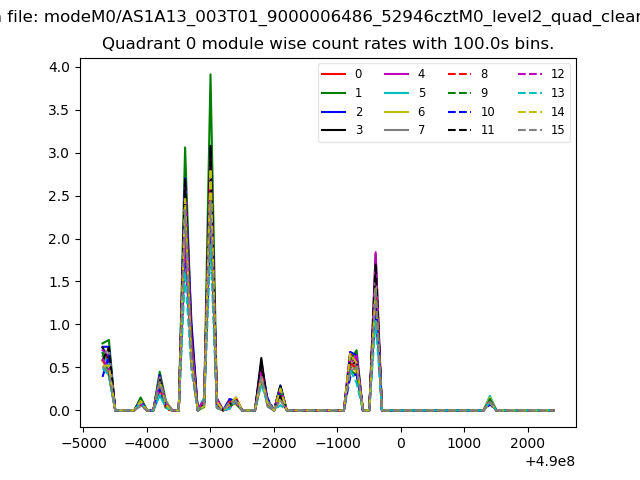 |
 |
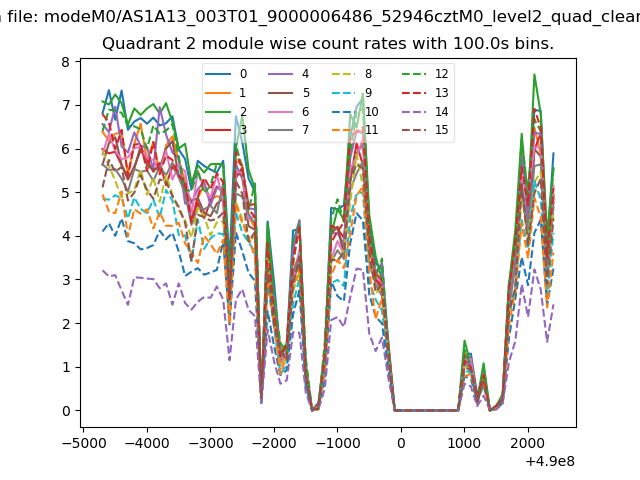
| Module-wise count rates for Quadrant B Data is divided into 100 sec bins |
 |
 |
| Module-wise count rates for Quadrant C Data is divided into 100 sec bins |
 |
 |
| Module-wise count rates for Quadrant D Data is divided into 100 sec bins |
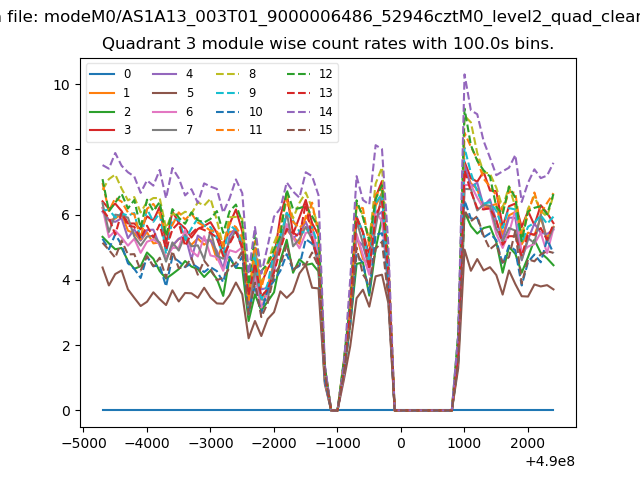 |
 |
| Parameter | Plot |
|---|---|
| CZT HV Monitor | 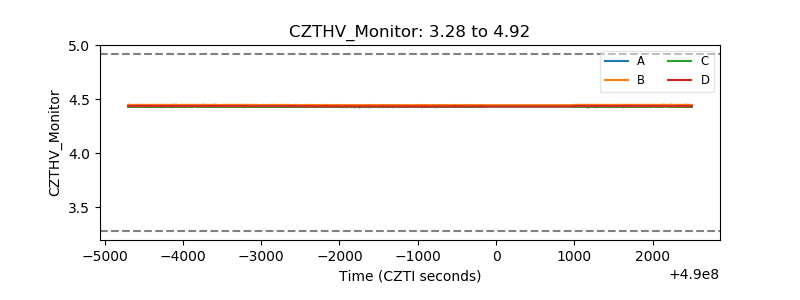 |
| D_VDD | 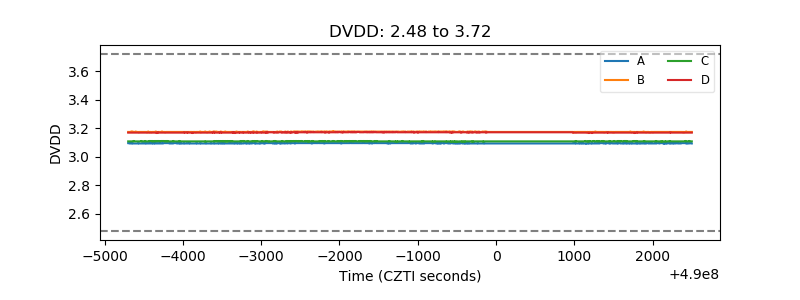 |
| Temperature 1 | 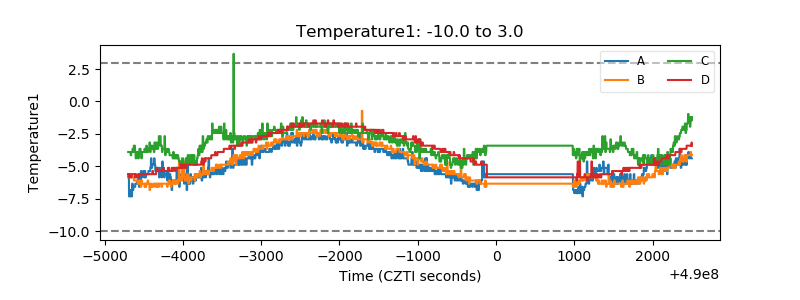 |
| Veto HV Monitor | 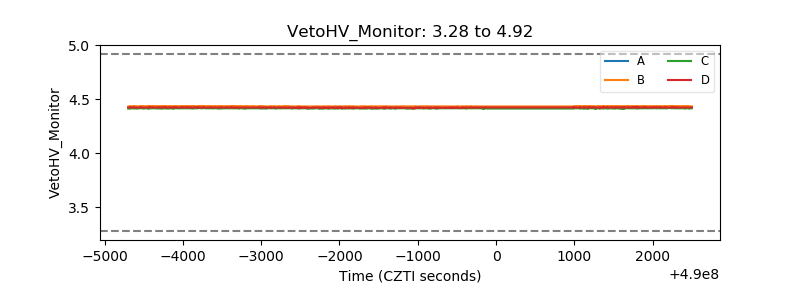 |
| Veto LLD | 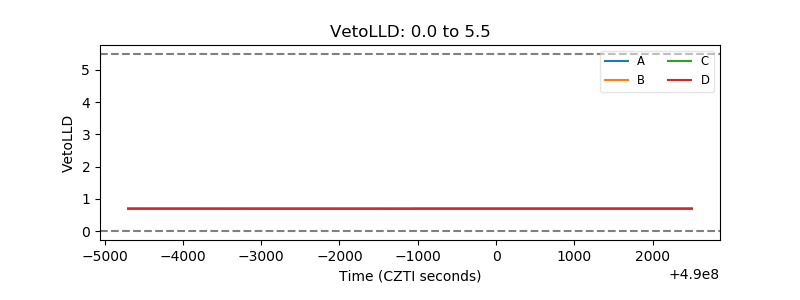 |
| Alpha Counter | 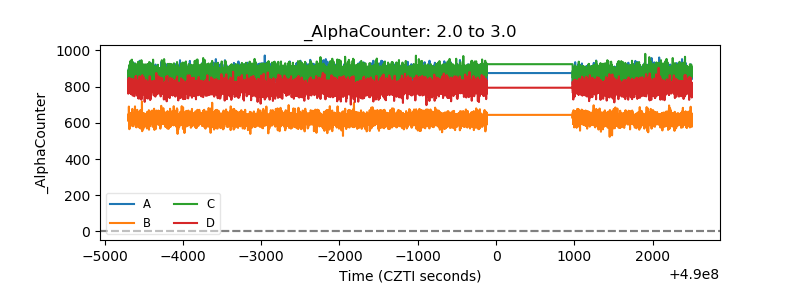 |
| _CPM_Rate | 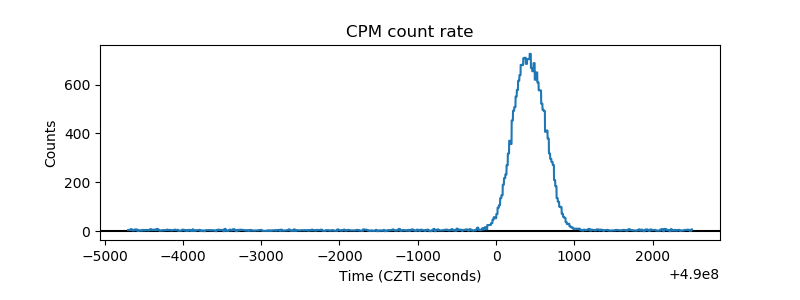 |
| CZT Counter | 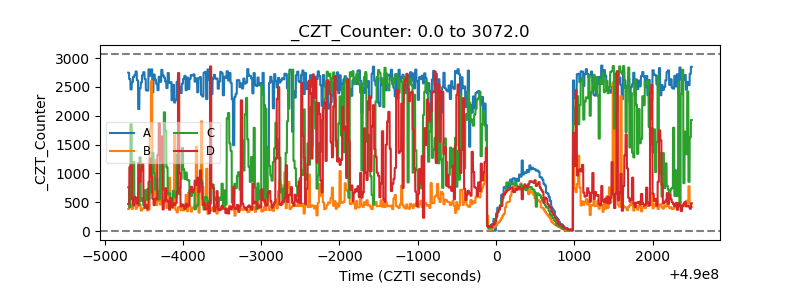 |
| +2.5 Volts monitor | 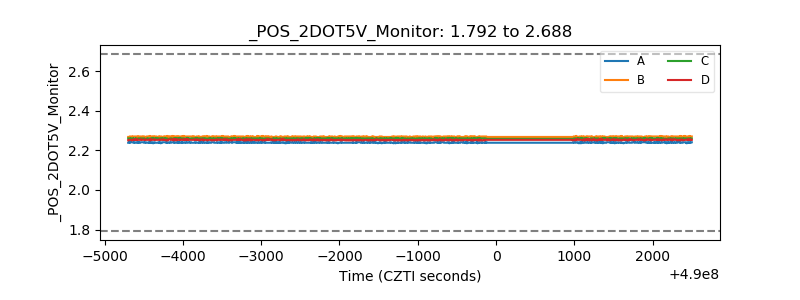 |
| +5 Volts monitor | 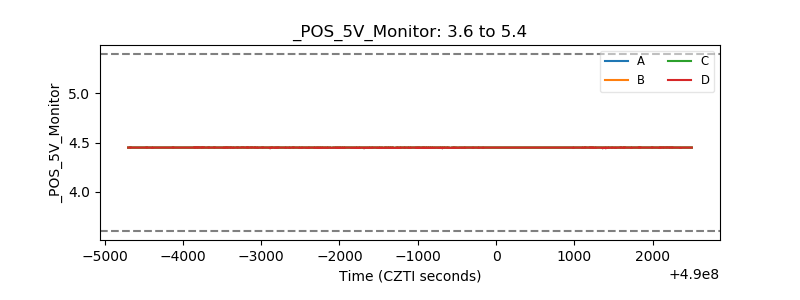 |
| _ROLL_ROT | 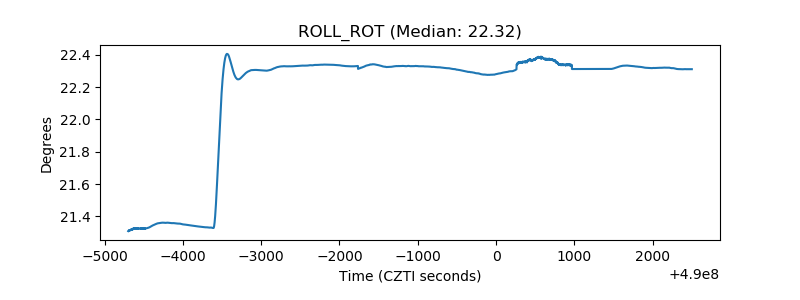 |
| _Roll_DEC | 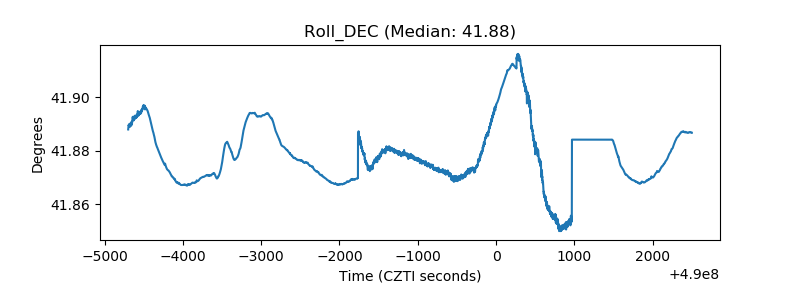 |
| _Roll_RA | 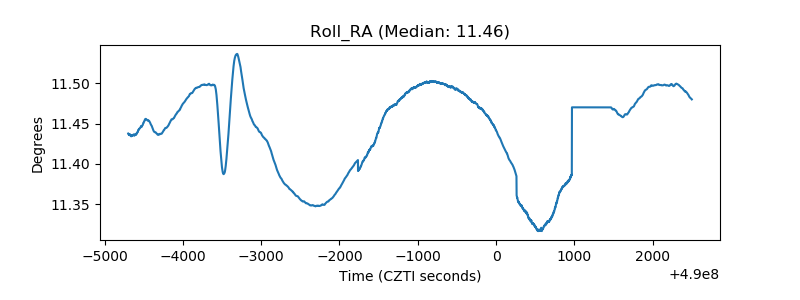 |
| Veto Counter | 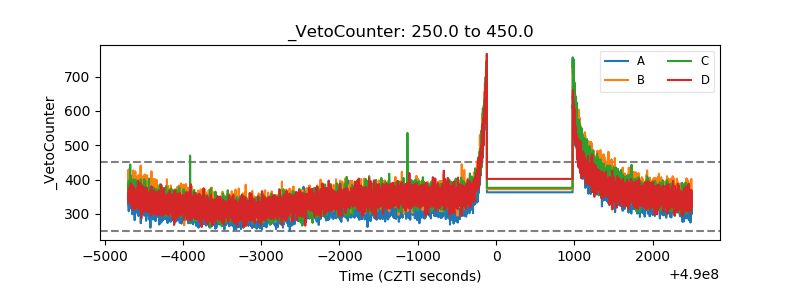 |