| Param | Original file | Final file |
|---|---|---|
| Filename | modeM0/AS1A13_003T01_9000006486_52947cztM0_level2.fits | modeM0/AS1A13_003T01_9000006486_52947cztM0_level2_quad_clean.evt |
| Size (bytes) | 873,694,080 | 65,551,680 |
| Size | 833.2 MB | 62.5 MB |
| Events in quadrant A | 14,934,656 | 27,126 |
| Events in quadrant B | 3,030,229 | 632,546 |
| Events in quadrant C | 9,091,790 | 398,046 |
| Events in quadrant D | 4,821,782 | 510,061 |
| Mode M9 | |||
|---|---|---|---|
| Quadrant | BADHDUFLAG | Total packets | Discarded packets |
| A | 0 | 12 | 0 |
| B | 0 | 12 | 0 |
| C | 0 | 12 | 0 |
| D | 0 | 12 | 0 |
| Mode M0 | |||
|---|---|---|---|
| Quadrant | BADHDUFLAG | Total packets | Discarded packets |
| A | 0 | 48451 | 1 |
| B | 0 | 13134 | 1 |
| C | 0 | 31191 | 1 |
| D | 0 | 18359 | 1 |
| Mode SS | |||
|---|---|---|---|
| Quadrant | BADHDUFLAG | Total packets | Discarded packets |
| A | 0 | 120 | 0 |
| B | 0 | 120 | 0 |
| C | 0 | 120 | 0 |
| D | 0 | 120 | 0 |
| Quadrant | Total seconds | Saturated seconds | Saturation percentage |
|---|---|---|---|
| A | 5974 | 5764 | 96.484767% |
| B | 5974 | 129 | 2.159357% |
| C | 5974 | 1967 | 32.926013% |
| D | 5974 | 323 | 5.406763% |
Noise dominated data is calculated using 1-second bins in cleaned event files. If a bin has >2000 counts, and if more than 50% of those come from <1% of pixels, then it is considered to be noise-dominated and hence unusable.
| Quadrant | # 1 sec bins | Bins with >0 counts | Bins with >2000 counts | High rate bins dominated by noise | Noise dominated (total time) | Noise dominated (detector-on time) | Marked lightcurve |
|---|---|---|---|---|---|---|---|
| A | 7139 | 5974 | 5507 | 5507 | 77.14% | 92.18% | 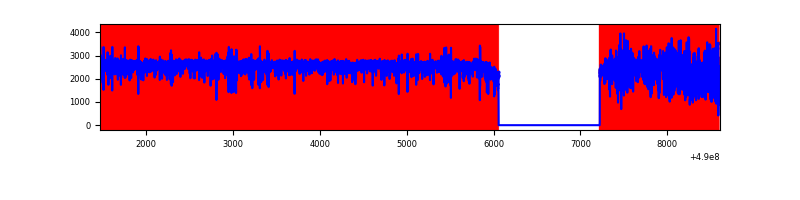 |
| B | 7139 | 5975 | 64 | 64 | 0.90% | 1.07% | 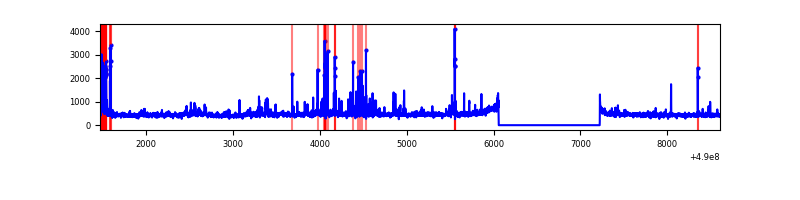 |
| C | 7139 | 5975 | 1751 | 1751 | 24.53% | 29.31% | 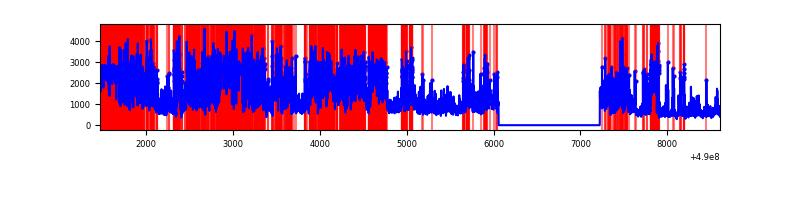 |
| D | 7139 | 5975 | 291 | 291 | 4.08% | 4.87% | 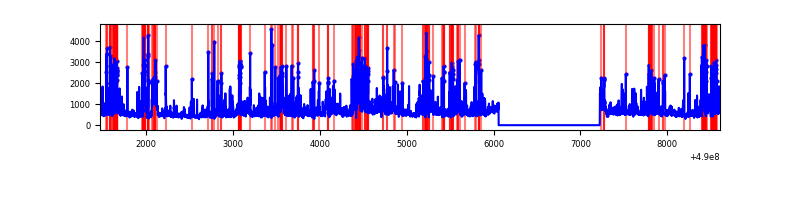 |
Top three noisy pixels from each quadrant. If the there are fewer than three noisy pixels in the level2.evt file, extra rows are filled as -1
| Pixel properties | Quadrant properties | ||||||
|---|---|---|---|---|---|---|---|
| Quadrant | DetID | PixID | Counts | Sigma | Mean | Median | Sigma |
| A | 9 | 191 | 13711183 | 205363.36 | 262 | 255 | 66.8 |
| A | 0 | 8 | 46903 | 698.69 | 262 | 255 | 66.8 |
| A | 4 | 207 | 32610 | 484.61 | 262 | 255 | 66.8 |
| B | 1 | 255 | 129392 | 928.34 | 644 | 621 | 138.7 |
| B | 10 | 63 | 99633 | 713.8 | 644 | 621 | 138.7 |
| B | 10 | 254 | 78885 | 564.22 | 644 | 621 | 138.7 |
| C | 15 | 254 | 3081530 | 21110.61 | 532 | 529 | 145.9 |
| C | 10 | 171 | 1632034 | 11178.86 | 532 | 529 | 145.9 |
| C | 13 | 3 | 671275 | 4595.86 | 532 | 529 | 145.9 |
| D | 8 | 176 | 872423 | 4924.35 | 618 | 590 | 177.0 |
| D | 15 | 78 | 488232 | 2754.34 | 618 | 590 | 177.0 |
| D | 11 | 176 | 253606 | 1429.1 | 618 | 590 | 177.0 |
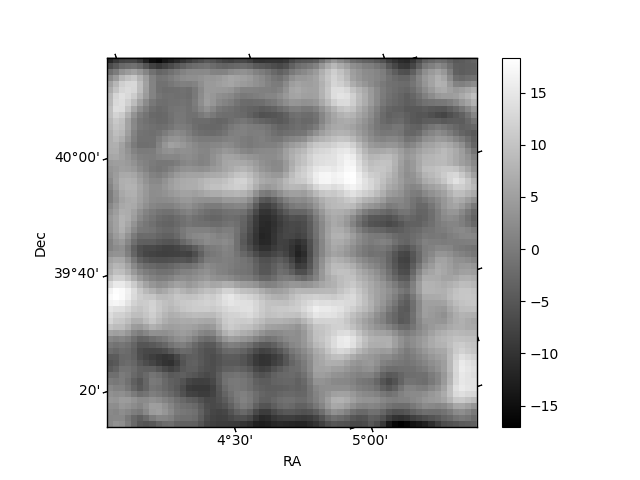
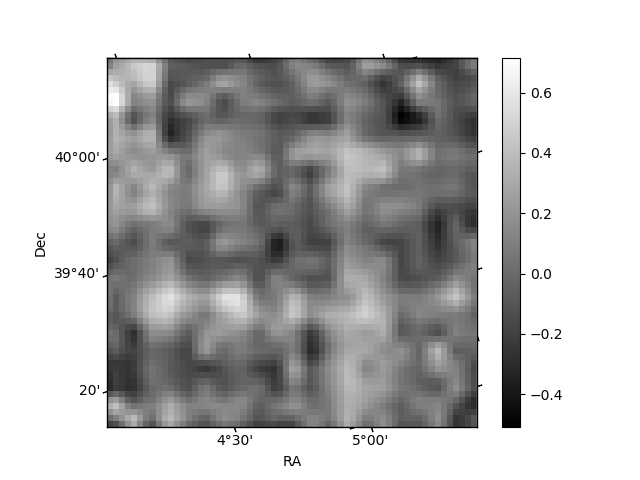
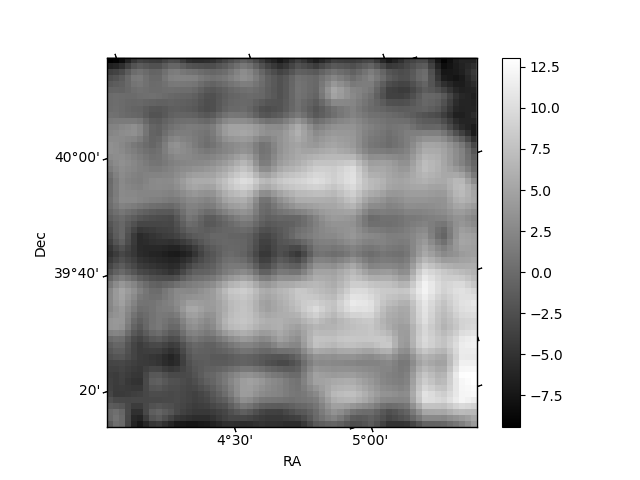
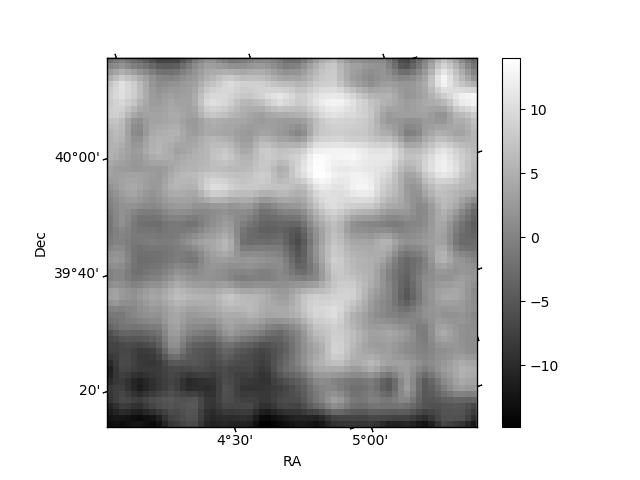
Histogram calculated using DETX and DETY for each event in the final _common_clean file
| Quadrant A | 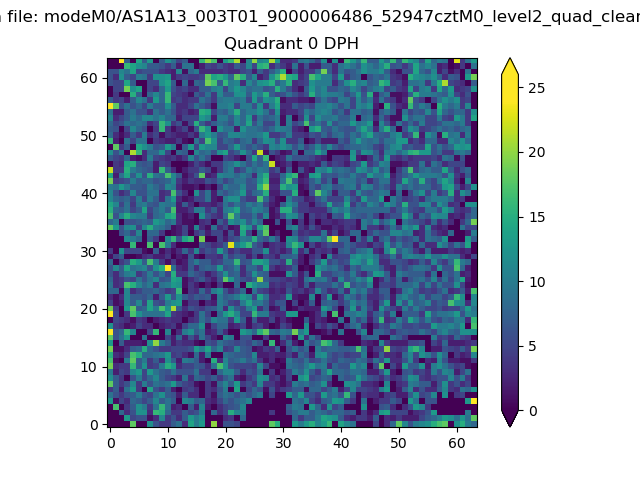 |
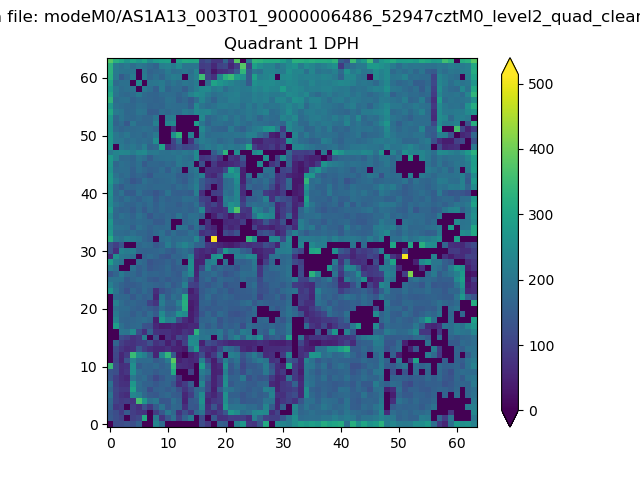 |
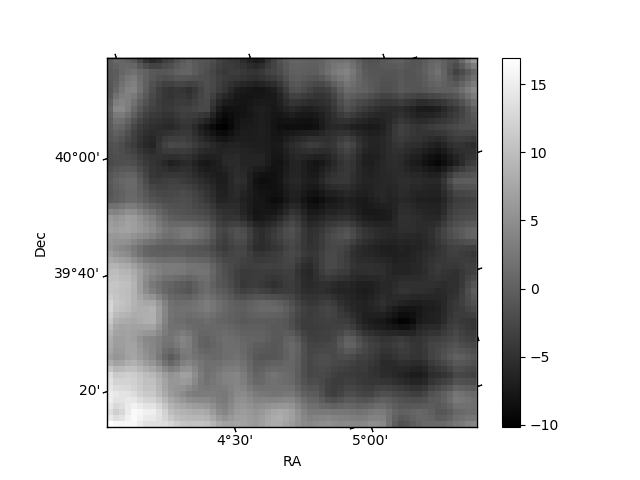
Quadrant B |
|---|---|---|---|
| Quadrant D | 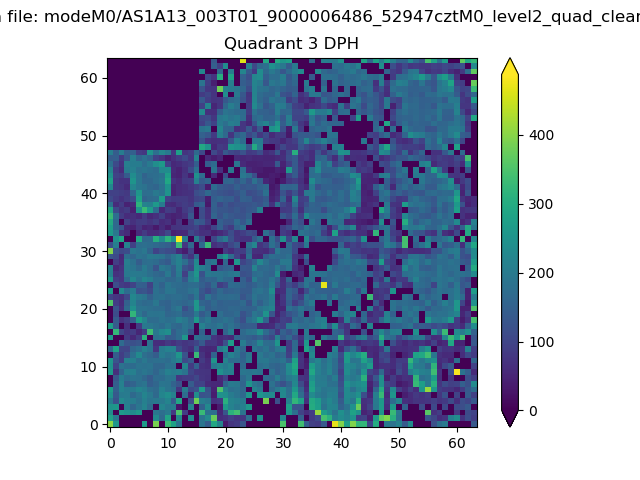 |
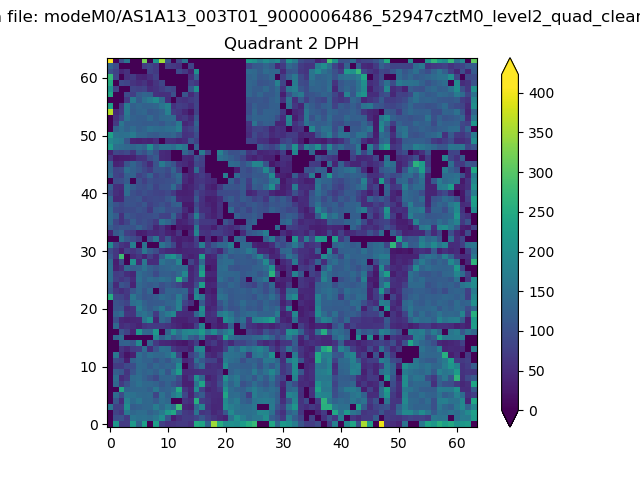 |
Quadrant C |
| Plot type | Count rate plots | Images |
|---|---|---|
| Comparison with Poisson distribution Blue bars denote a histogram of data divided into 1 sec bins. Red curve is a Poisson curve with rate = median count rate of data. |
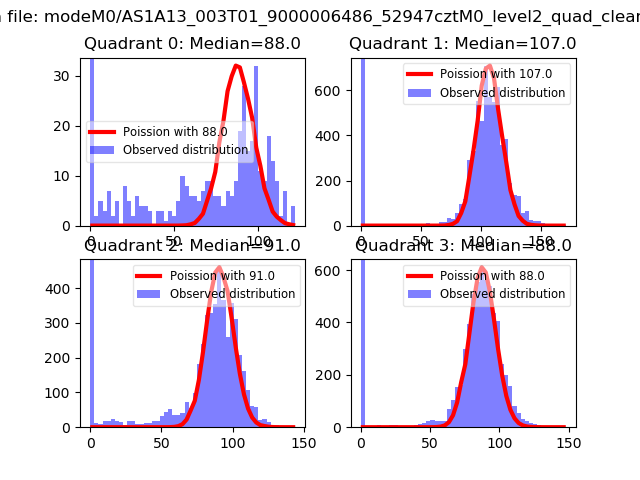 |
 |
| Quadrant-wise count rates Data is divided into 100 sec bins |
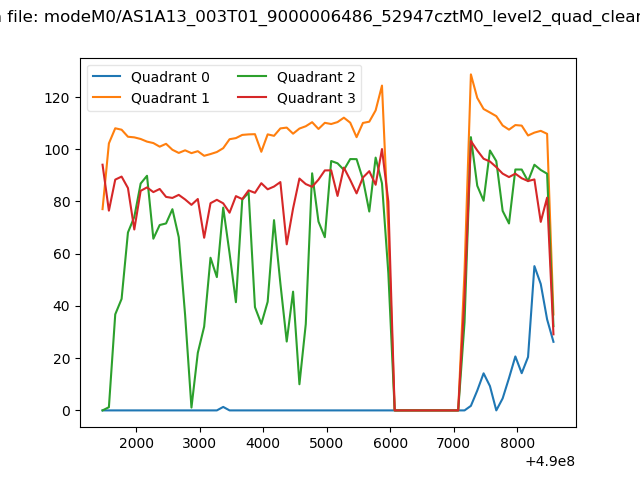 |
|
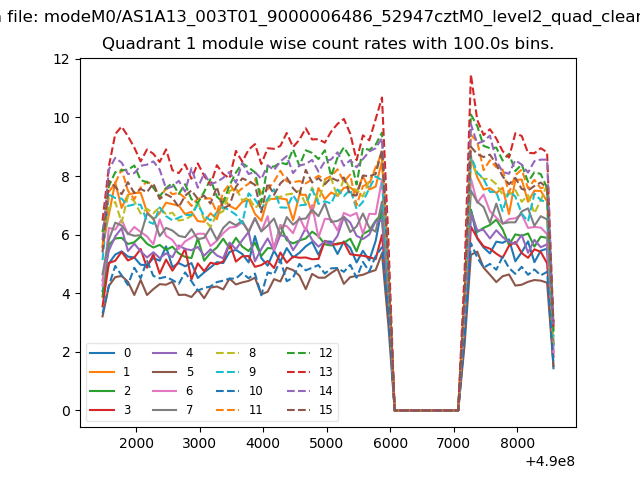
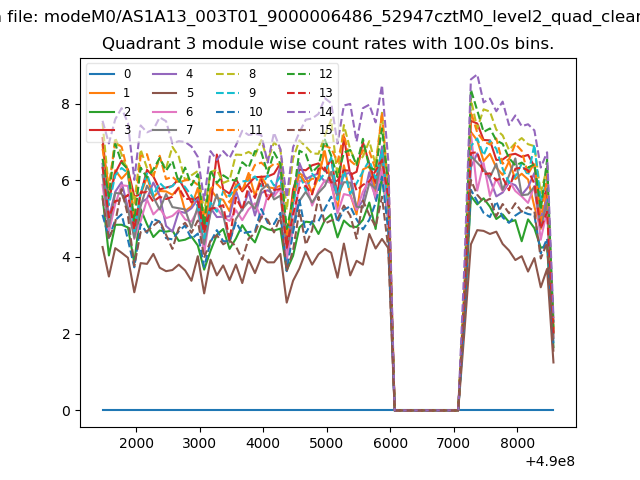
| Module-wise count rates for Quadrant A Data is divided into 100 sec bins |
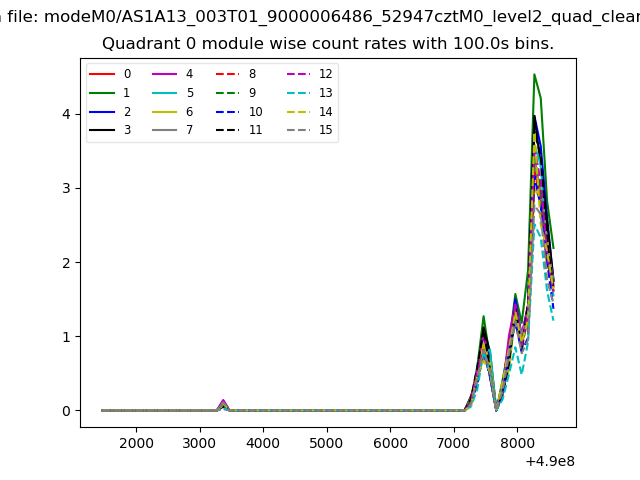 |
 |
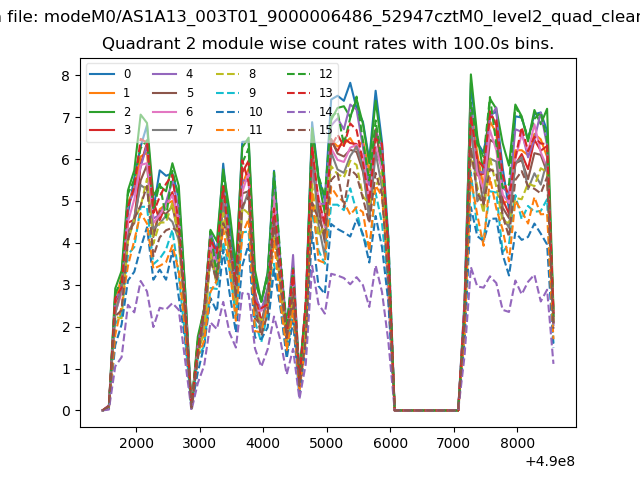
| Module-wise count rates for Quadrant B Data is divided into 100 sec bins |
 |
 |
| Module-wise count rates for Quadrant C Data is divided into 100 sec bins |
 |
 |
| Module-wise count rates for Quadrant D Data is divided into 100 sec bins |
 |
 |
| Parameter | Plot |
|---|---|
| CZT HV Monitor | 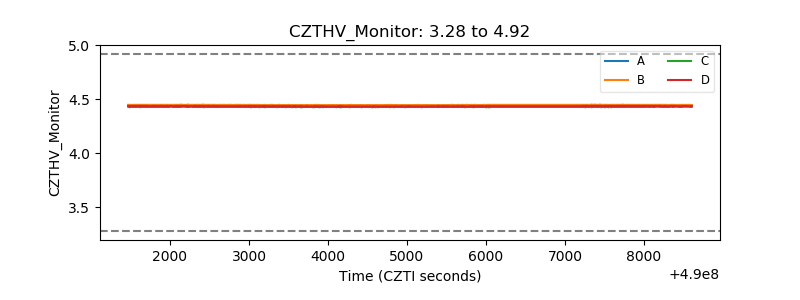 |
| D_VDD | 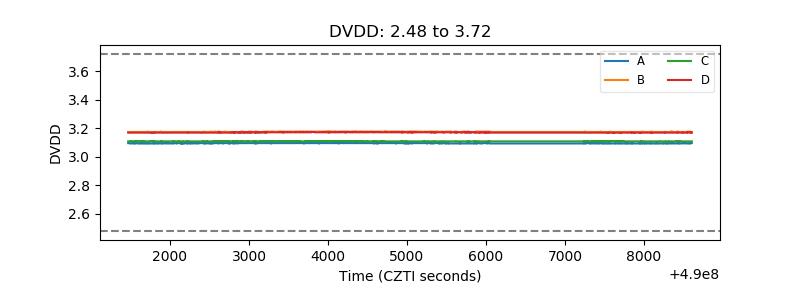 |
| Temperature 1 | 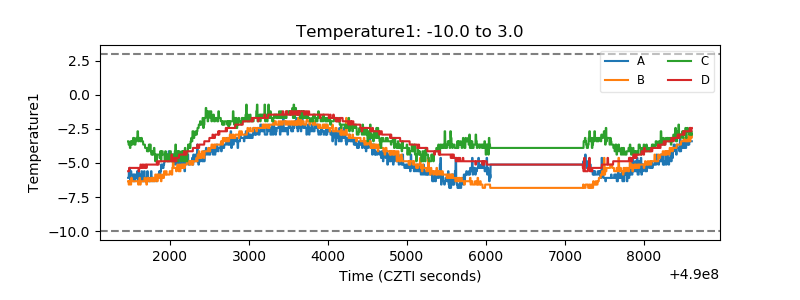 |
| Veto HV Monitor | 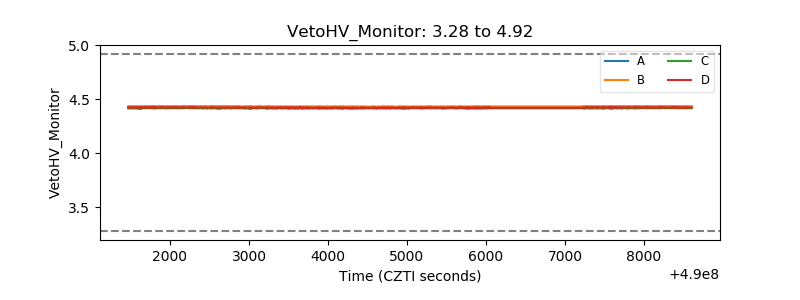 |
| Veto LLD | 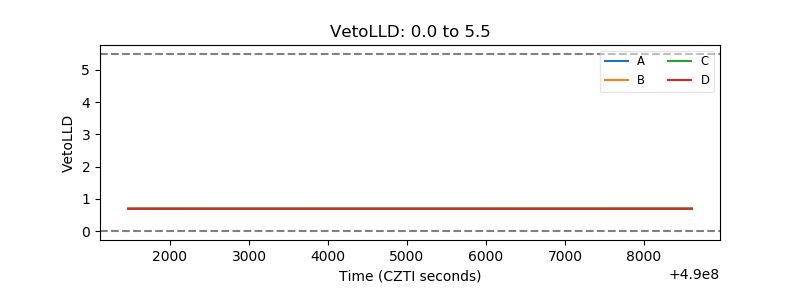 |
| Alpha Counter | 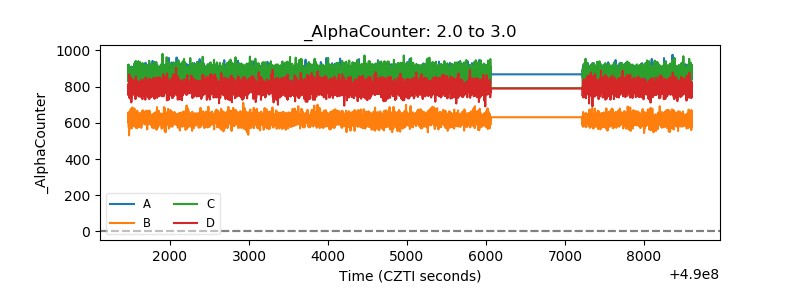 |
| _CPM_Rate | 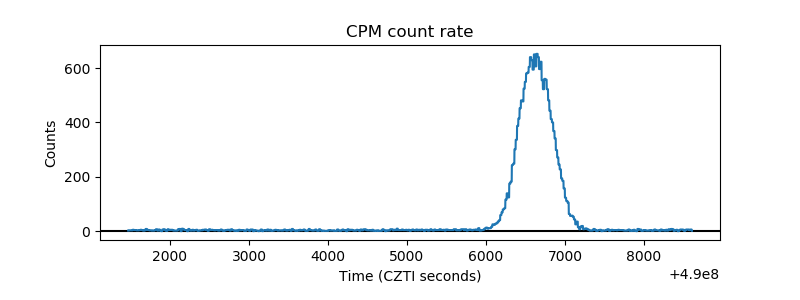 |
| CZT Counter | 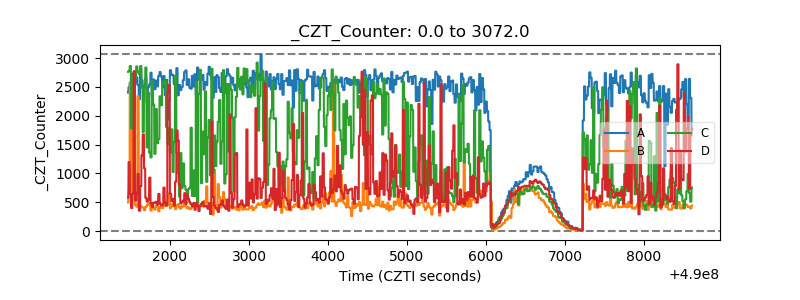 |
| +2.5 Volts monitor | 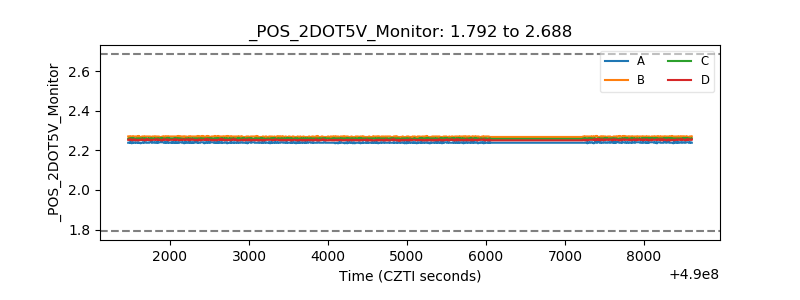 |
| +5 Volts monitor | 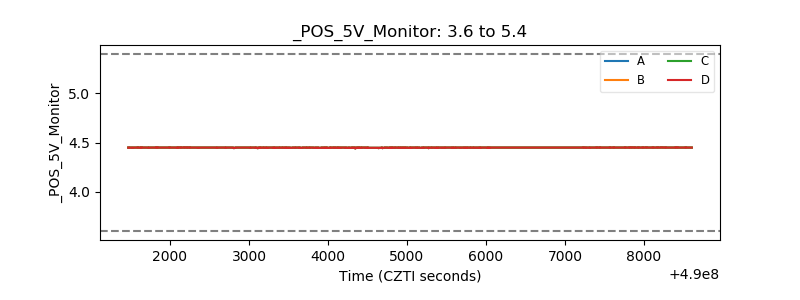 |
| _ROLL_ROT | 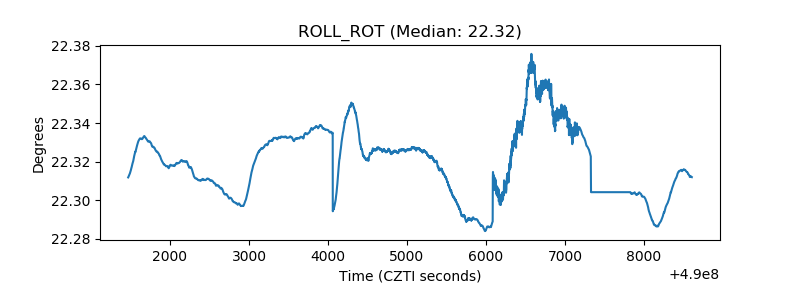 |
| _Roll_DEC | 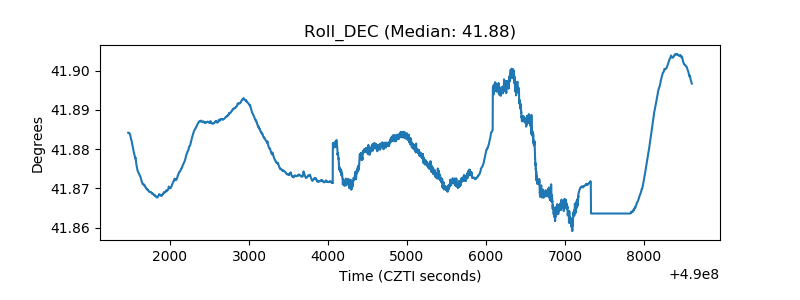 |
| _Roll_RA | 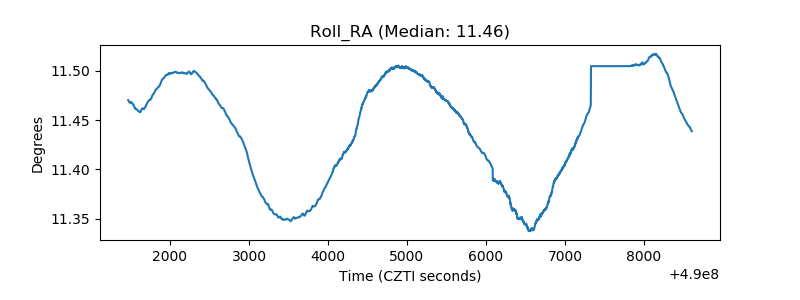 |
| Veto Counter | 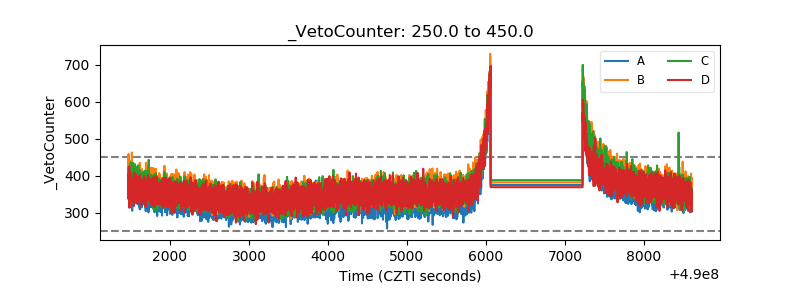 |