| Param | Original file | Final file |
|---|---|---|
| Filename | modeM0/AS1A13_003T01_9000006486_52948cztM0_level2.fits | modeM0/AS1A13_003T01_9000006486_52948cztM0_level2_quad_clean.evt |
| Size (bytes) | 796,760,640 | 64,555,200 |
| Size | 759.9 MB | 61.6 MB |
| Events in quadrant A | 14,136,793 | 51,027 |
| Events in quadrant B | 2,738,135 | 617,079 |
| Events in quadrant C | 6,922,377 | 399,581 |
| Events in quadrant D | 5,244,812 | 480,797 |
| Mode M9 | |||
|---|---|---|---|
| Quadrant | BADHDUFLAG | Total packets | Discarded packets |
| A | 0 | 12 | 0 |
| B | 0 | 12 | 0 |
| C | 0 | 12 | 0 |
| D | 0 | 12 | 0 |
| Mode M0 | |||
|---|---|---|---|
| Quadrant | BADHDUFLAG | Total packets | Discarded packets |
| A | 0 | 45944 | 1 |
| B | 0 | 12253 | 1 |
| C | 0 | 24467 | 8 |
| D | 0 | 19478 | 1 |
| Mode SS | |||
|---|---|---|---|
| Quadrant | BADHDUFLAG | Total packets | Discarded packets |
| A | 0 | 116 | 0 |
| B | 0 | 116 | 0 |
| C | 0 | 116 | 0 |
| D | 0 | 116 | 0 |
| Quadrant | Total seconds | Saturated seconds | Saturation percentage |
|---|---|---|---|
| A | 5817 | 5412 | 93.037648% |
| B | 5817 | 117 | 2.011346% |
| C | 5816 | 1578 | 27.132050% |
| D | 5816 | 542 | 9.319120% |
Noise dominated data is calculated using 1-second bins in cleaned event files. If a bin has >2000 counts, and if more than 50% of those come from <1% of pixels, then it is considered to be noise-dominated and hence unusable.
| Quadrant | # 1 sec bins | Bins with >0 counts | Bins with >2000 counts | High rate bins dominated by noise | Noise dominated (total time) | Noise dominated (detector-on time) | Marked lightcurve |
|---|---|---|---|---|---|---|---|
| A | 6951 | 5816 | 5035 | 5035 | 72.44% | 86.57% | 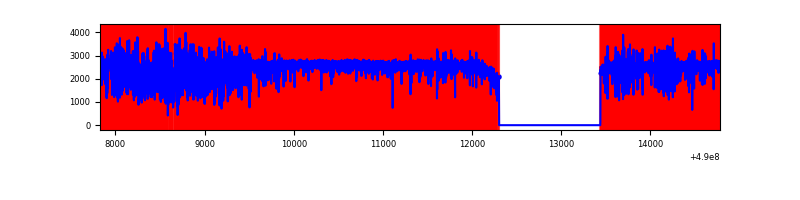 |
| B | 6952 | 5817 | 7 | 7 | 0.10% | 0.12% | 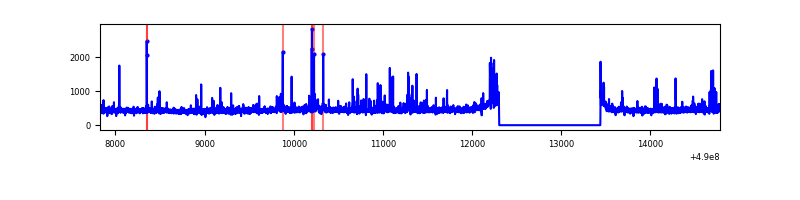 |
| C | 6950 | 5815 | 1416 | 1416 | 20.37% | 24.35% | 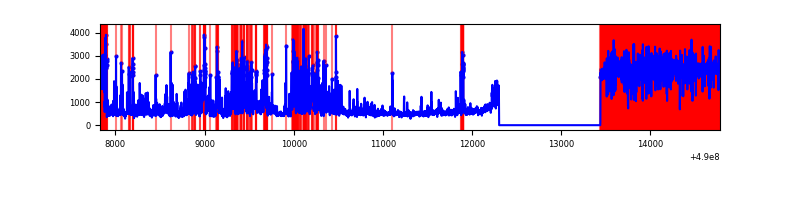 |
| D | 6951 | 5816 | 458 | 458 | 6.59% | 7.87% | 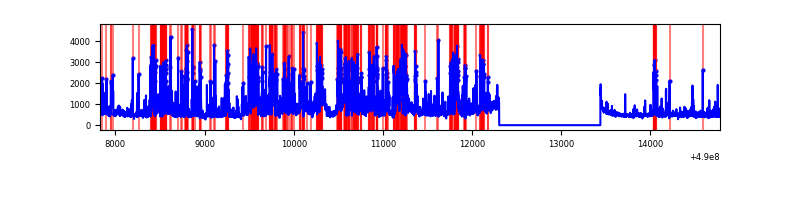 |
Top three noisy pixels from each quadrant. If the there are fewer than three noisy pixels in the level2.evt file, extra rows are filled as -1
| Pixel properties | Quadrant properties | ||||||
|---|---|---|---|---|---|---|---|
| Quadrant | DetID | PixID | Counts | Sigma | Mean | Median | Sigma |
| A | 9 | 191 | 12822041 | 172411.01 | 295 | 287 | 74.4 |
| A | 12 | 17 | 64940 | 869.37 | 295 | 287 | 74.4 |
| A | 3 | 78 | 23562 | 312.97 | 295 | 287 | 74.4 |
| B | 10 | 247 | 71115 | 516.67 | 634 | 611 | 136.5 |
| B | 0 | 171 | 25094 | 179.42 | 634 | 611 | 136.5 |
| B | 4 | 81 | 22192 | 158.15 | 634 | 611 | 136.5 |
| C | 10 | 171 | 2981157 | 19841.29 | 543 | 537 | 150.2 |
| C | 2 | 239 | 745020 | 4955.85 | 543 | 537 | 150.2 |
| C | 4 | 5 | 463329 | 3080.7 | 543 | 537 | 150.2 |
| D | 8 | 176 | 1567595 | 9046.66 | 603 | 574 | 173.2 |
| D | 15 | 78 | 362826 | 2091.34 | 603 | 574 | 173.2 |
| D | 6 | 42 | 209011 | 1203.34 | 603 | 574 | 173.2 |
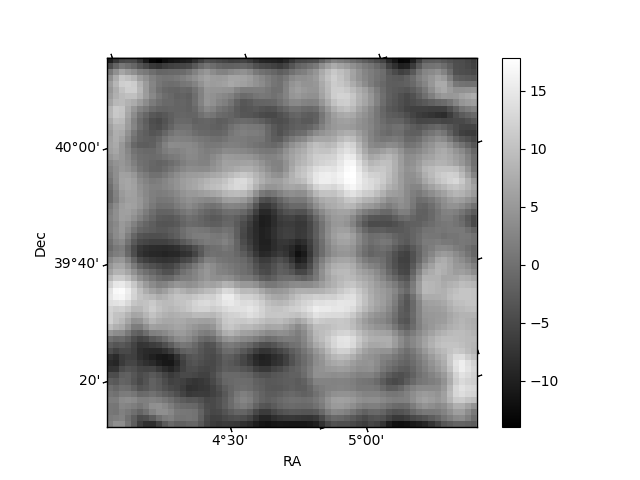
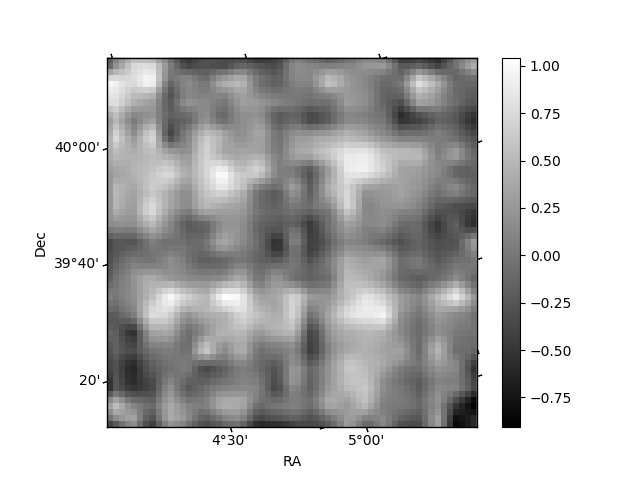
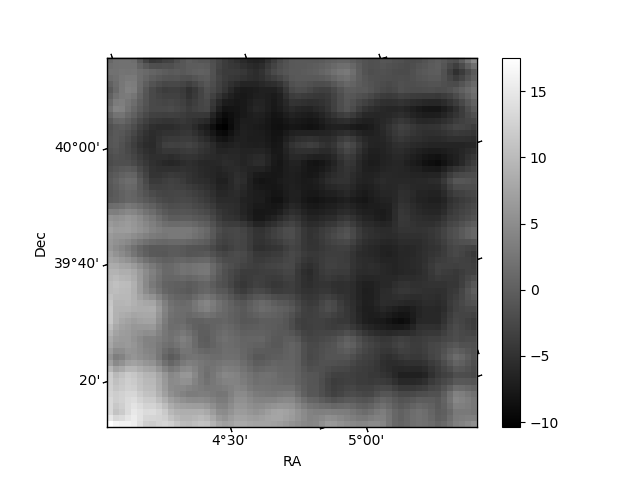
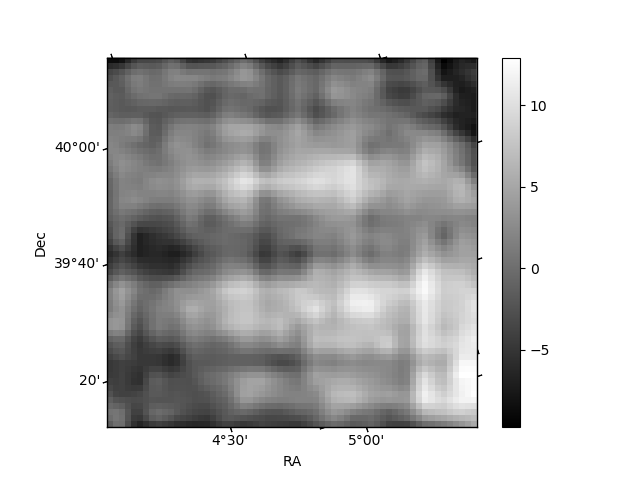
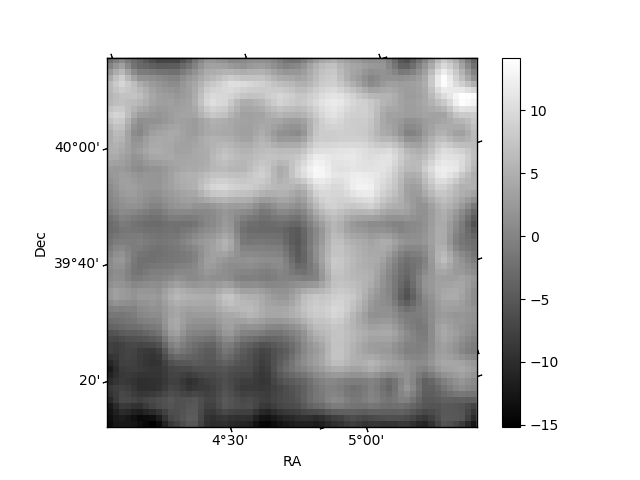
Histogram calculated using DETX and DETY for each event in the final _common_clean file
| Quadrant A | 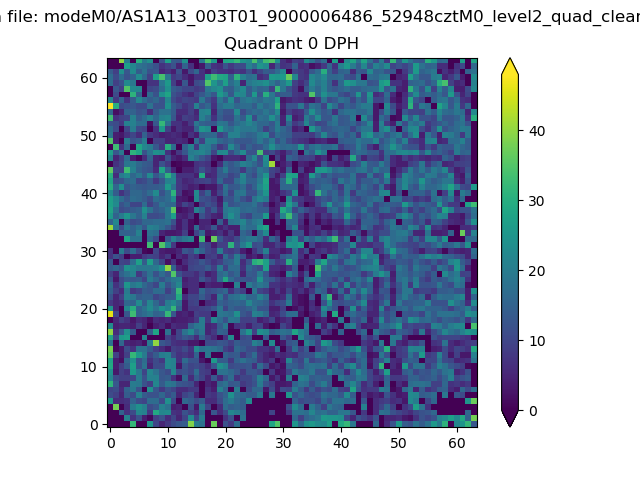 |
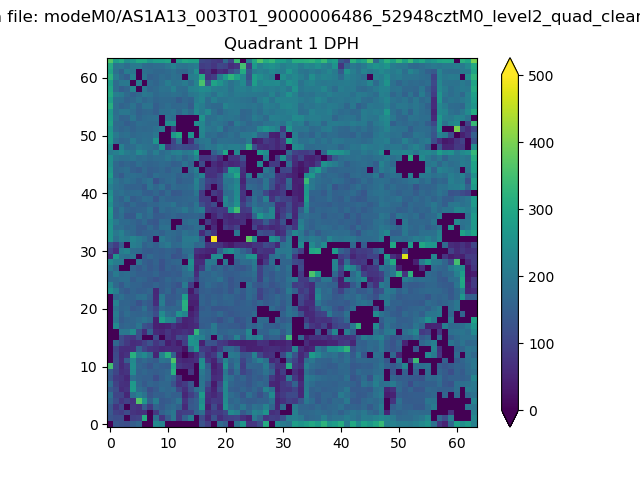 |
Quadrant B |
|---|---|---|---|
| Quadrant D | 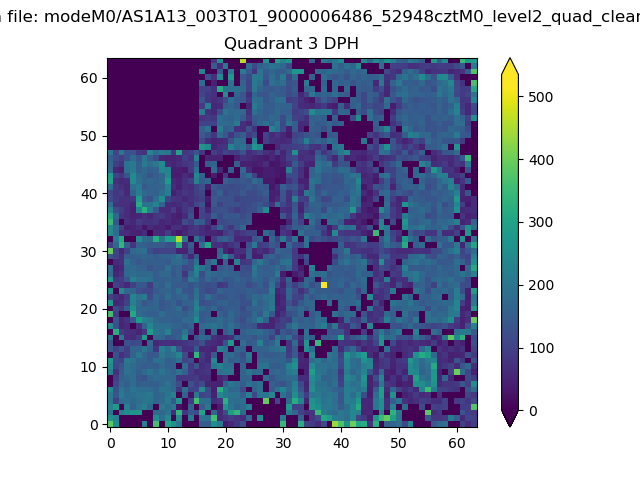 |
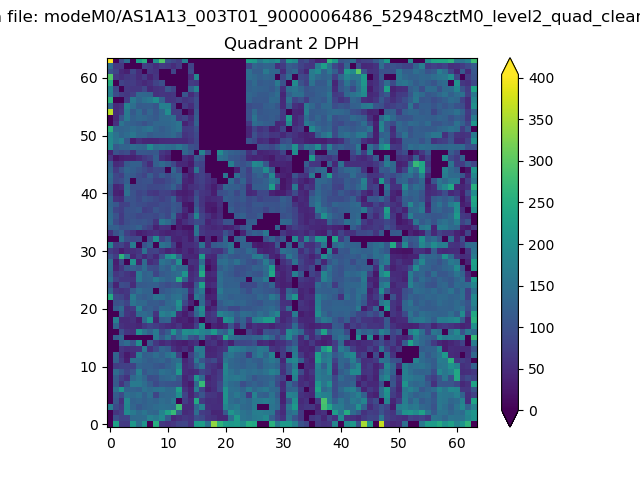 |
Quadrant C |
| Plot type | Count rate plots | Images |
|---|---|---|
| Comparison with Poisson distribution Blue bars denote a histogram of data divided into 1 sec bins. Red curve is a Poisson curve with rate = median count rate of data. |
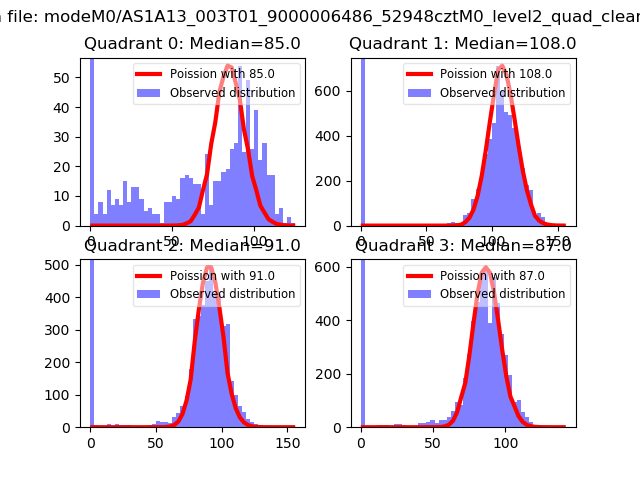 |
 |
| Quadrant-wise count rates Data is divided into 100 sec bins |
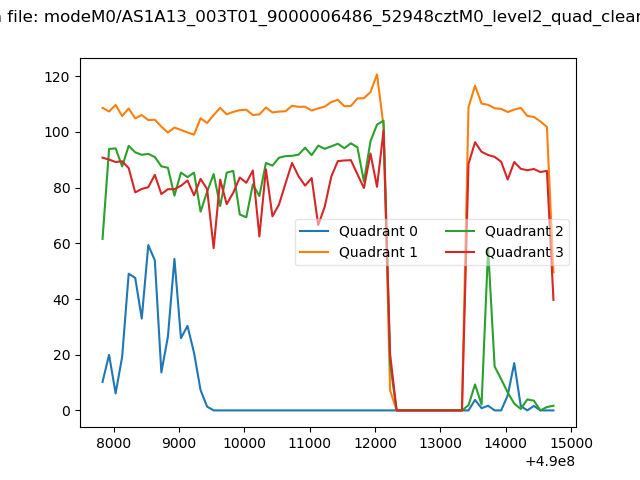 |
|
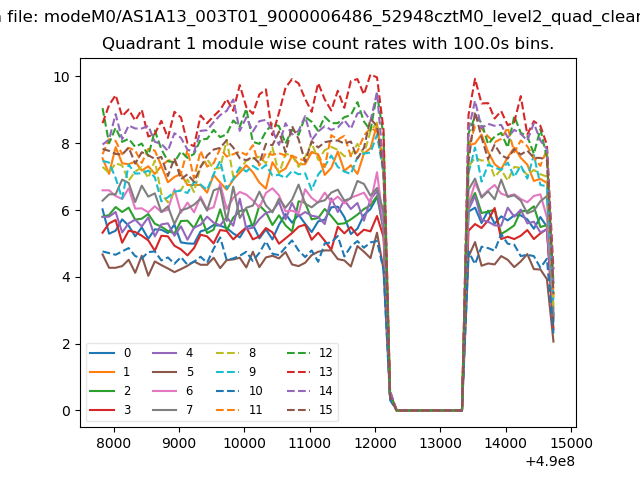
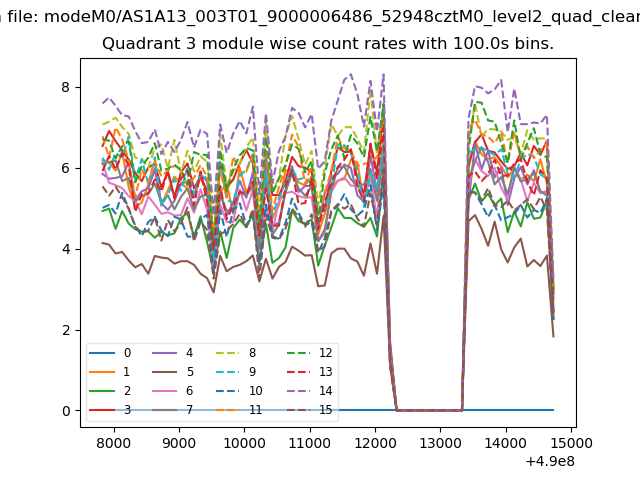
| Module-wise count rates for Quadrant A Data is divided into 100 sec bins |
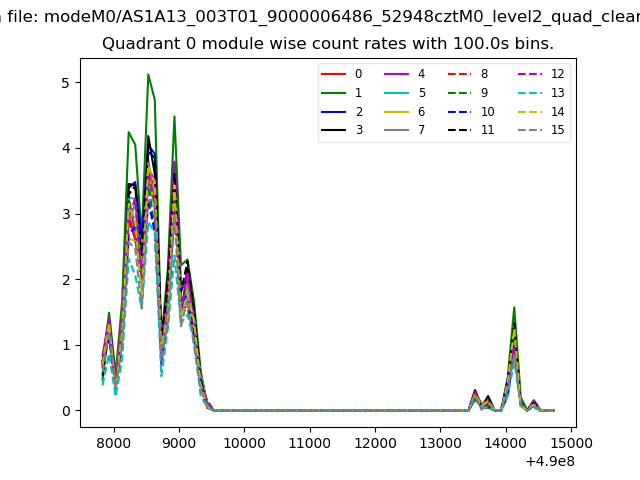 |
 |
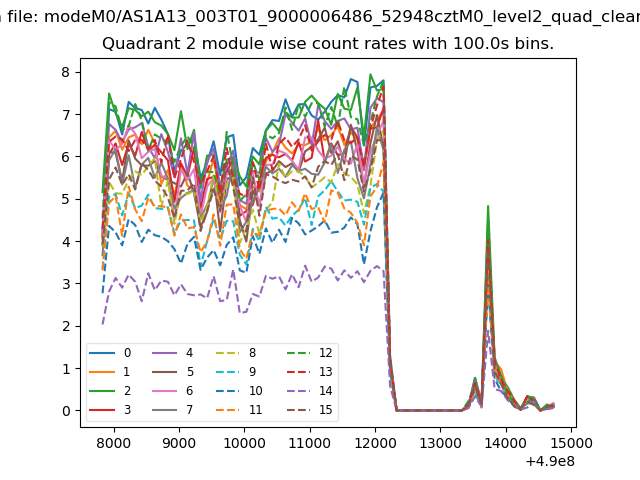
| Module-wise count rates for Quadrant B Data is divided into 100 sec bins |
 |
 |
| Module-wise count rates for Quadrant C Data is divided into 100 sec bins |
 |
 |
| Module-wise count rates for Quadrant D Data is divided into 100 sec bins |
 |
 |
| Parameter | Plot |
|---|---|
| CZT HV Monitor | 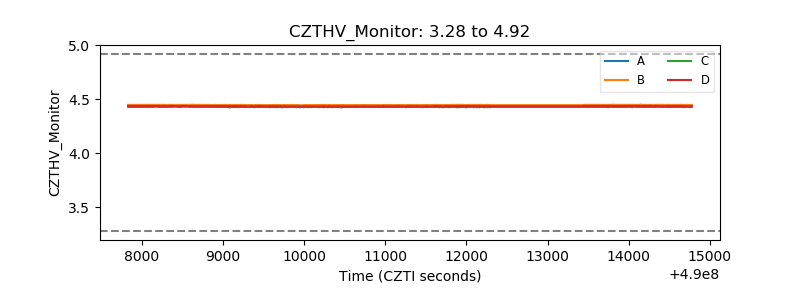 |
| D_VDD | 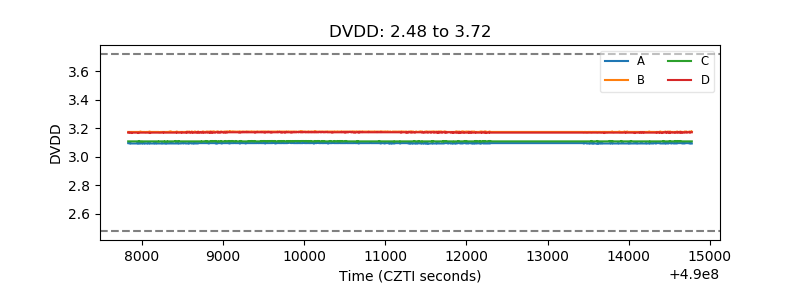 |
| Temperature 1 | 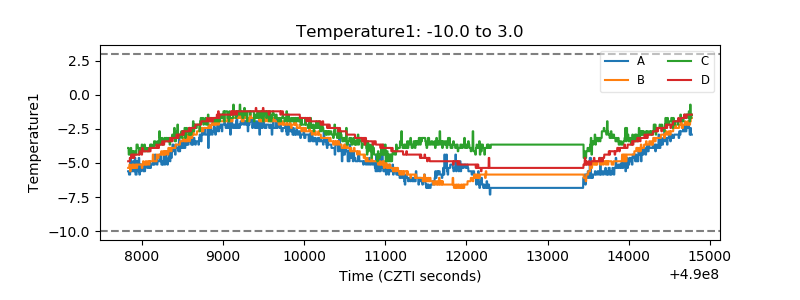 |
| Veto HV Monitor | 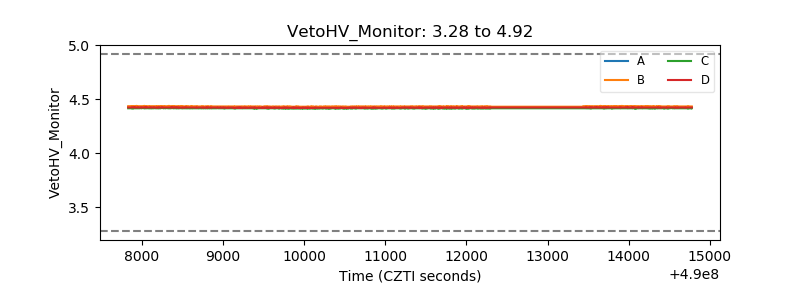 |
| Veto LLD | 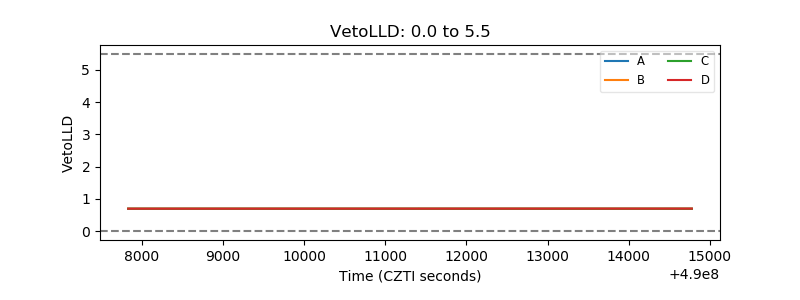 |
| Alpha Counter | 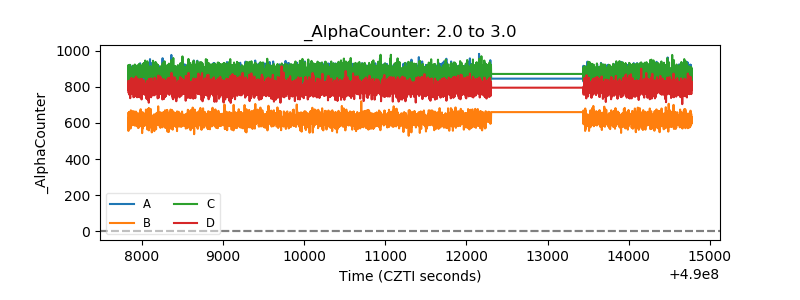 |
| _CPM_Rate | 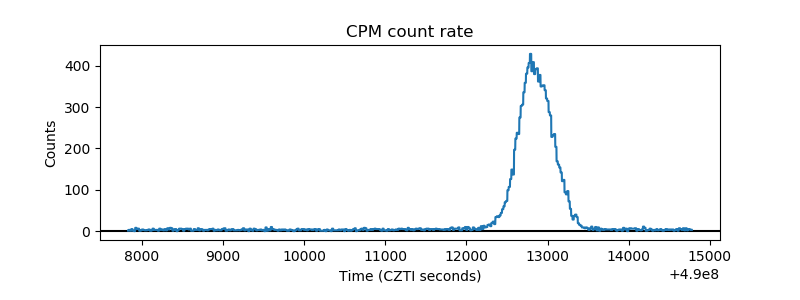 |
| CZT Counter | 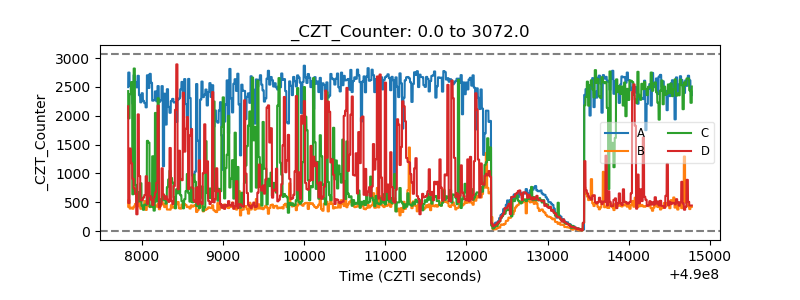 |
| +2.5 Volts monitor | 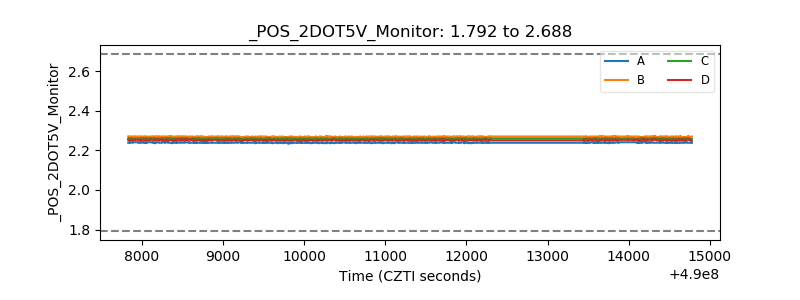 |
| +5 Volts monitor | 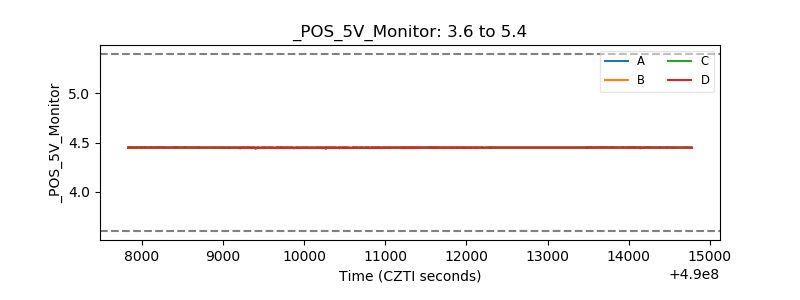 |
| _ROLL_ROT | 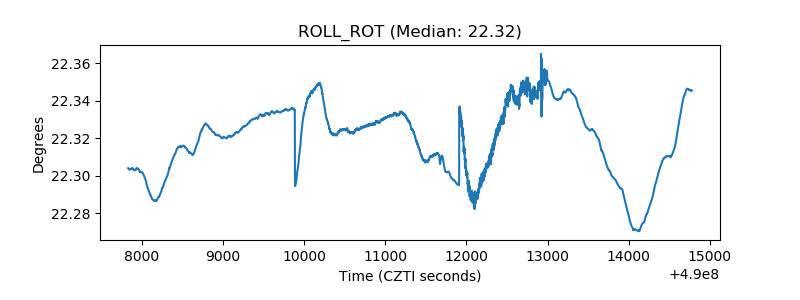 |
| _Roll_DEC | 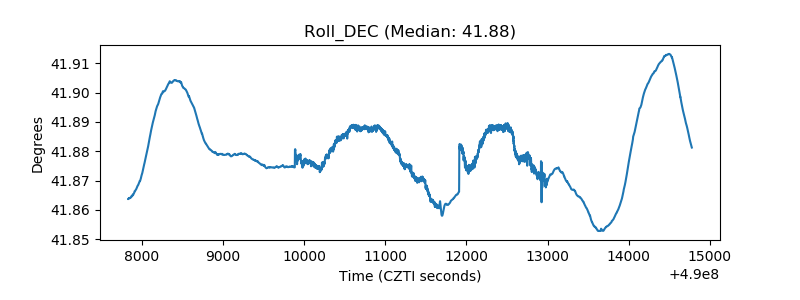 |
| _Roll_RA | 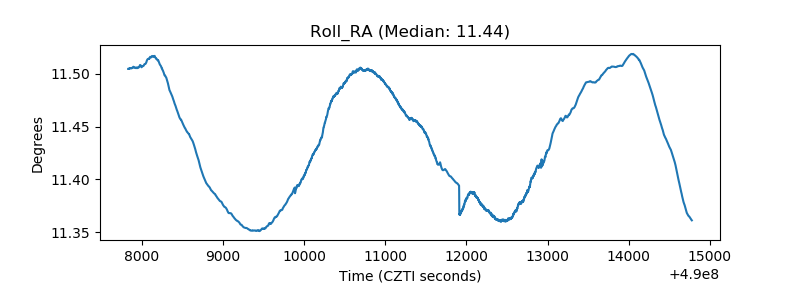 |
| Veto Counter | 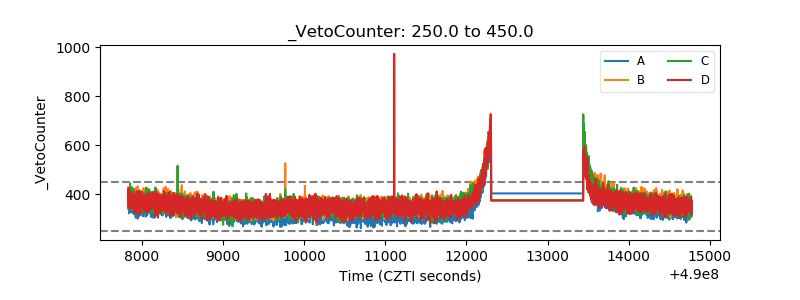 |