| Param | Original file | Final file |
|---|---|---|
| Filename | modeM0/AS1A13_003T01_9000006486_52949cztM0_level2.fits | modeM0/AS1A13_003T01_9000006486_52949cztM0_level2_quad_clean.evt |
| Size (bytes) | 3,963,263,040 | 268,606,080 |
| Size | 3.7 GB | 256.2 MB |
| Events in quadrant A | 65,275,844 | 77,387 |
| Events in quadrant B | 13,436,244 | 2,750,786 |
| Events in quadrant C | 42,968,713 | 1,366,855 |
| Events in quadrant D | 23,015,819 | 2,139,465 |
| Mode M9 | |||
|---|---|---|---|
| Quadrant | BADHDUFLAG | Total packets | Discarded packets |
| A | 0 | 55 | 0 |
| B | 0 | 55 | 0 |
| C | 0 | 55 | 0 |
| D | 0 | 55 | 0 |
| Mode M0 | |||
|---|---|---|---|
| Quadrant | BADHDUFLAG | Total packets | Discarded packets |
| A | 0 | 211646 | 5 |
| B | 0 | 58065 | 8 |
| C | 0 | 145706 | 5 |
| D | 0 | 86168 | 5 |
| Mode SS | |||
|---|---|---|---|
| Quadrant | BADHDUFLAG | Total packets | Discarded packets |
| A | 0 | 532 | 0 |
| B | 0 | 532 | 0 |
| C | 0 | 532 | 0 |
| D | 0 | 532 | 0 |
| Quadrant | Total seconds | Saturated seconds | Saturation percentage |
|---|---|---|---|
| A | 26132 | 25517 | 97.646564% |
| B | 26132 | 604 | 2.311342% |
| C | 26132 | 11503 | 44.018827% |
| D | 26132 | 2460 | 9.413746% |
Noise dominated data is calculated using 1-second bins in cleaned event files. If a bin has >2000 counts, and if more than 50% of those come from <1% of pixels, then it is considered to be noise-dominated and hence unusable.
| Quadrant | # 1 sec bins | Bins with >0 counts | Bins with >2000 counts | High rate bins dominated by noise | Noise dominated (total time) | Noise dominated (detector-on time) | Marked lightcurve |
|---|---|---|---|---|---|---|---|
| A | 31586 | 26131 | 24277 | 24277 | 76.86% | 92.90% | 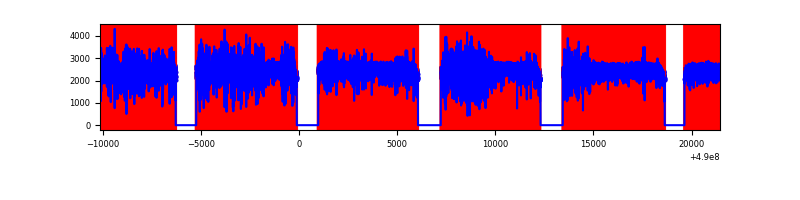 |
| B | 31587 | 26135 | 173 | 173 | 0.55% | 0.66% | 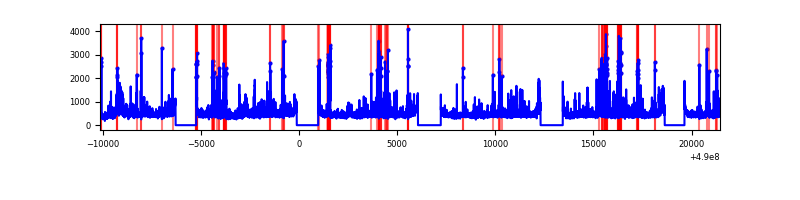 |
| C | 31587 | 26136 | 10062 | 10062 | 31.85% | 38.50% | 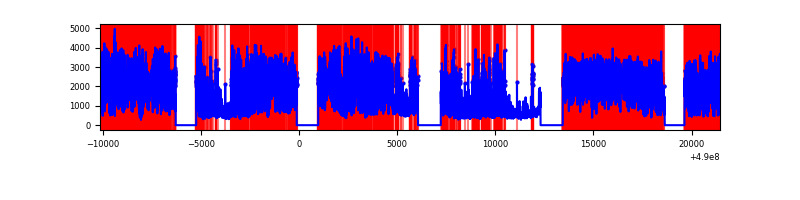 |
| D | 31587 | 26135 | 1836 | 1836 | 5.81% | 7.03% | 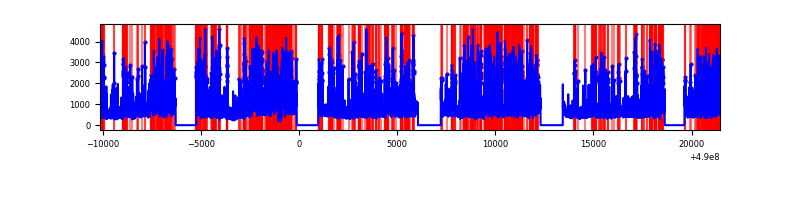 |
Top three noisy pixels from each quadrant. If the there are fewer than three noisy pixels in the level2.evt file, extra rows are filled as -1
| Pixel properties | Quadrant properties | ||||||
|---|---|---|---|---|---|---|---|
| Quadrant | DetID | PixID | Counts | Sigma | Mean | Median | Sigma |
| A | 9 | 191 | 60121144 | 224856.85 | 1070 | 1044 | 267.4 |
| A | 12 | 17 | 226883 | 844.67 | 1070 | 1044 | 267.4 |
| A | 8 | 43 | 150077 | 557.4 | 1070 | 1044 | 267.4 |
| B | 1 | 255 | 508573 | 842.5 | 2820 | 2716 | 600.4 |
| B | 10 | 254 | 424628 | 702.69 | 2820 | 2716 | 600.4 |
| B | 10 | 63 | 362392 | 599.04 | 2820 | 2716 | 600.4 |
| C | 10 | 171 | 13618819 | 22278.08 | 2209 | 2187 | 611.2 |
| C | 15 | 254 | 8055750 | 13176.38 | 2209 | 2187 | 611.2 |
| C | 7 | 80 | 4793475 | 7838.99 | 2209 | 2187 | 611.2 |
| D | 8 | 176 | 5612624 | 7480.2 | 2662 | 2543 | 750.0 |
| D | 15 | 78 | 2834876 | 3776.49 | 2662 | 2543 | 750.0 |
| D | 2 | 249 | 787032 | 1046.0 | 2662 | 2543 | 750.0 |
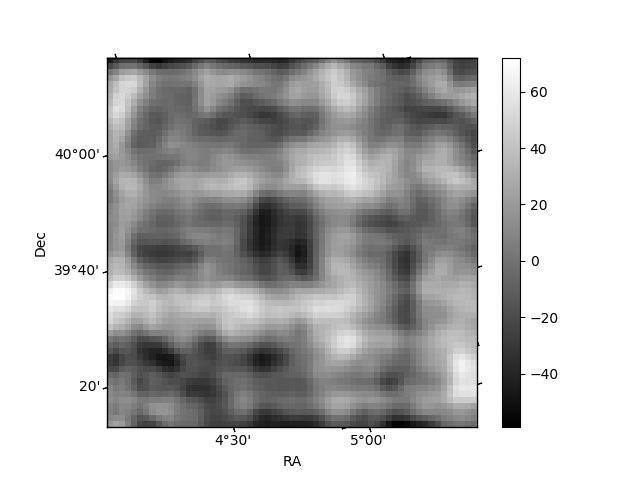
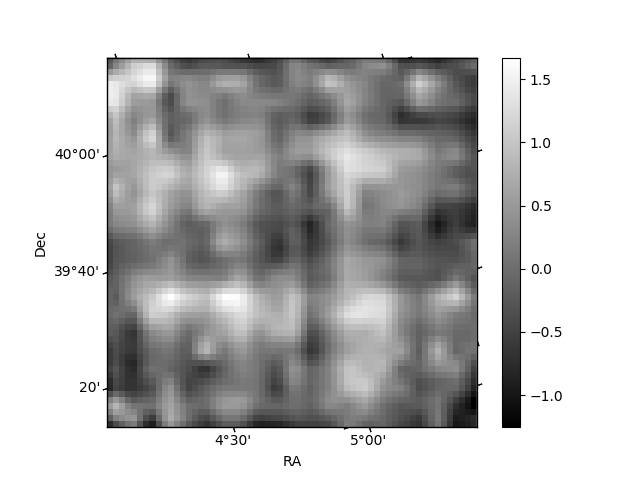
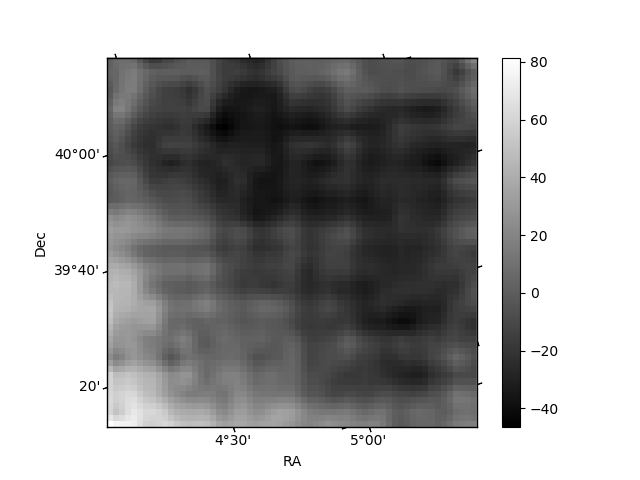
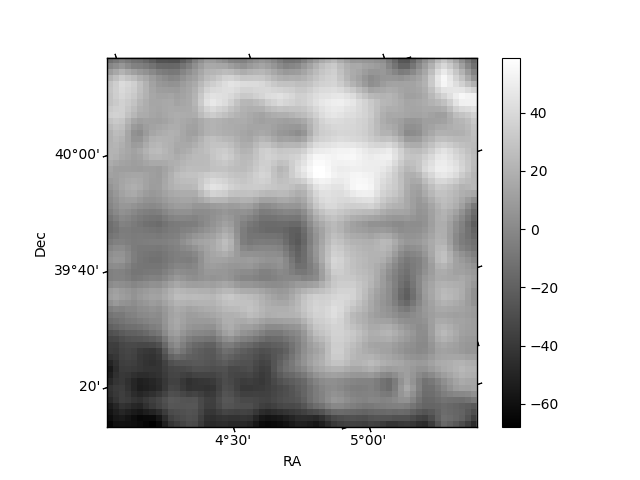
Histogram calculated using DETX and DETY for each event in the final _common_clean file
| Quadrant A | 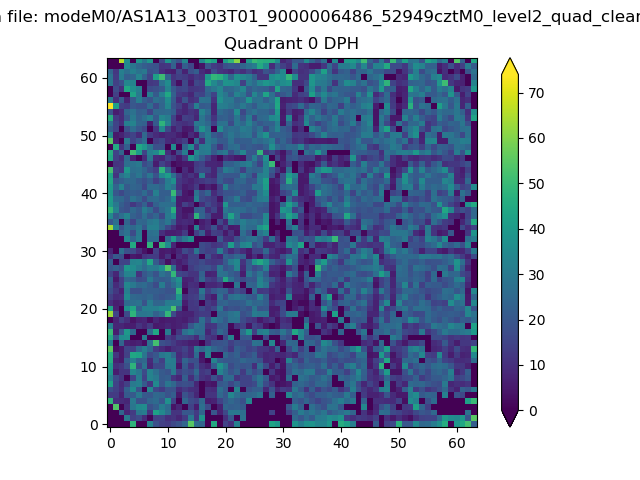 |
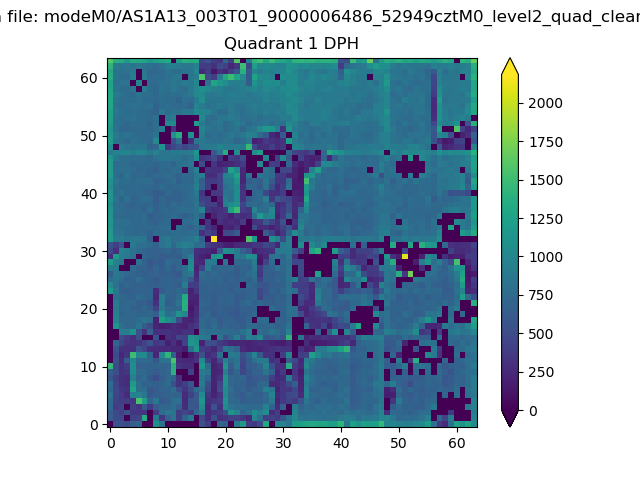 |
Quadrant B |
|---|---|---|---|
| Quadrant D | 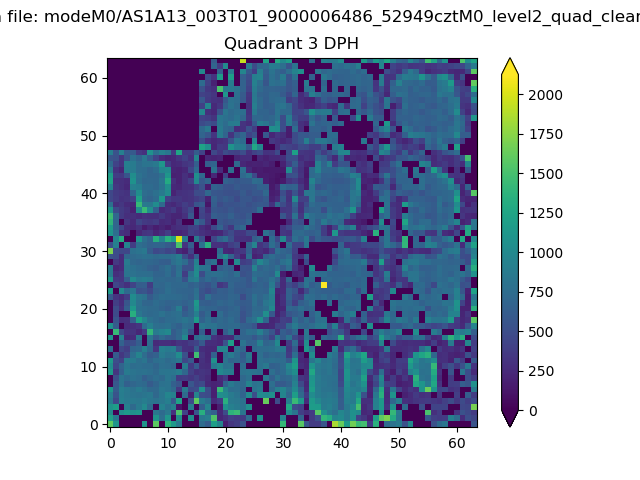 |
 |
Quadrant C |
| Plot type | Count rate plots | Images |
|---|---|---|
| Comparison with Poisson distribution Blue bars denote a histogram of data divided into 1 sec bins. Red curve is a Poisson curve with rate = median count rate of data. |
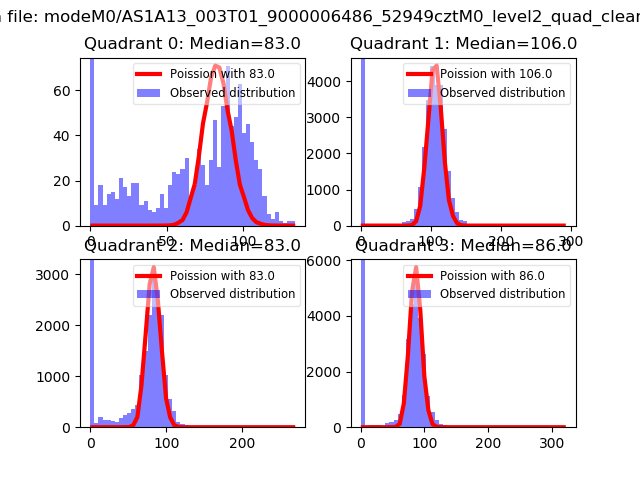 |
 |
| Quadrant-wise count rates Data is divided into 100 sec bins |
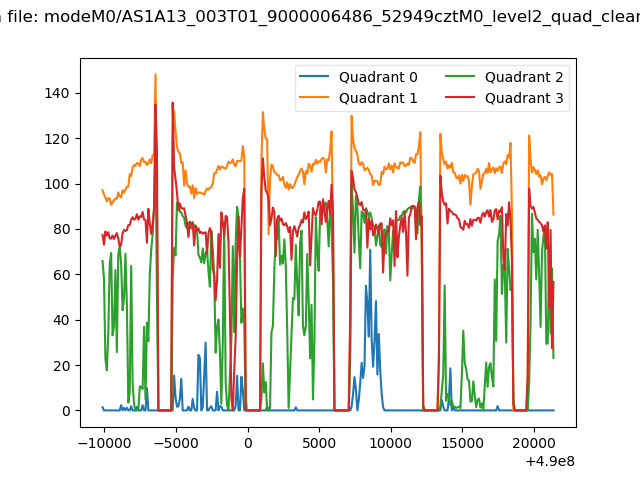 |
|
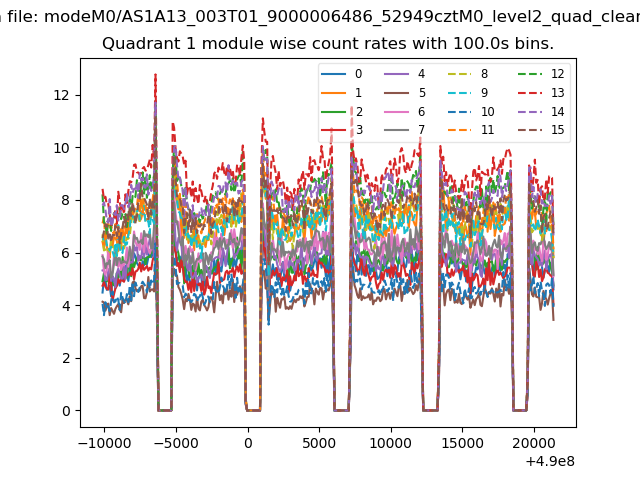
| Module-wise count rates for Quadrant A Data is divided into 100 sec bins |
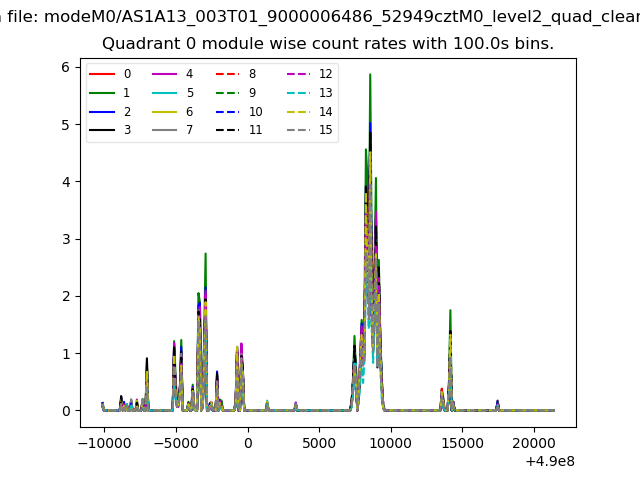 |
 |
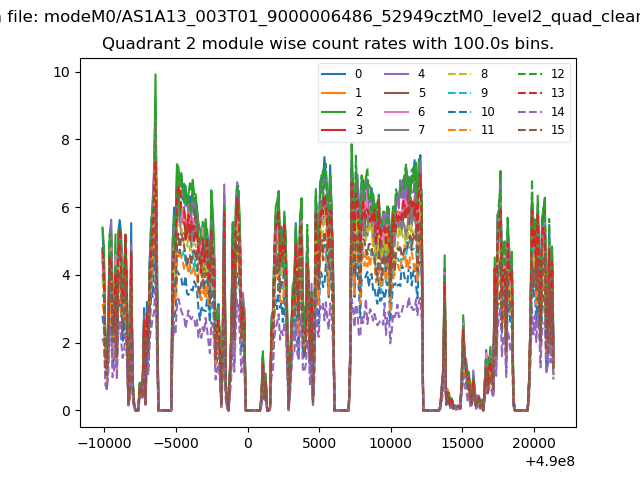
| Module-wise count rates for Quadrant B Data is divided into 100 sec bins |
 |
 |
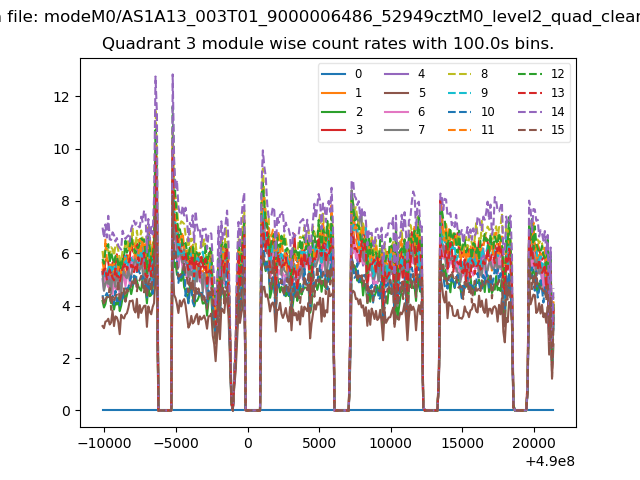
| Module-wise count rates for Quadrant C Data is divided into 100 sec bins |
 |
 |
| Module-wise count rates for Quadrant D Data is divided into 100 sec bins |
 |
 |
| Parameter | Plot |
|---|---|
| CZT HV Monitor | 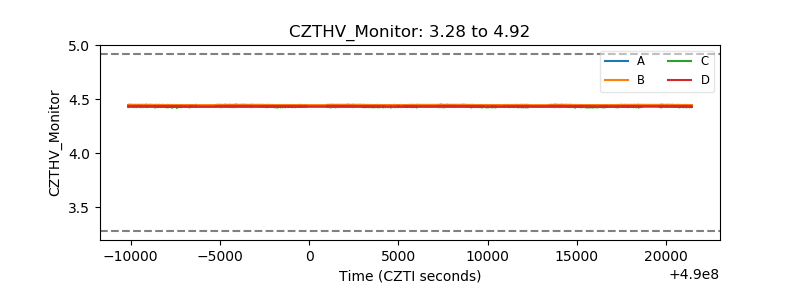 |
| D_VDD | 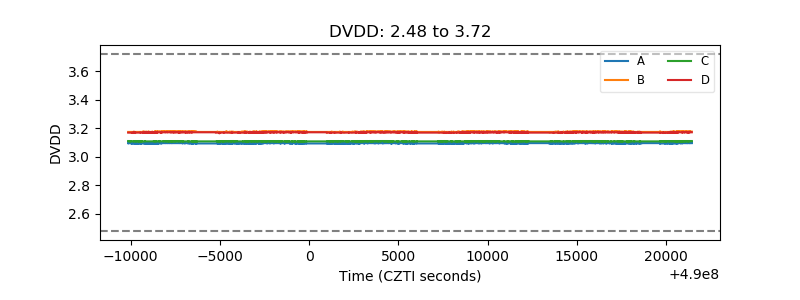 |
| Temperature 1 | 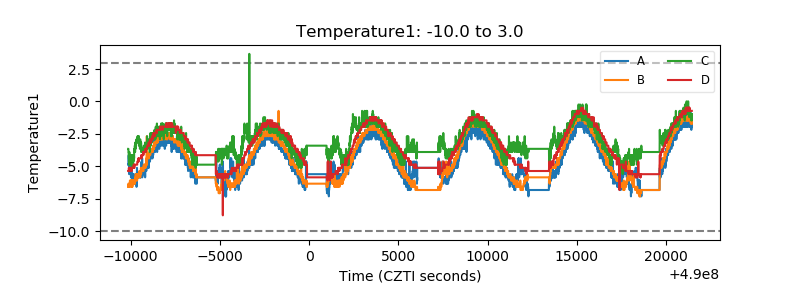 |
| Veto HV Monitor | 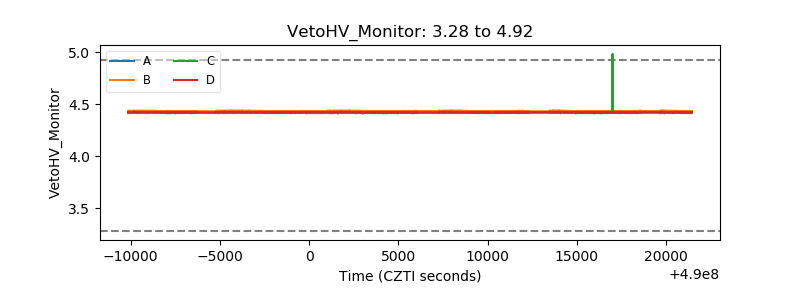 |
| Veto LLD | 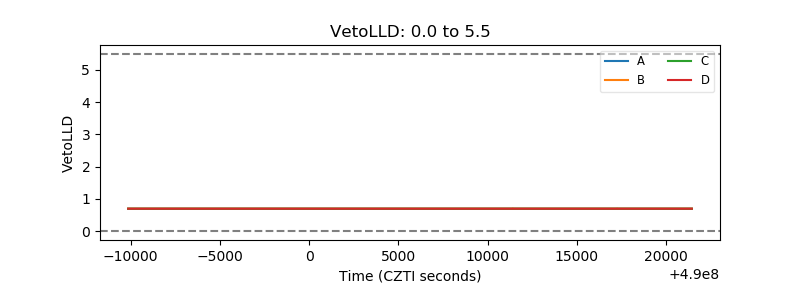 |
| Alpha Counter | 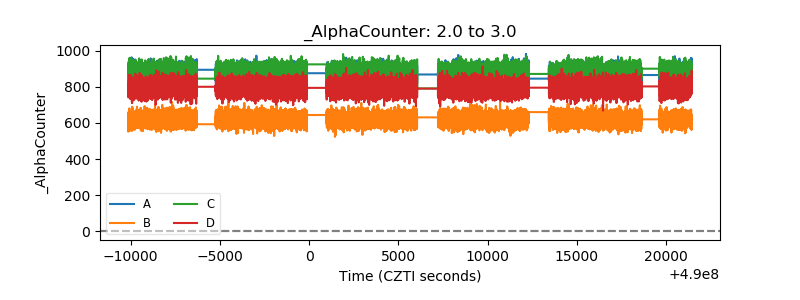 |
| _CPM_Rate | 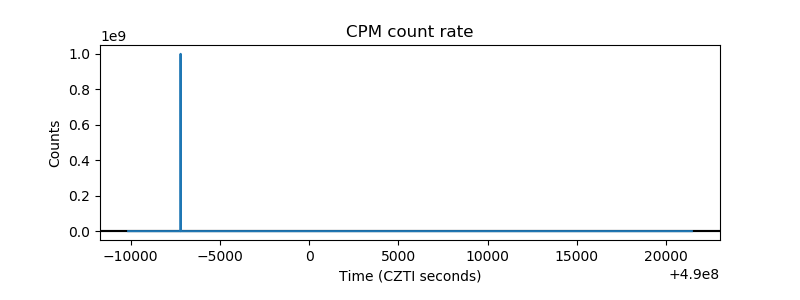 |
| CZT Counter | 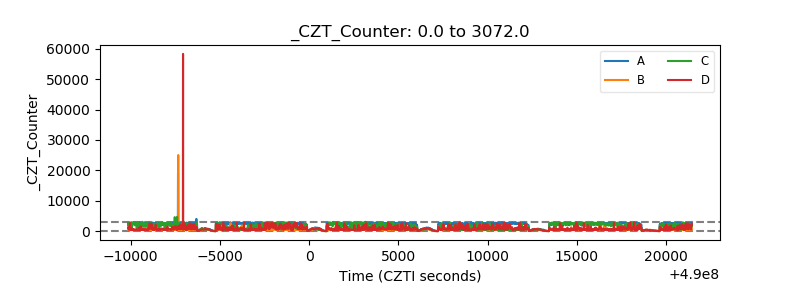 |
| +2.5 Volts monitor |  |
| +5 Volts monitor |  |
| _ROLL_ROT | 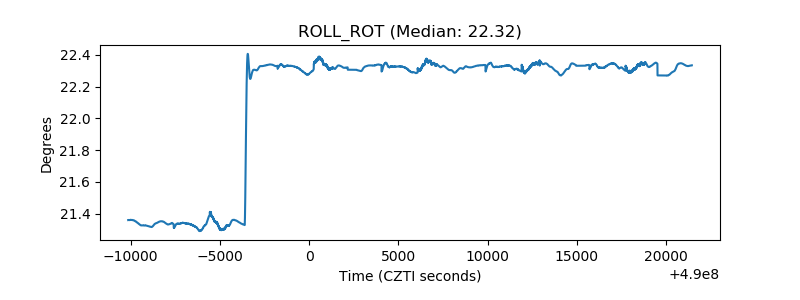 |
| _Roll_DEC | 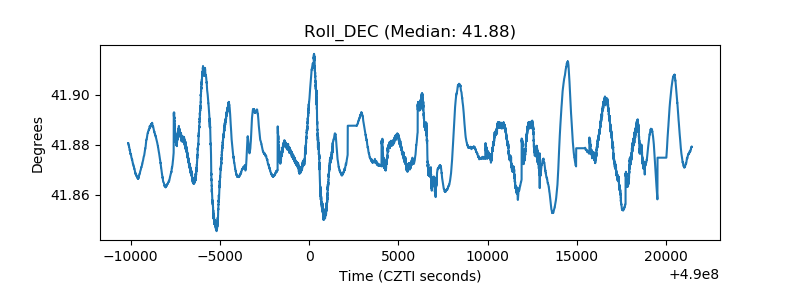 |
| _Roll_RA | 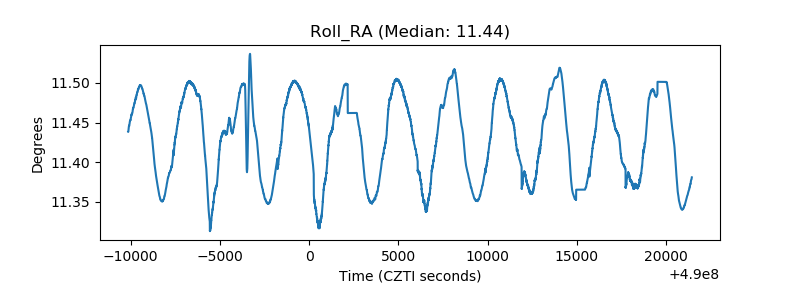 |
| Veto Counter | 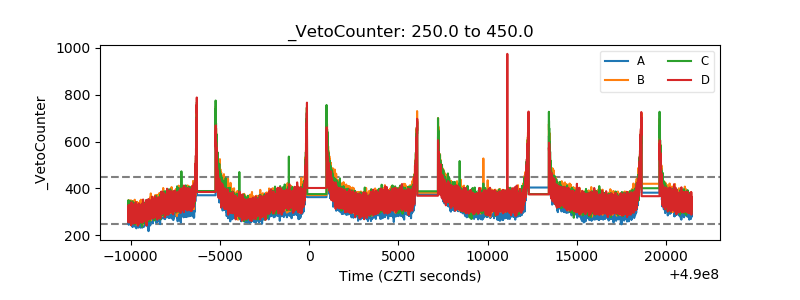 |