| Param | Original file | Final file |
|---|---|---|
| Filename | modeM0/AS1A13_003T01_9000006486_52950cztM0_level2.fits | modeM0/AS1A13_003T01_9000006486_52950cztM0_level2_quad_clean.evt |
| Size (bytes) | 1,100,373,120 | 77,944,320 |
| Size | 1.0 GB | 74.3 MB |
| Events in quadrant A | 17,201,530 | 123,954 |
| Events in quadrant B | 3,493,300 | 708,831 |
| Events in quadrant C | 13,457,892 | 479,577 |
| Events in quadrant D | 6,054,653 | 568,510 |
| Mode M9 | |||
|---|---|---|---|
| Quadrant | BADHDUFLAG | Total packets | Discarded packets |
| A | 0 | 7 | 0 |
| B | 0 | 7 | 0 |
| C | 0 | 7 | 0 |
| D | 0 | 7 | 0 |
| Mode M0 | |||
|---|---|---|---|
| Quadrant | BADHDUFLAG | Total packets | Discarded packets |
| A | 0 | 55528 | 0 |
| B | 0 | 15159 | 0 |
| C | 0 | 44627 | 0 |
| D | 0 | 22590 | 0 |
| Mode SS | |||
|---|---|---|---|
| Quadrant | BADHDUFLAG | Total packets | Discarded packets |
| A | 0 | 138 | 0 |
| B | 0 | 138 | 0 |
| C | 0 | 138 | 0 |
| D | 0 | 138 | 0 |
| Quadrant | Total seconds | Saturated seconds | Saturation percentage |
|---|---|---|---|
| A | 6792 | 6792 | 100.000000% |
| B | 6792 | 253 | 3.724971% |
| C | 6793 | 4212 | 62.005005% |
| D | 6793 | 668 | 9.833652% |
Noise dominated data is calculated using 1-second bins in cleaned event files. If a bin has >2000 counts, and if more than 50% of those come from <1% of pixels, then it is considered to be noise-dominated and hence unusable.
| Quadrant | # 1 sec bins | Bins with >0 counts | Bins with >2000 counts | High rate bins dominated by noise | Noise dominated (total time) | Noise dominated (detector-on time) | Marked lightcurve |
|---|---|---|---|---|---|---|---|
| A | 7526 | 6791 | 6713 | 6713 | 89.20% | 98.85% | 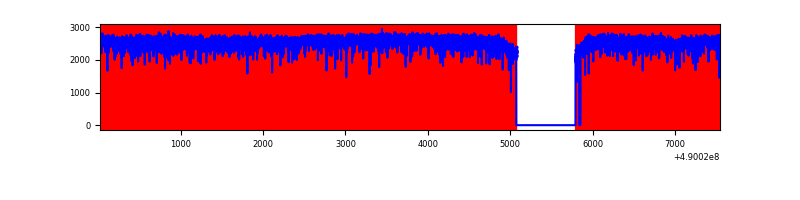 |
| B | 7527 | 6794 | 67 | 67 | 0.89% | 0.99% | 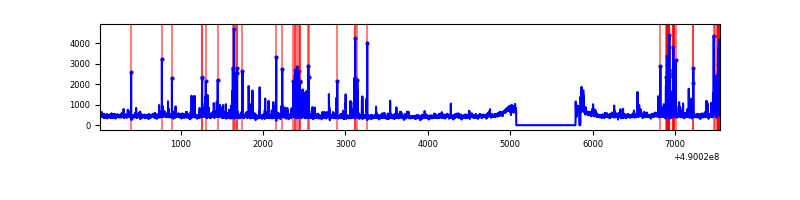 |
| C | 7528 | 6793 | 3634 | 3634 | 48.27% | 53.50% | 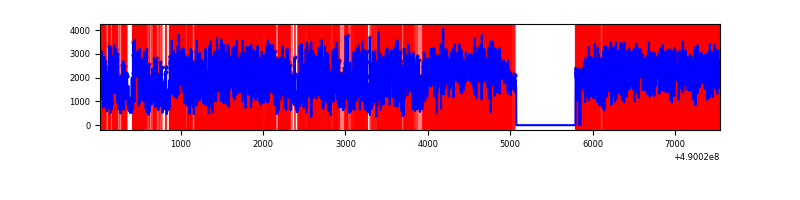 |
| D | 7528 | 6794 | 452 | 452 | 6.00% | 6.65% | 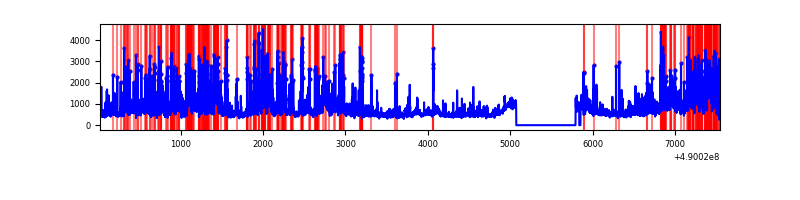 |
Top three noisy pixels from each quadrant. If the there are fewer than three noisy pixels in the level2.evt file, extra rows are filled as -1
| Pixel properties | Quadrant properties | ||||||
|---|---|---|---|---|---|---|---|
| Quadrant | DetID | PixID | Counts | Sigma | Mean | Median | Sigma |
| A | 9 | 191 | 16390159 | 404011.76 | 155 | 150 | 40.6 |
| A | 4 | 238 | 35381 | 868.44 | 155 | 150 | 40.6 |
| A | 3 | 78 | 32203 | 790.1 | 155 | 150 | 40.6 |
| B | 10 | 63 | 303086 | 1921.88 | 735 | 708 | 157.3 |
| B | 4 | 81 | 39815 | 248.56 | 735 | 708 | 157.3 |
| B | 7 | 252 | 38289 | 238.86 | 735 | 708 | 157.3 |
| C | 10 | 171 | 8297764 | 54001.72 | 561 | 557 | 153.6 |
| C | 12 | 254 | 963438 | 6266.84 | 561 | 557 | 153.6 |
| C | 2 | 239 | 720928 | 4688.48 | 561 | 557 | 153.6 |
| D | 8 | 176 | 1498531 | 7448.74 | 704 | 673 | 201.1 |
| D | 15 | 78 | 406250 | 2016.91 | 704 | 673 | 201.1 |
| D | 11 | 176 | 319190 | 1583.96 | 704 | 673 | 201.1 |
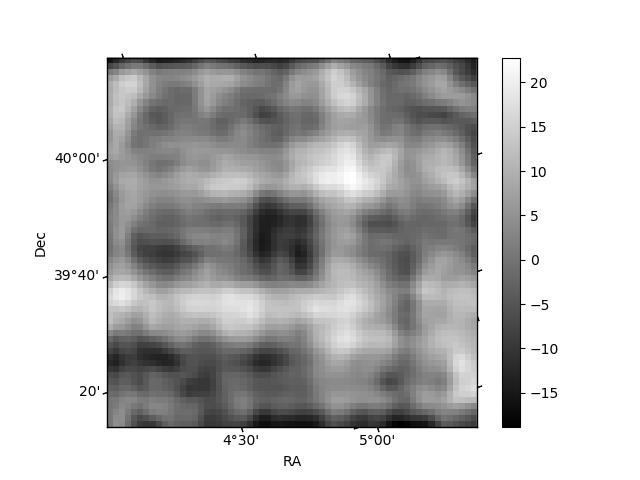
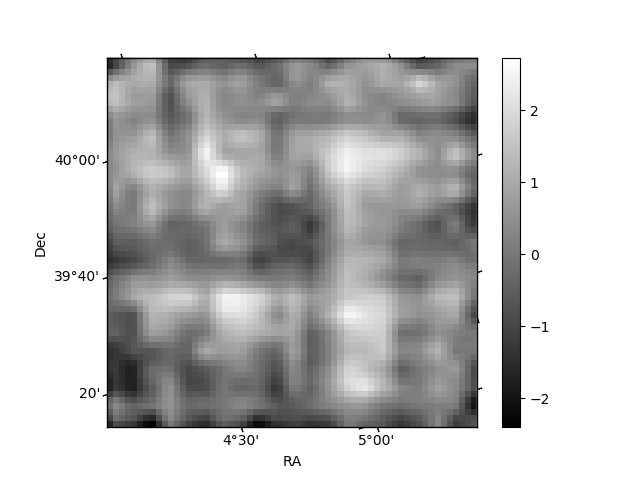
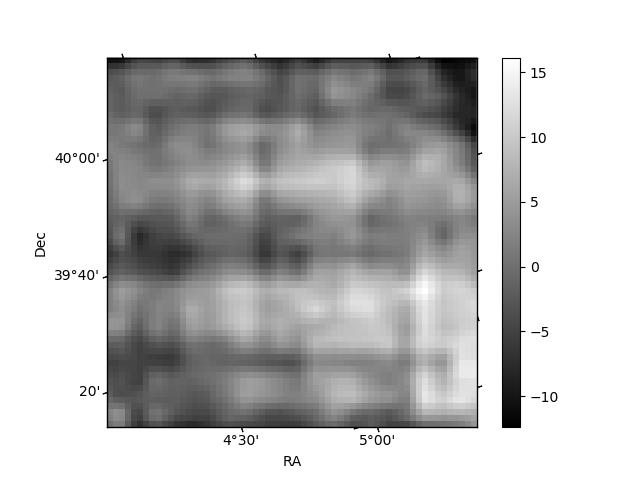
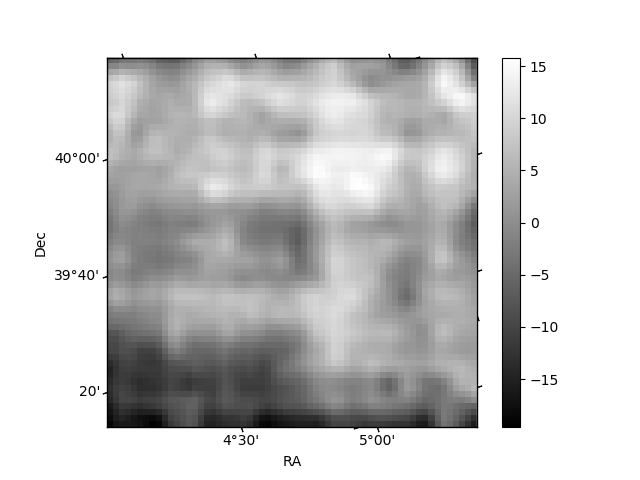
Histogram calculated using DETX and DETY for each event in the final _common_clean file
| Quadrant A | 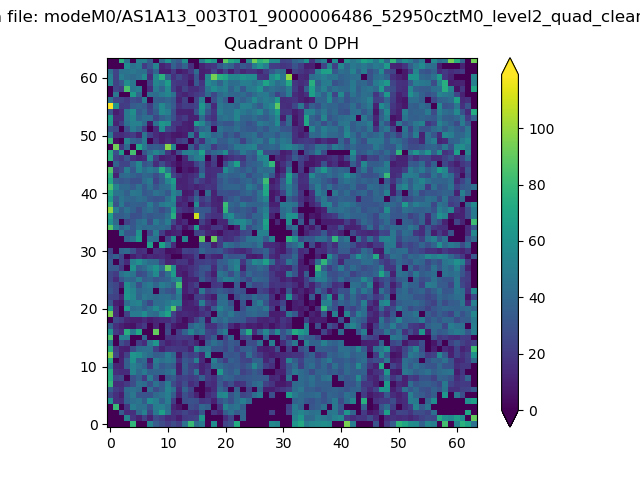 |
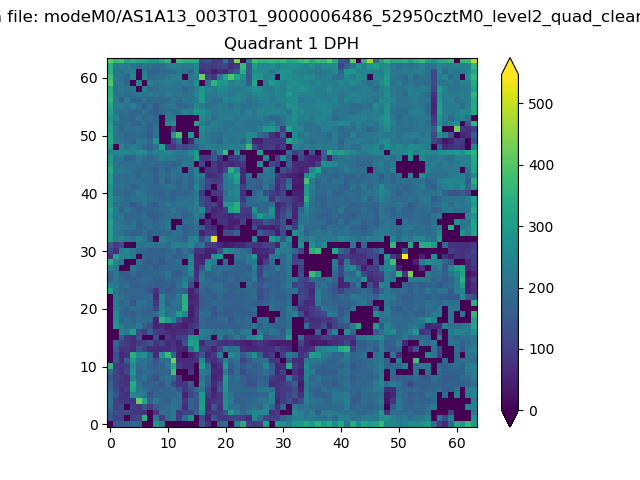 |
Quadrant B |
|---|---|---|---|
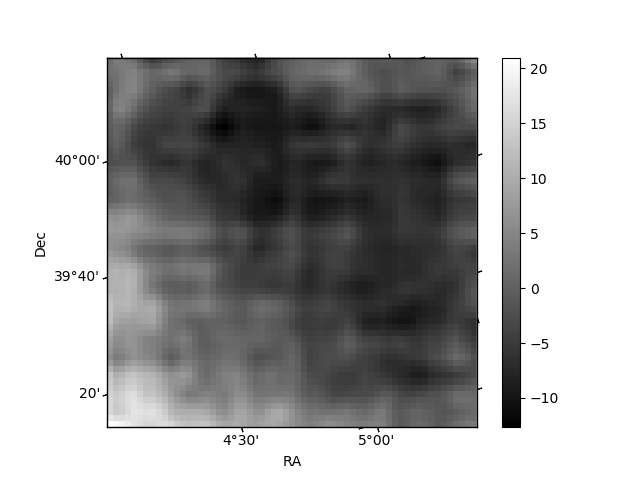
| Quadrant D | 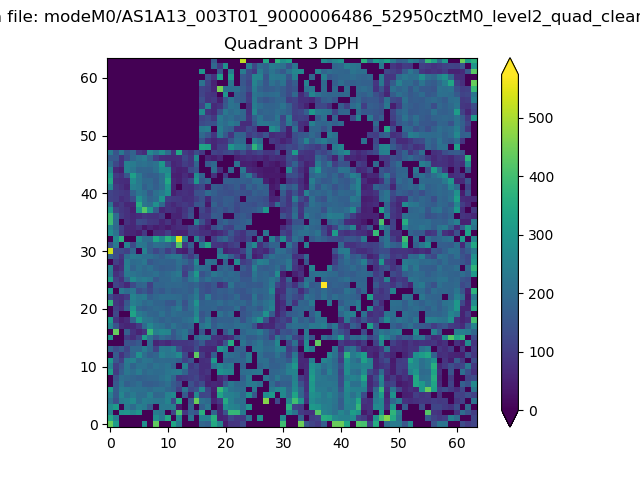 |
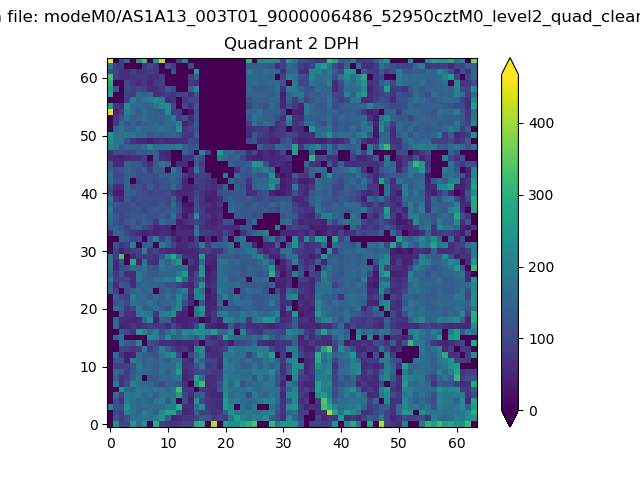 |
Quadrant C |
| Plot type | Count rate plots | Images |
|---|---|---|
| Comparison with Poisson distribution Blue bars denote a histogram of data divided into 1 sec bins. Red curve is a Poisson curve with rate = median count rate of data. |
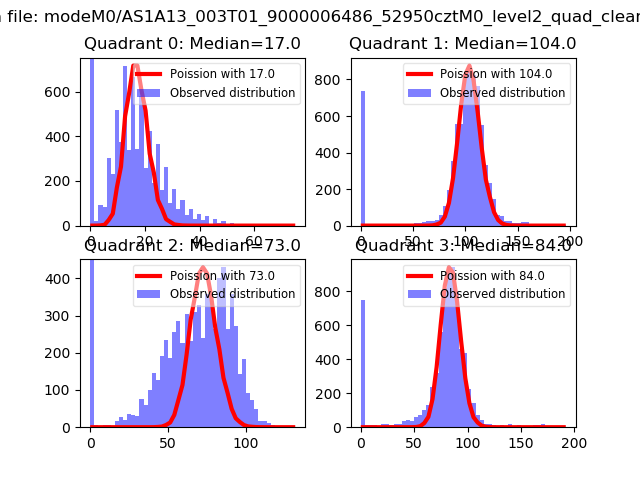 |
 |
| Quadrant-wise count rates Data is divided into 100 sec bins |
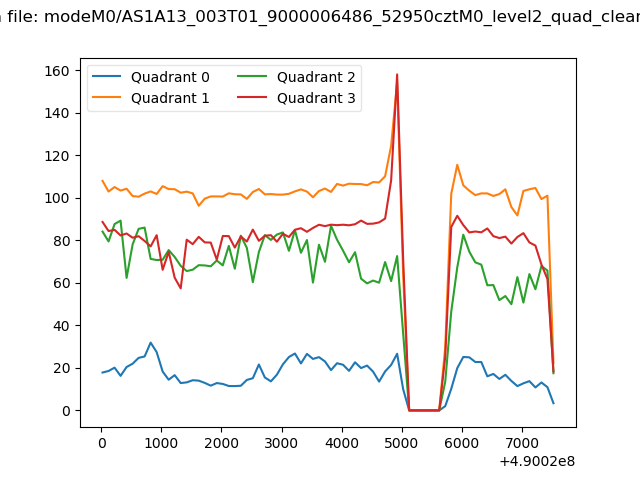 |
|
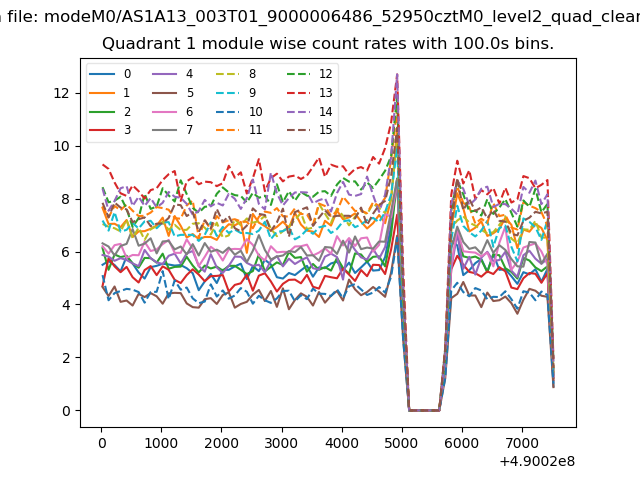
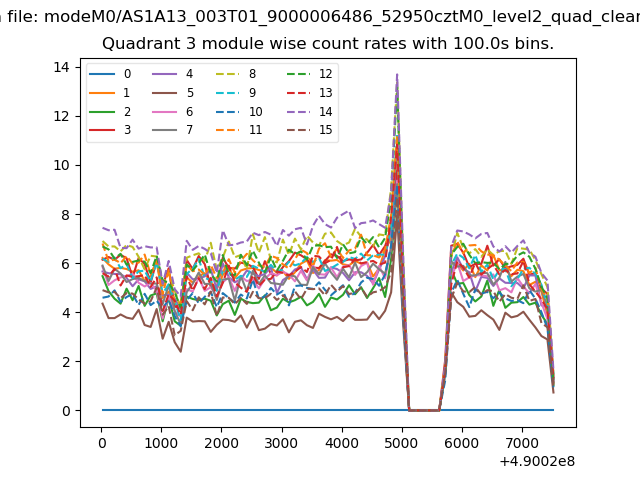
| Module-wise count rates for Quadrant A Data is divided into 100 sec bins |
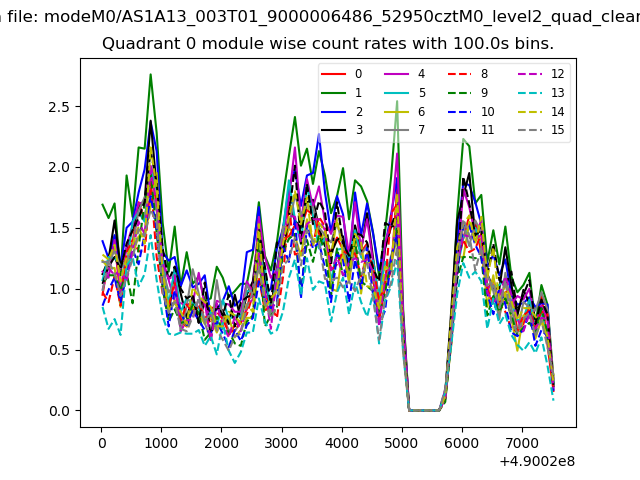 |
 |
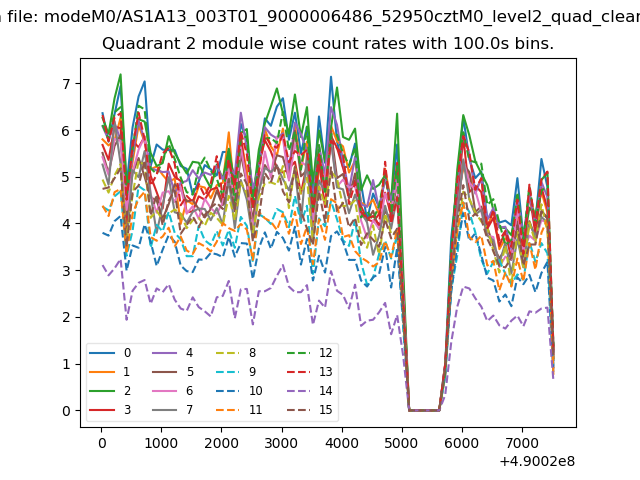
| Module-wise count rates for Quadrant B Data is divided into 100 sec bins |
 |
 |
| Module-wise count rates for Quadrant C Data is divided into 100 sec bins |
 |
 |
| Module-wise count rates for Quadrant D Data is divided into 100 sec bins |
 |
 |
| Parameter | Plot |
|---|---|
| CZT HV Monitor |  |
| D_VDD | 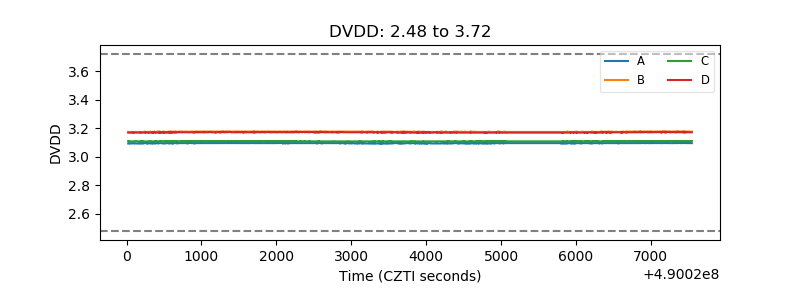 |
| Temperature 1 | 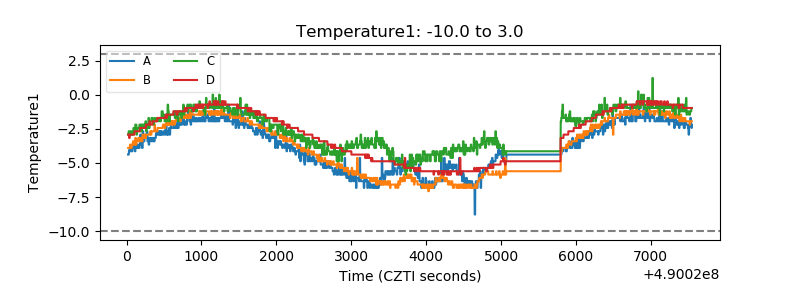 |
| Veto HV Monitor | 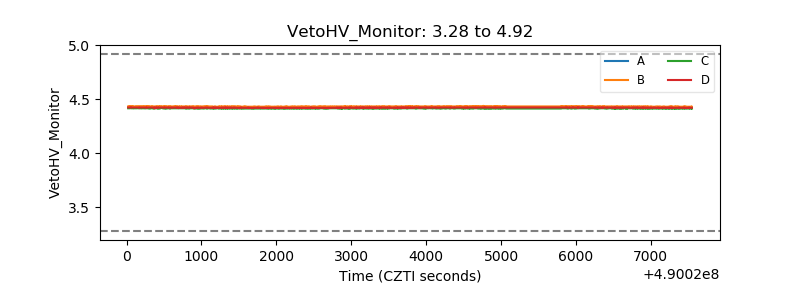 |
| Veto LLD | 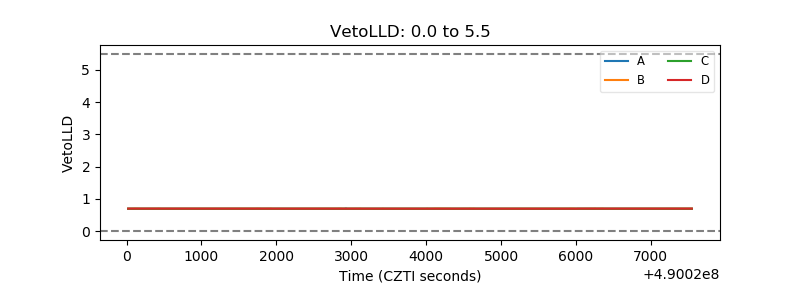 |
| Alpha Counter | 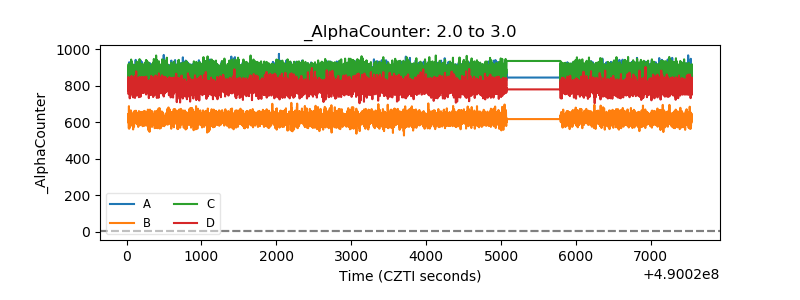 |
| _CPM_Rate | 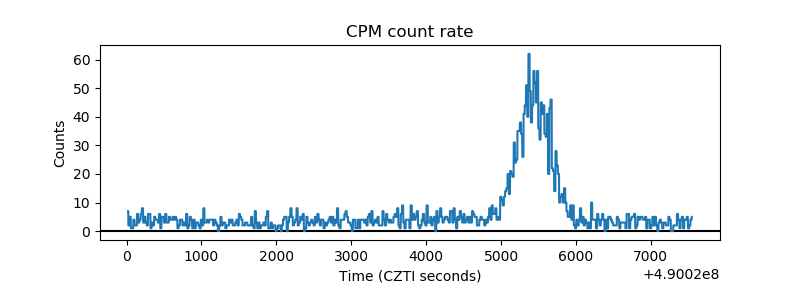 |
| CZT Counter | 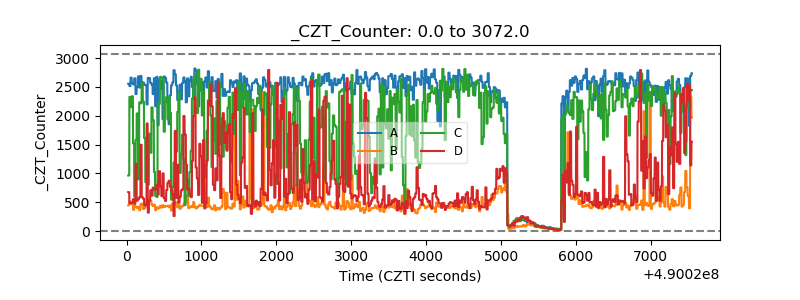 |
| +2.5 Volts monitor |  |
| +5 Volts monitor |  |
| _ROLL_ROT | 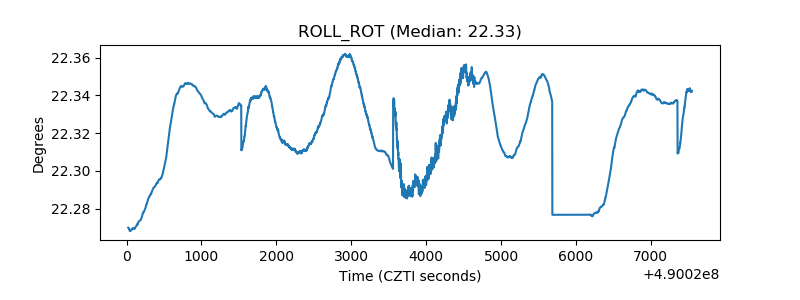 |
| _Roll_DEC | 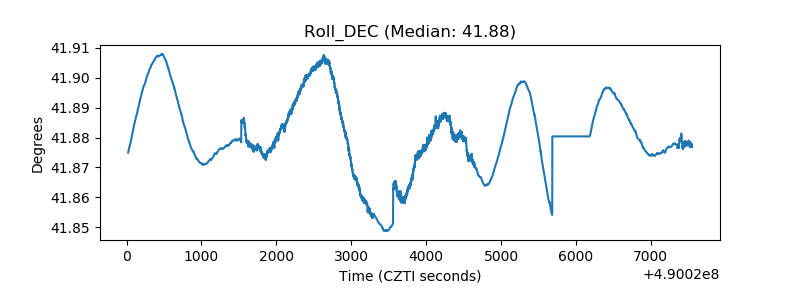 |
| _Roll_RA | 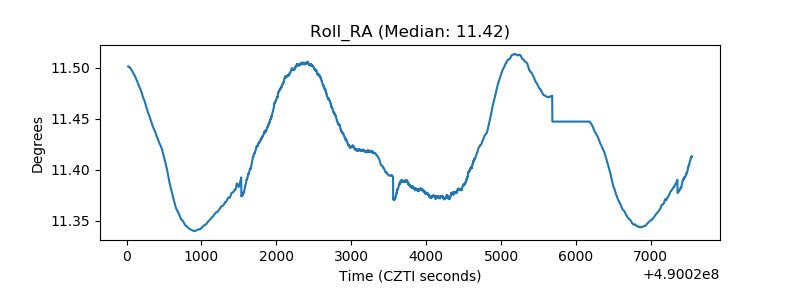 |
| Veto Counter | 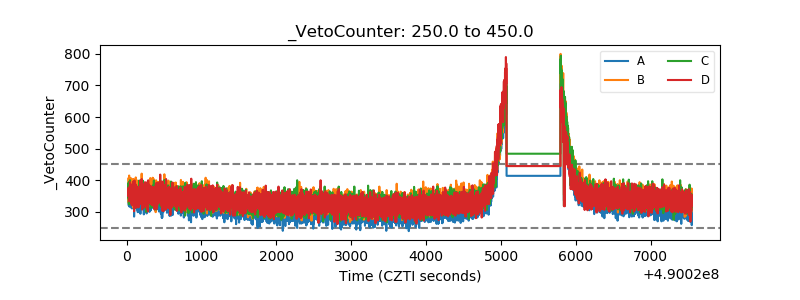 |