| Param | Original file | Final file |
|---|---|---|
| Filename | modeM0/AS1A13_003T01_9000006486_52951cztM0_level2.fits | modeM0/AS1A13_003T01_9000006486_52951cztM0_level2_quad_clean.evt |
| Size (bytes) | 1,299,499,200 | 63,092,160 |
| Size | 1.2 GB | 60.2 MB |
| Events in quadrant A | 18,158,341 | 151 |
| Events in quadrant B | 3,976,690 | 722,813 |
| Events in quadrant C | 15,620,991 | 210,388 |
| Events in quadrant D | 9,787,721 | 470,782 |
| Mode M9 | |||
|---|---|---|---|
| Quadrant | BADHDUFLAG | Total packets | Discarded packets |
| A | 0 | 2 | 0 |
| B | 0 | 2 | 0 |
| C | 0 | 2 | 0 |
| D | 0 | 2 | 0 |
| Mode M0 | |||
|---|---|---|---|
| Quadrant | BADHDUFLAG | Total packets | Discarded packets |
| A | 0 | 58665 | 2 |
| B | 0 | 16825 | 2 |
| C | 0 | 51375 | 2 |
| D | 0 | 34062 | 5 |
| Mode SS | |||
|---|---|---|---|
| Quadrant | BADHDUFLAG | Total packets | Discarded packets |
| A | 0 | 148 | 0 |
| B | 0 | 148 | 0 |
| C | 0 | 148 | 0 |
| D | 0 | 148 | 0 |
| Quadrant | Total seconds | Saturated seconds | Saturation percentage |
|---|---|---|---|
| A | 7258 | 7257 | 99.986222% |
| B | 7258 | 391 | 5.387159% |
| C | 7259 | 5443 | 74.982780% |
| D | 7258 | 2071 | 28.534031% |
Noise dominated data is calculated using 1-second bins in cleaned event files. If a bin has >2000 counts, and if more than 50% of those come from <1% of pixels, then it is considered to be noise-dominated and hence unusable.
| Quadrant | # 1 sec bins | Bins with >0 counts | Bins with >2000 counts | High rate bins dominated by noise | Noise dominated (total time) | Noise dominated (detector-on time) | Marked lightcurve |
|---|---|---|---|---|---|---|---|
| A | 7452 | 7257 | 7122 | 7122 | 95.57% | 98.14% | 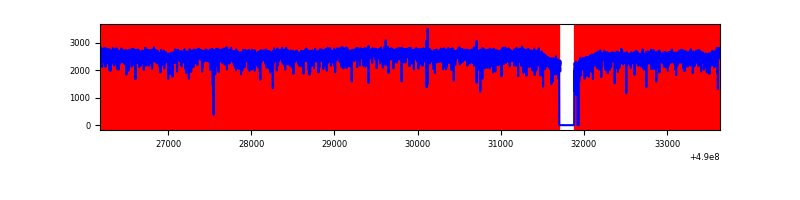 |
| B | 7453 | 7260 | 93 | 93 | 1.25% | 1.28% | 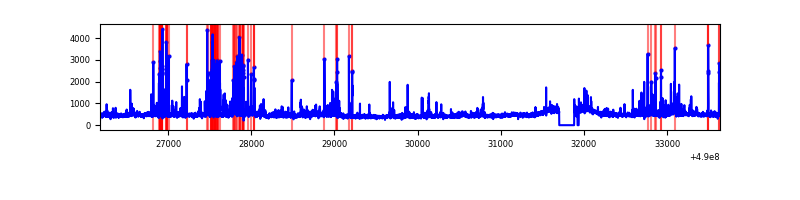 |
| C | 7453 | 7258 | 4629 | 4629 | 62.11% | 63.78% | 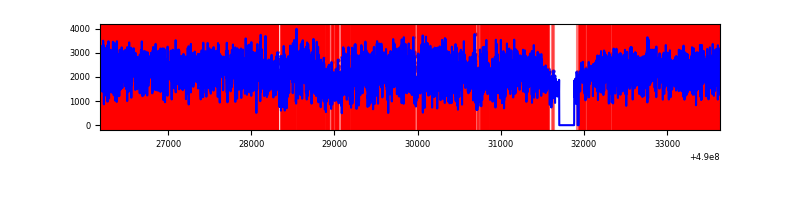 |
| D | 7453 | 7259 | 1775 | 1775 | 23.82% | 24.45% | 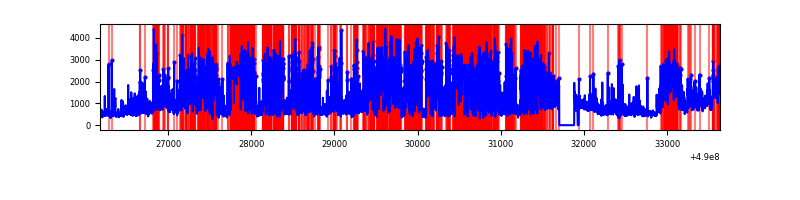 |
Top three noisy pixels from each quadrant. If the there are fewer than three noisy pixels in the level2.evt file, extra rows are filled as -1
| Pixel properties | Quadrant properties | ||||||
|---|---|---|---|---|---|---|---|
| Quadrant | DetID | PixID | Counts | Sigma | Mean | Median | Sigma |
| A | 9 | 191 | 16802181 | 369888.01 | 172 | 167 | 45.4 |
| A | 4 | 249 | 403754 | 8884.77 | 172 | 167 | 45.4 |
| A | 4 | 238 | 111897 | 2459.68 | 172 | 167 | 45.4 |
| B | 10 | 63 | 431426 | 2544.46 | 794 | 768 | 169.3 |
| B | 10 | 254 | 63782 | 372.31 | 794 | 768 | 169.3 |
| B | 0 | 171 | 50615 | 294.51 | 794 | 768 | 169.3 |
| C | 10 | 171 | 10859436 | 68085.07 | 590 | 587 | 159.5 |
| C | 12 | 254 | 1098443 | 6883.57 | 590 | 587 | 159.5 |
| C | 15 | 224 | 202057 | 1263.22 | 590 | 587 | 159.5 |
| D | 3 | 224 | 3284935 | 16556.74 | 696 | 665 | 198.4 |
| D | 15 | 78 | 923581 | 4652.63 | 696 | 665 | 198.4 |
| D | 8 | 176 | 837343 | 4217.88 | 696 | 665 | 198.4 |
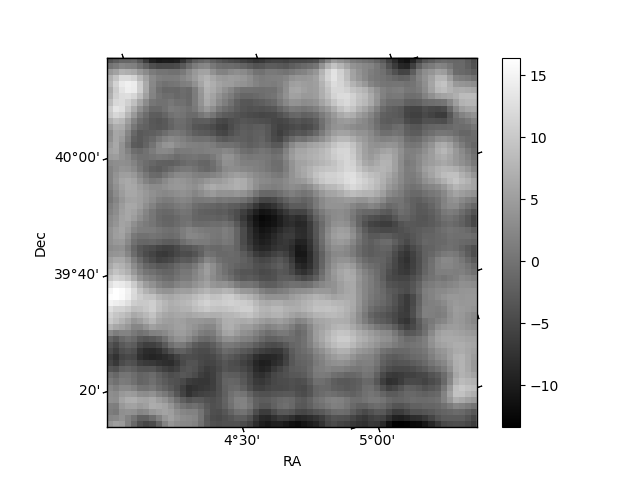
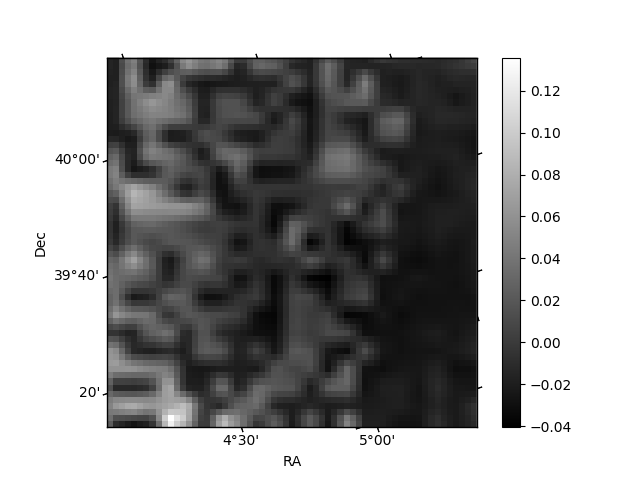
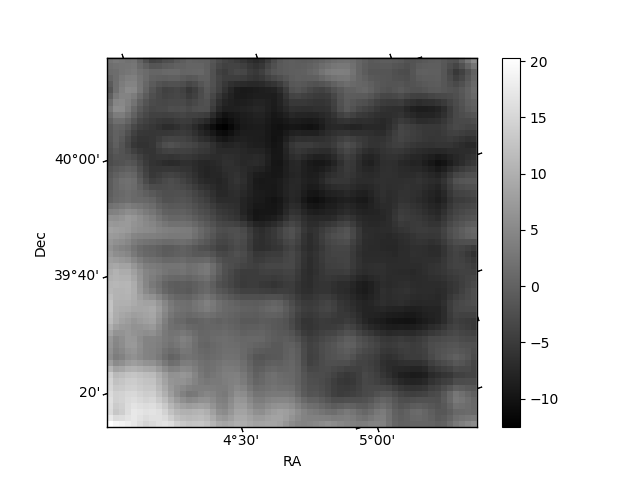
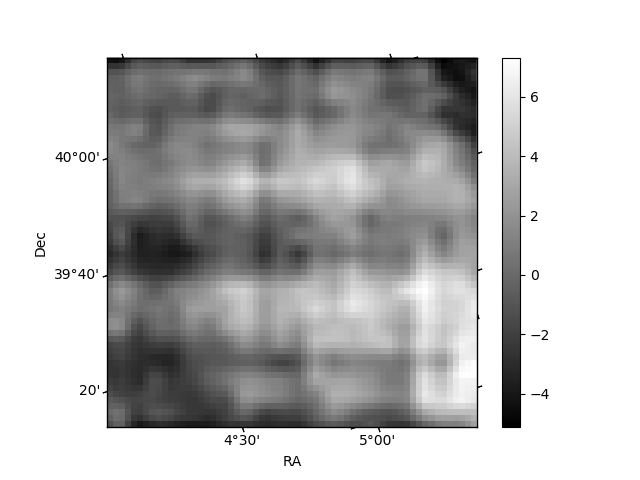
Histogram calculated using DETX and DETY for each event in the final _common_clean file
| Quadrant A | 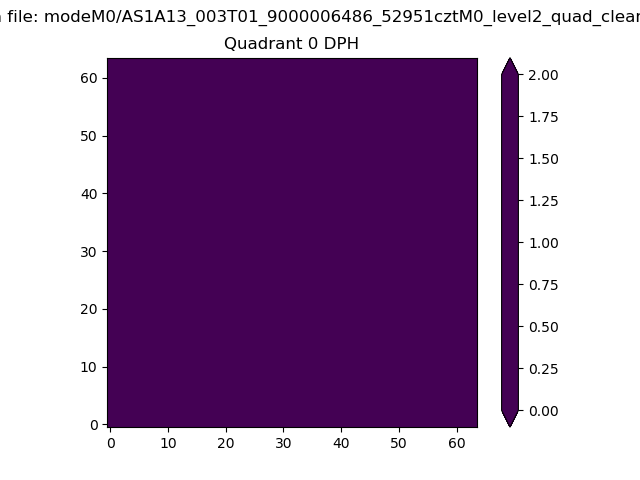 |
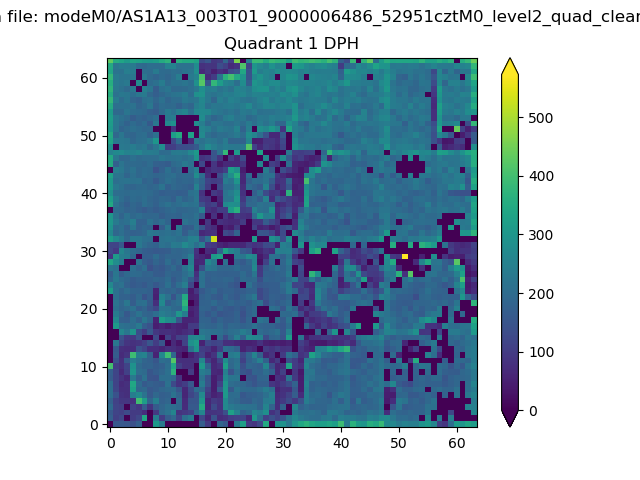 |
Quadrant B |
|---|---|---|---|
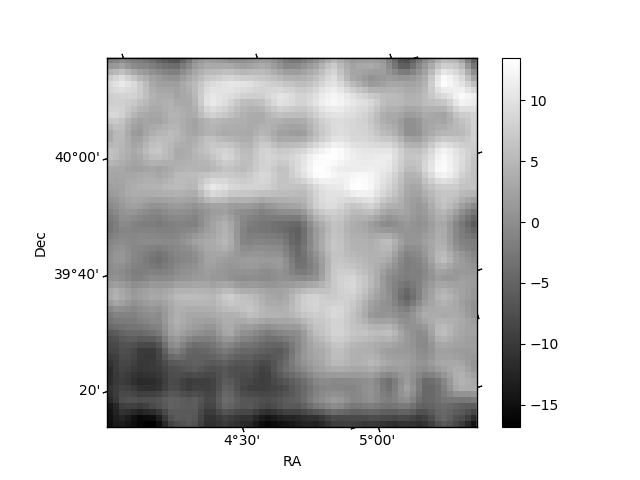
| Quadrant D | 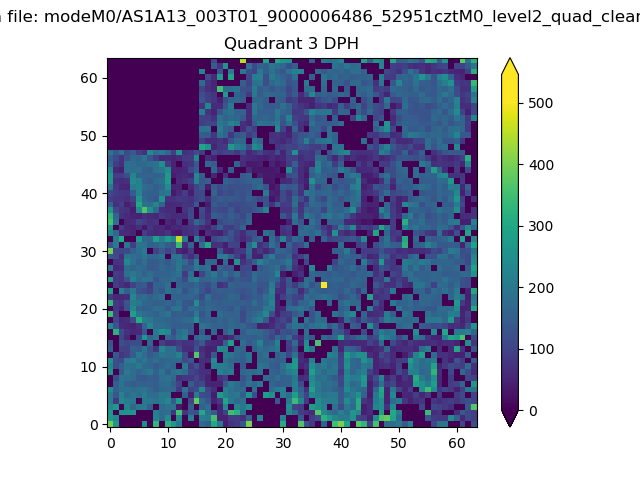 |
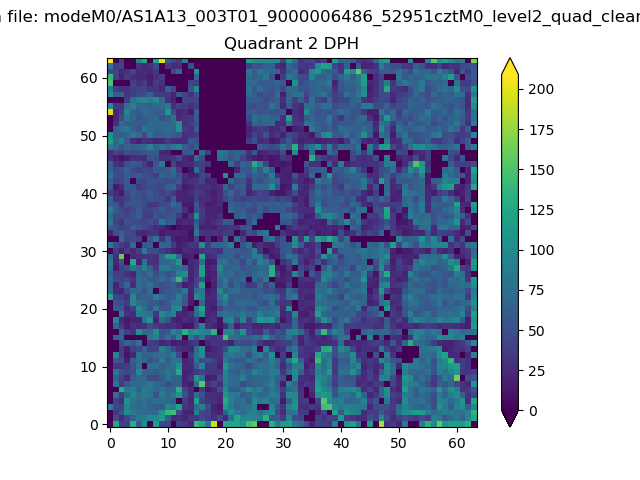 |
Quadrant C |
| Plot type | Count rate plots | Images |
|---|---|---|
| Comparison with Poisson distribution Blue bars denote a histogram of data divided into 1 sec bins. Red curve is a Poisson curve with rate = median count rate of data. |
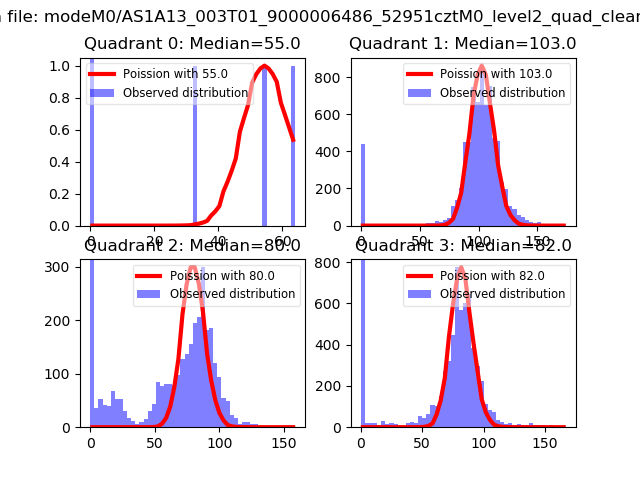 |
 |
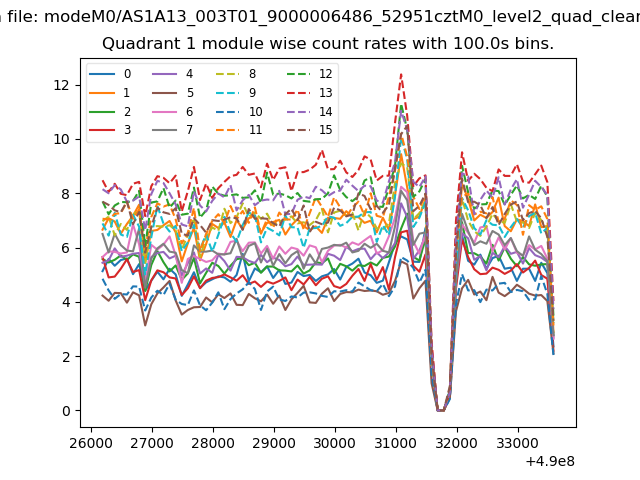
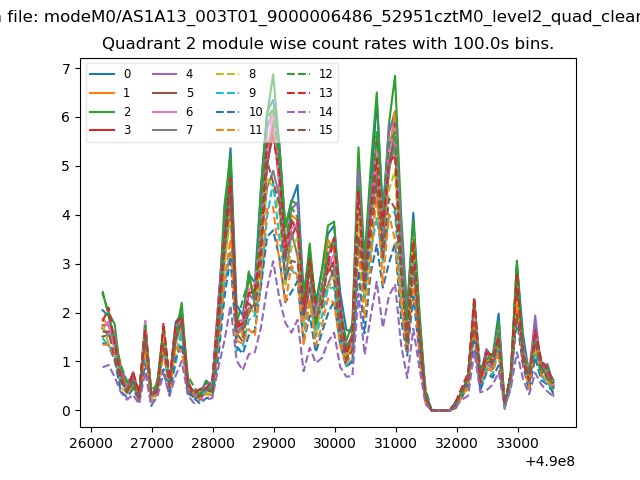
| Quadrant-wise count rates Data is divided into 100 sec bins |
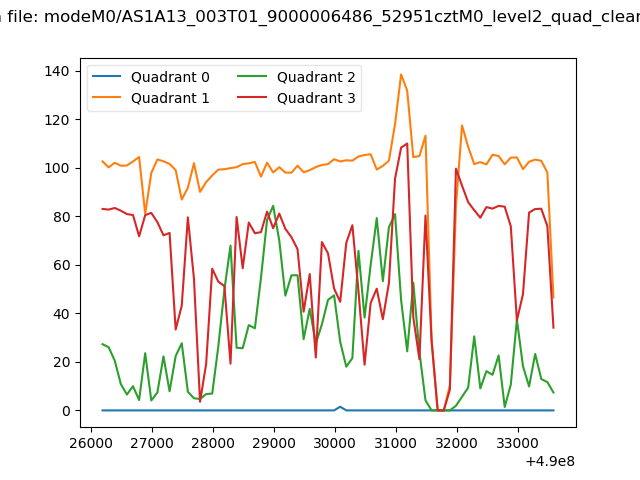 |
|
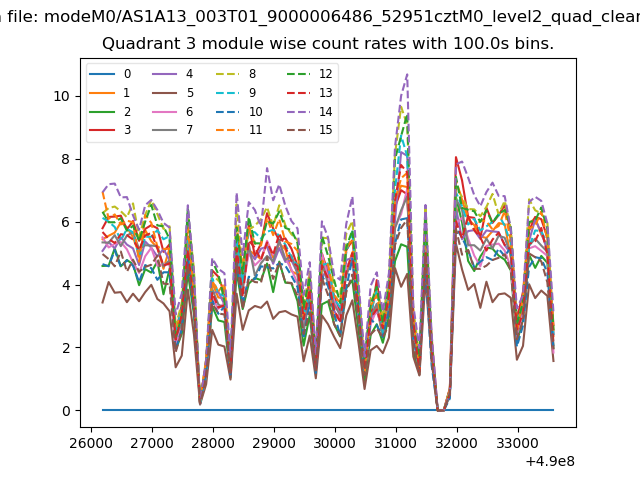
| Module-wise count rates for Quadrant A Data is divided into 100 sec bins |
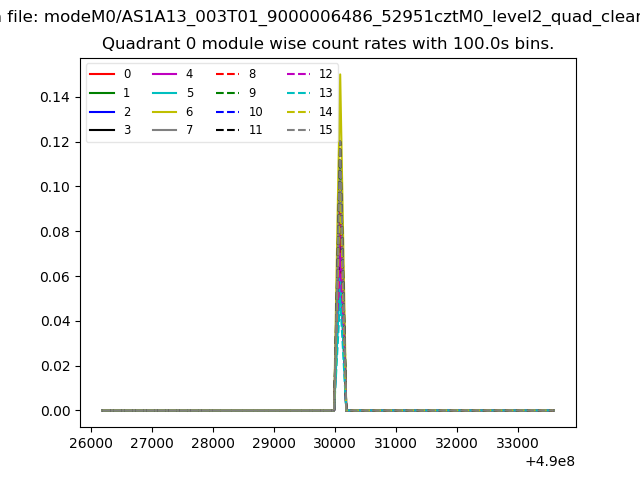 |
 |
| Module-wise count rates for Quadrant B Data is divided into 100 sec bins |
 |
 |
| Module-wise count rates for Quadrant C Data is divided into 100 sec bins |
 |
 |
| Module-wise count rates for Quadrant D Data is divided into 100 sec bins |
 |
 |
| Parameter | Plot |
|---|---|
| CZT HV Monitor | 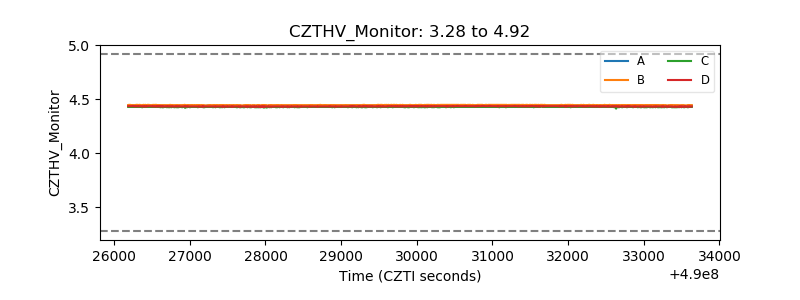 |
| D_VDD | 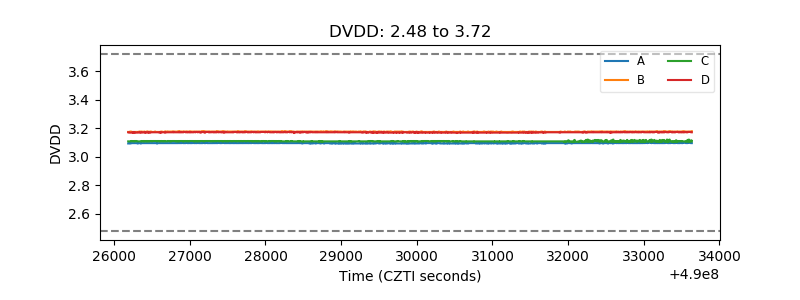 |
| Temperature 1 | 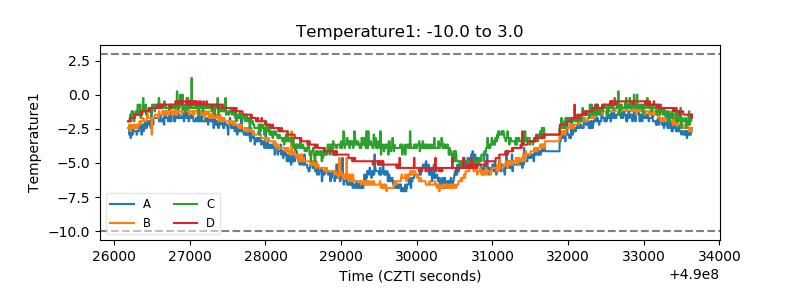 |
| Veto HV Monitor | 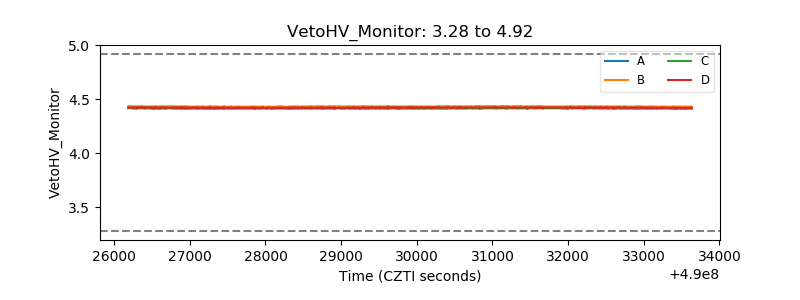 |
| Veto LLD | 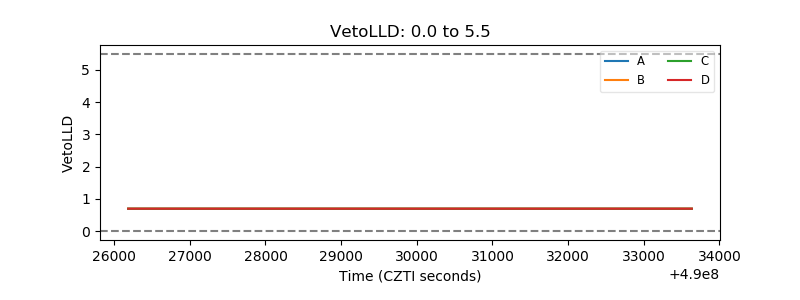 |
| Alpha Counter | 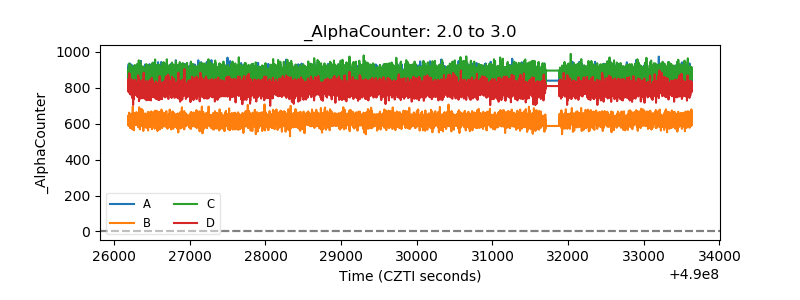 |
| _CPM_Rate | 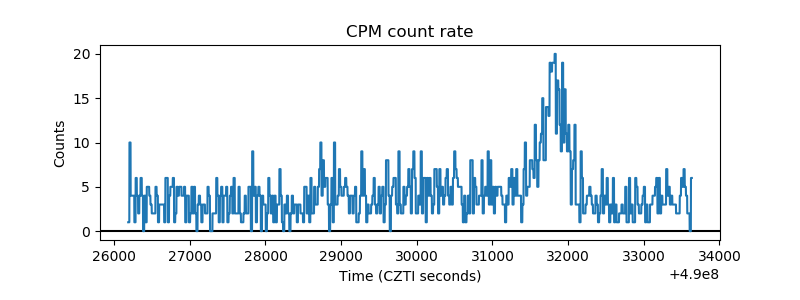 |
| CZT Counter | 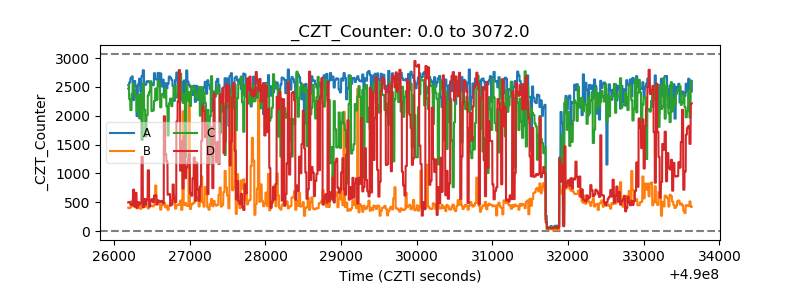 |
| +2.5 Volts monitor | 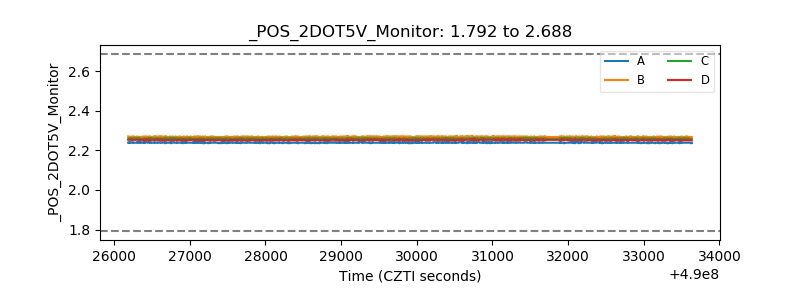 |
| +5 Volts monitor | 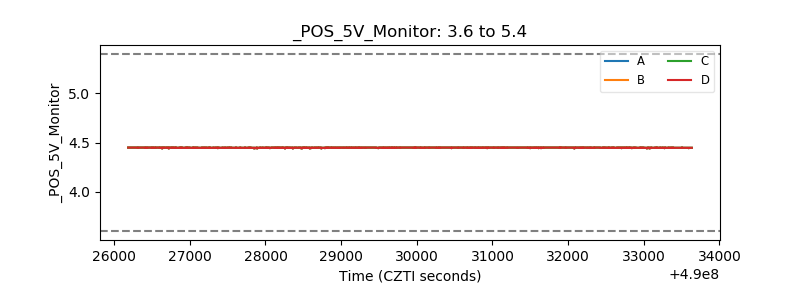 |
| _ROLL_ROT | 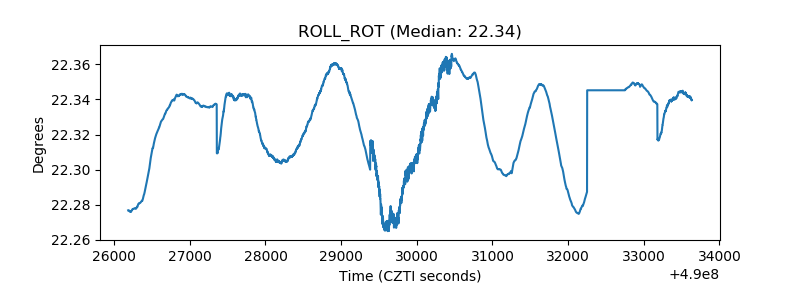 |
| _Roll_DEC | 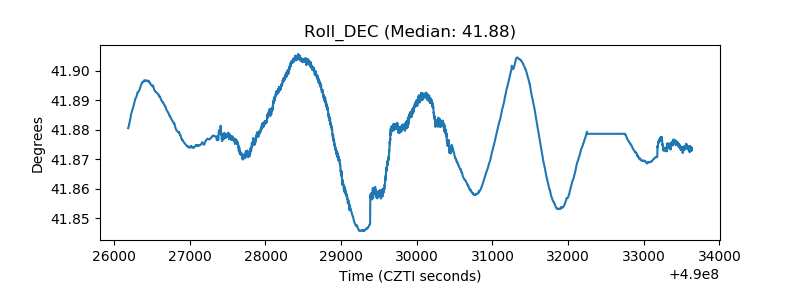 |
| _Roll_RA | 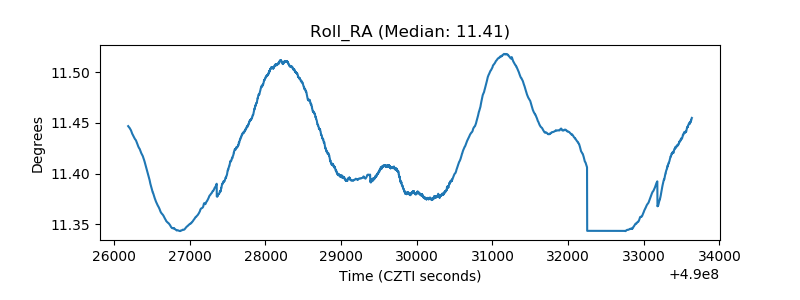 |
| Veto Counter | 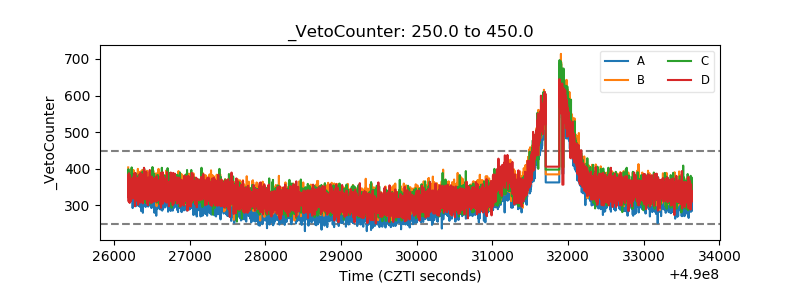 |