| Param | Original file | Final file |
|---|---|---|
| Filename | modeM0/AS1A13_003T01_9000006486_52952cztM0_level2.fits | modeM0/AS1A13_003T01_9000006486_52952cztM0_level2_quad_clean.evt |
| Size (bytes) | 1,177,430,400 | 80,547,840 |
| Size | 1.1 GB | 76.8 MB |
| Events in quadrant A | 17,489,273 | 118,115 |
| Events in quadrant B | 3,559,829 | 737,179 |
| Events in quadrant C | 14,034,551 | 496,133 |
| Events in quadrant D | 7,950,347 | 584,869 |
| Mode M0 | |||
|---|---|---|---|
| Quadrant | BADHDUFLAG | Total packets | Discarded packets |
| A | 0 | 56611 | 0 |
| B | 0 | 15726 | 0 |
| C | 0 | 46617 | 0 |
| D | 0 | 28515 | 0 |
| Mode SS | |||
|---|---|---|---|
| Quadrant | BADHDUFLAG | Total packets | Discarded packets |
| A | 0 | 142 | 0 |
| B | 0 | 142 | 0 |
| C | 0 | 142 | 0 |
| D | 0 | 142 | 0 |
| Quadrant | Total seconds | Saturated seconds | Saturation percentage |
|---|---|---|---|
| A | 7133 | 7133 | 100.000000% |
| B | 7133 | 113 | 1.584186% |
| C | 7134 | 4414 | 61.872722% |
| D | 7134 | 978 | 13.708999% |
Noise dominated data is calculated using 1-second bins in cleaned event files. If a bin has >2000 counts, and if more than 50% of those come from <1% of pixels, then it is considered to be noise-dominated and hence unusable.
| Quadrant | # 1 sec bins | Bins with >0 counts | Bins with >2000 counts | High rate bins dominated by noise | Noise dominated (total time) | Noise dominated (detector-on time) | Marked lightcurve |
|---|---|---|---|---|---|---|---|
| A | 7132 | 7132 | 6876 | 6876 | 96.41% | 96.41% |  |
| B | 7133 | 7133 | 46 | 46 | 0.64% | 0.64% | 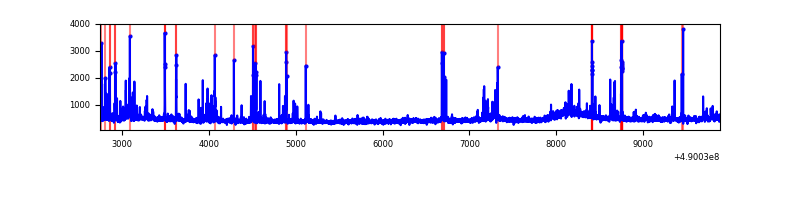 |
| C | 7133 | 7133 | 3815 | 3815 | 53.48% | 53.48% | 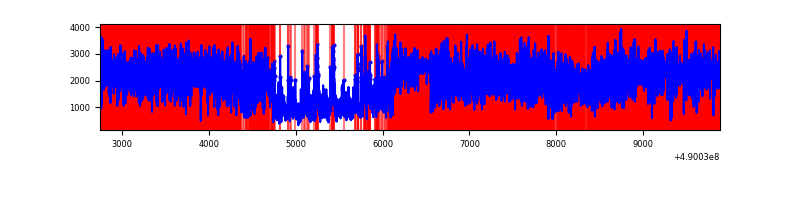 |
| D | 7134 | 7134 | 861 | 861 | 12.07% | 12.07% | 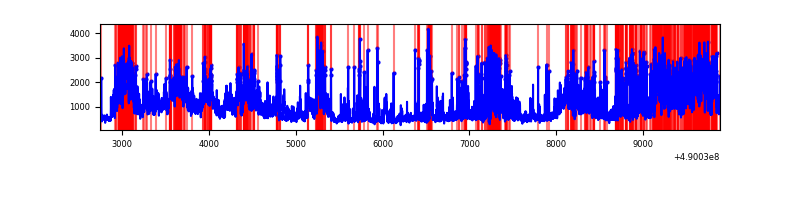 |
Top three noisy pixels from each quadrant. If the there are fewer than three noisy pixels in the level2.evt file, extra rows are filled as -1
| Pixel properties | Quadrant properties | ||||||
|---|---|---|---|---|---|---|---|
| Quadrant | DetID | PixID | Counts | Sigma | Mean | Median | Sigma |
| A | 9 | 191 | 15634164 | 390703.21 | 148 | 143 | 40.0 |
| A | 8 | 245 | 749650 | 18730.61 | 148 | 143 | 40.0 |
| A | 4 | 249 | 284169 | 7097.97 | 148 | 143 | 40.0 |
| B | 10 | 63 | 113415 | 686.36 | 768 | 743 | 164.2 |
| B | 0 | 171 | 58224 | 350.15 | 768 | 743 | 164.2 |
| B | 5 | 185 | 57874 | 348.02 | 768 | 743 | 164.2 |
| C | 10 | 171 | 8331579 | 52161.8 | 584 | 579 | 159.7 |
| C | 7 | 80 | 1107578 | 6931.11 | 584 | 579 | 159.7 |
| C | 12 | 254 | 1037644 | 6493.24 | 584 | 579 | 159.7 |
| D | 15 | 78 | 2132839 | 10436.03 | 717 | 685 | 204.3 |
| D | 3 | 12 | 653182 | 3193.71 | 717 | 685 | 204.3 |
| D | 8 | 48 | 508319 | 2484.66 | 717 | 685 | 204.3 |
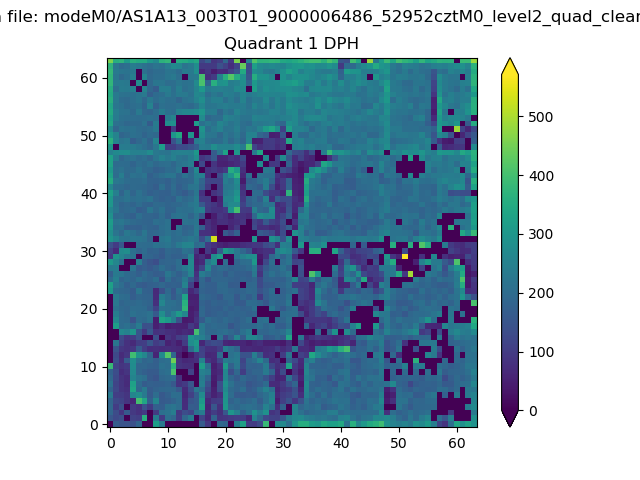
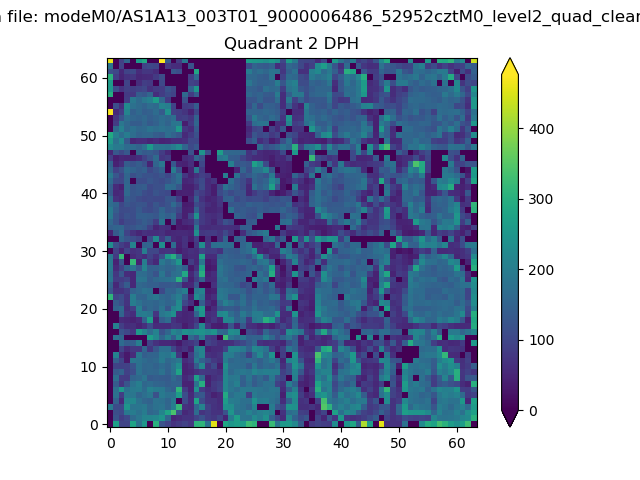
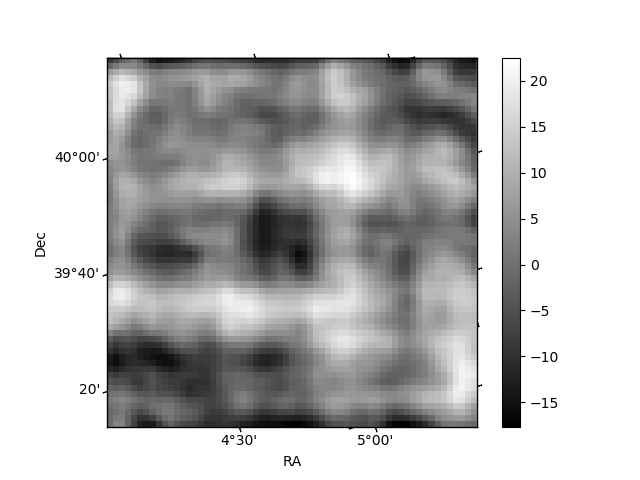
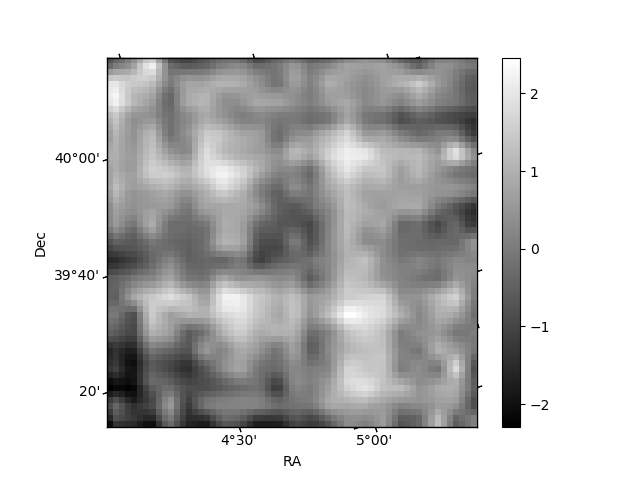
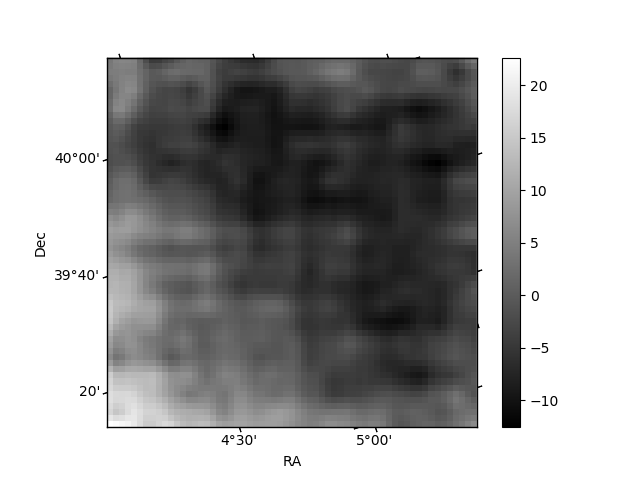
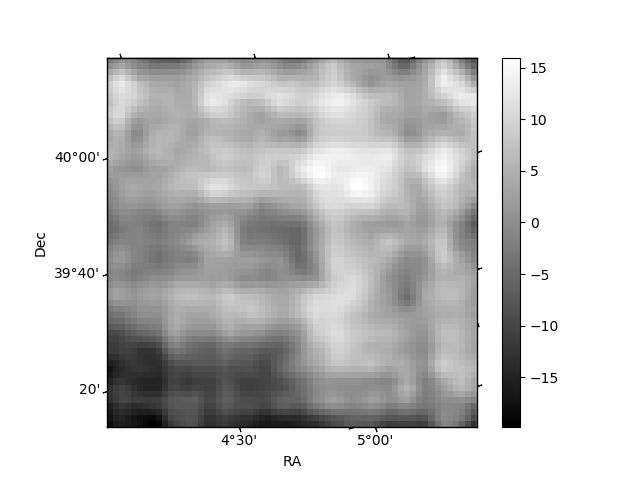
Histogram calculated using DETX and DETY for each event in the final _common_clean file
| Quadrant A | 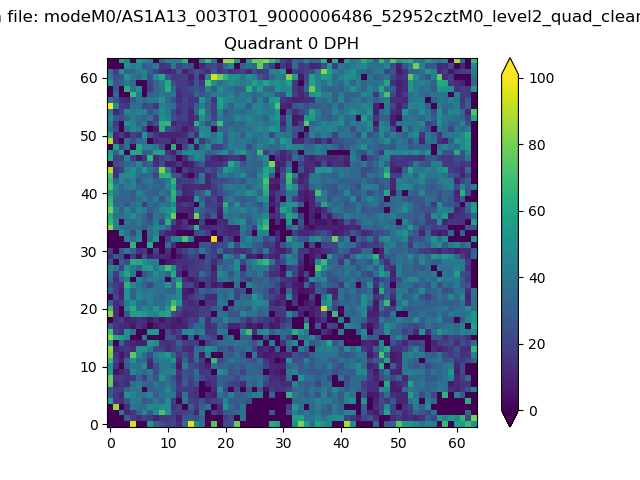 |
 |
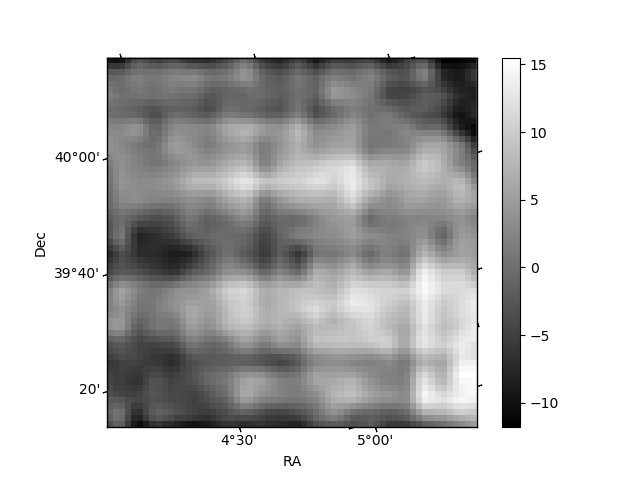
Quadrant B |
|---|---|---|---|
| Quadrant D | 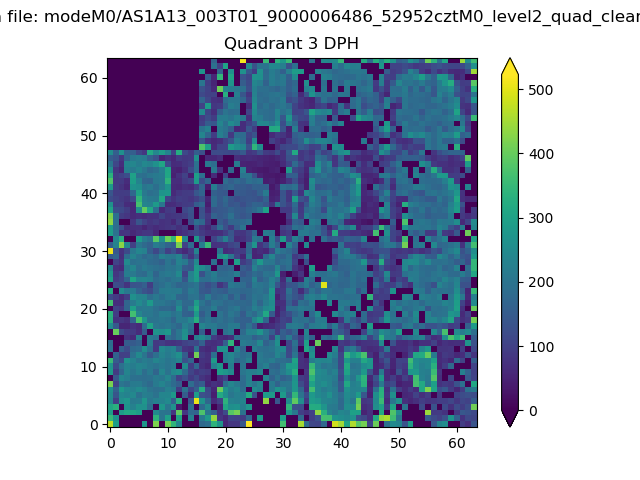 |
 |
Quadrant C |
| Plot type | Count rate plots | Images |
|---|---|---|
| Comparison with Poisson distribution Blue bars denote a histogram of data divided into 1 sec bins. Red curve is a Poisson curve with rate = median count rate of data. |
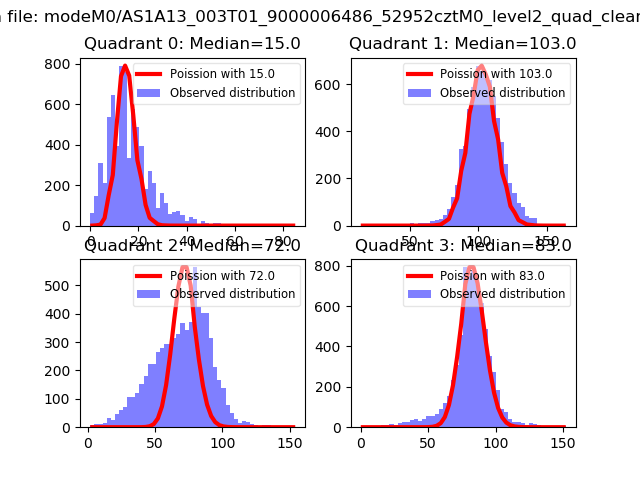 |
 |
| Quadrant-wise count rates Data is divided into 100 sec bins |
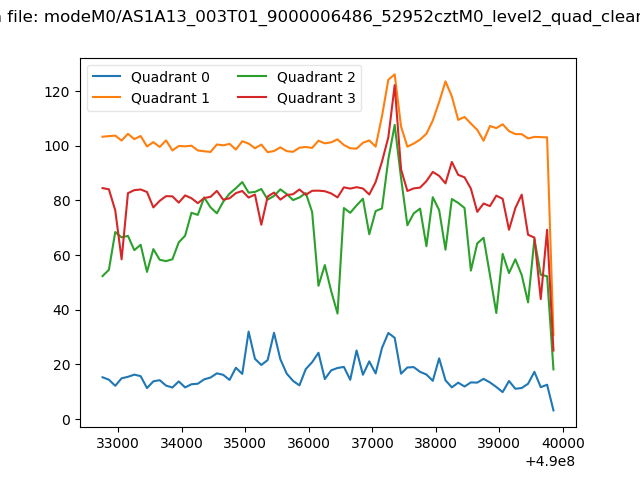 |
|
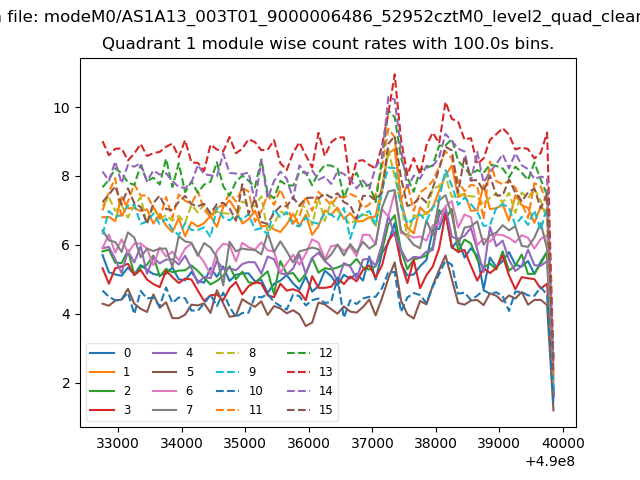
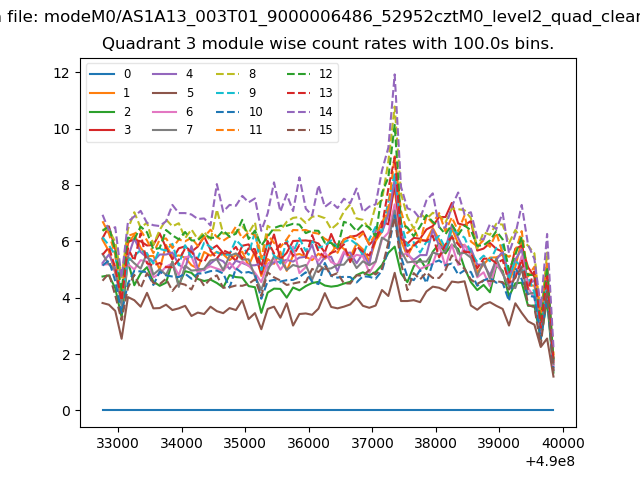
| Module-wise count rates for Quadrant A Data is divided into 100 sec bins |
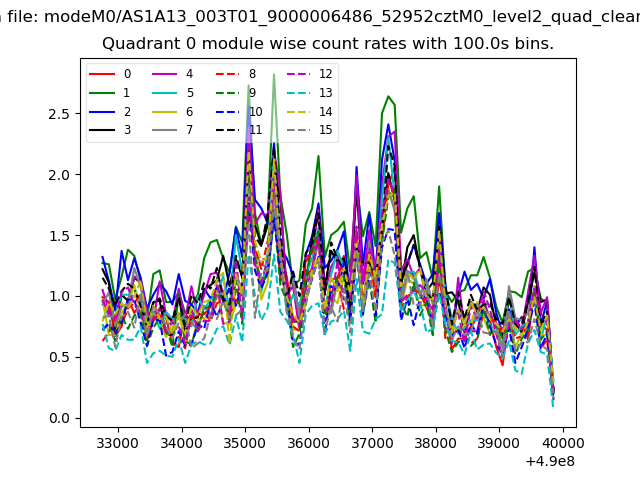 |
 |
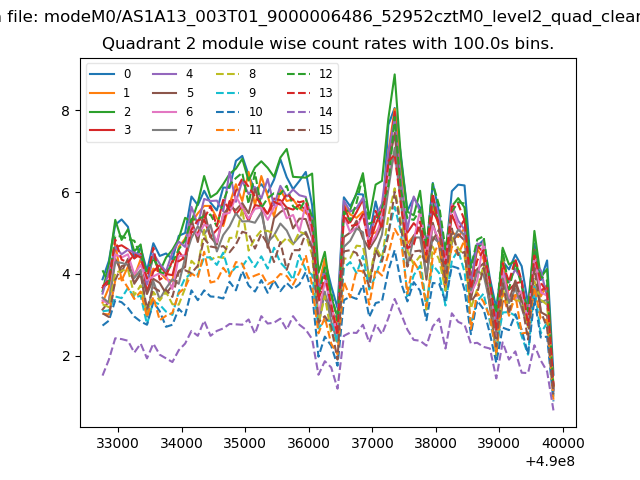
| Module-wise count rates for Quadrant B Data is divided into 100 sec bins |
 |
 |
| Module-wise count rates for Quadrant C Data is divided into 100 sec bins |
 |
 |
| Module-wise count rates for Quadrant D Data is divided into 100 sec bins |
 |
 |
| Parameter | Plot |
|---|---|
| CZT HV Monitor | 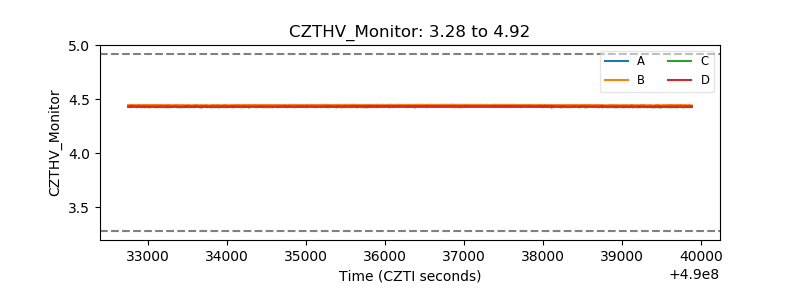 |
| D_VDD | 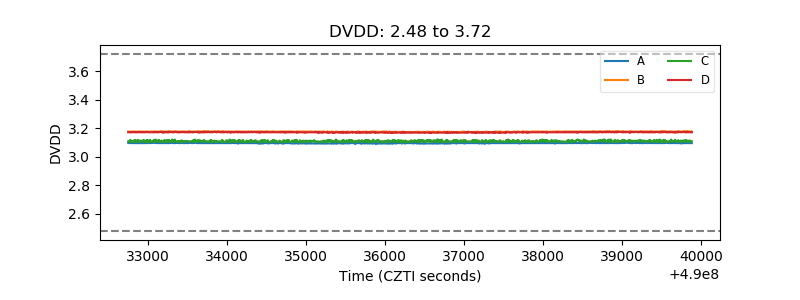 |
| Temperature 1 | 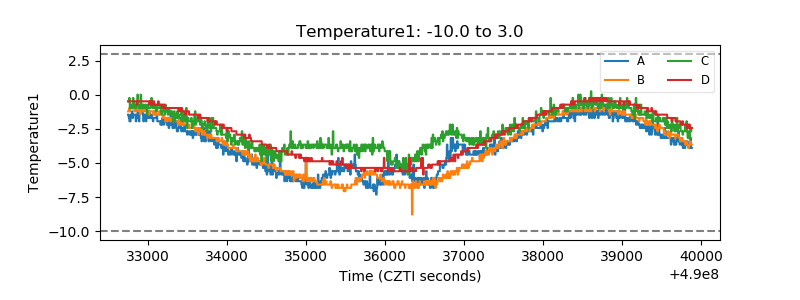 |
| Veto HV Monitor | 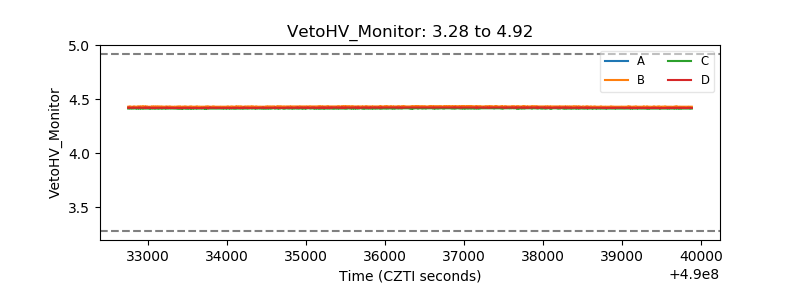 |
| Veto LLD | 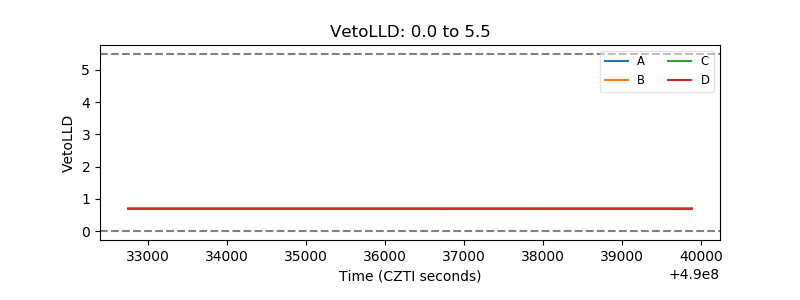 |
| Alpha Counter | 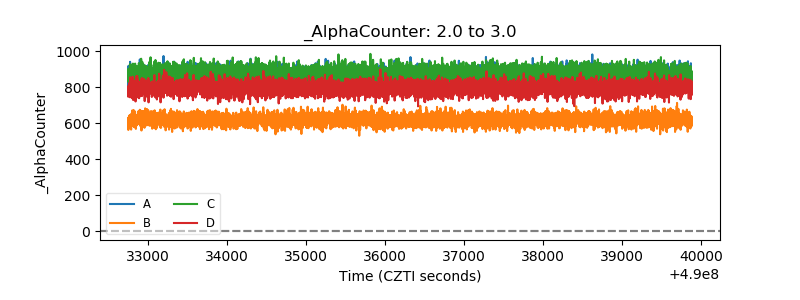 |
| _CPM_Rate | 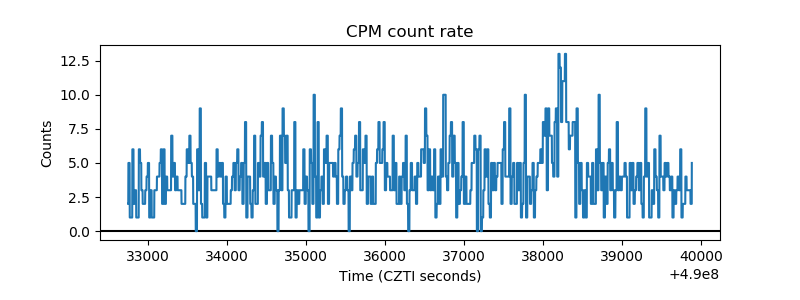 |
| CZT Counter | 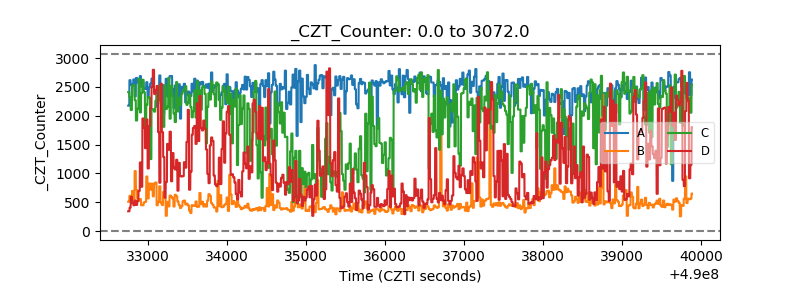 |
| +2.5 Volts monitor |  |
| +5 Volts monitor |  |
| _ROLL_ROT | 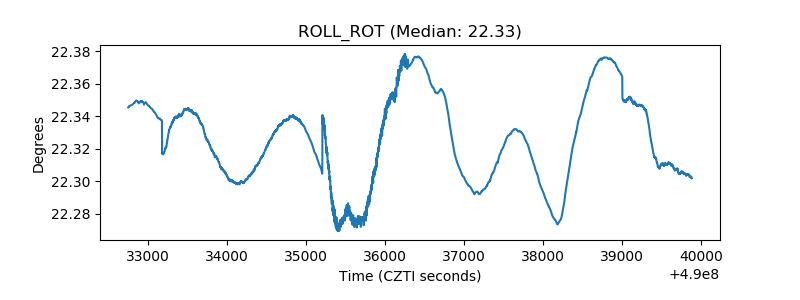 |
| _Roll_DEC | 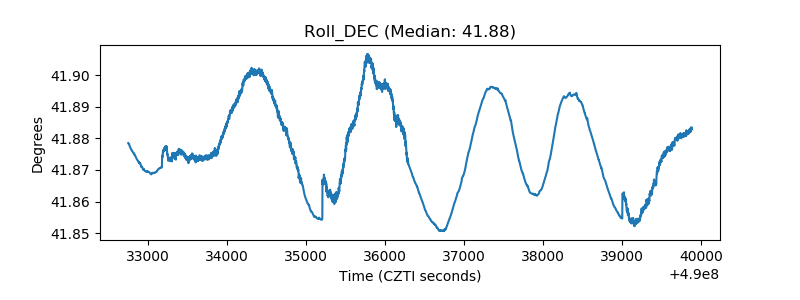 |
| _Roll_RA | 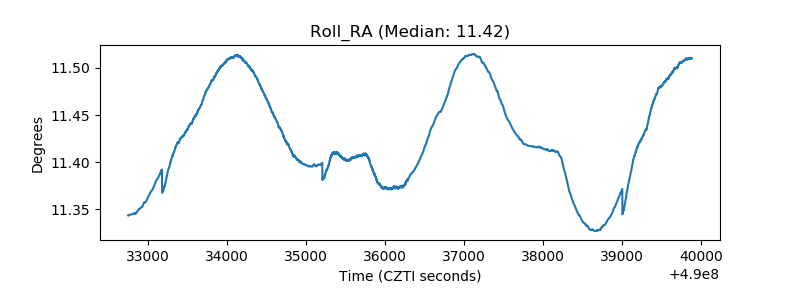 |
| Veto Counter | 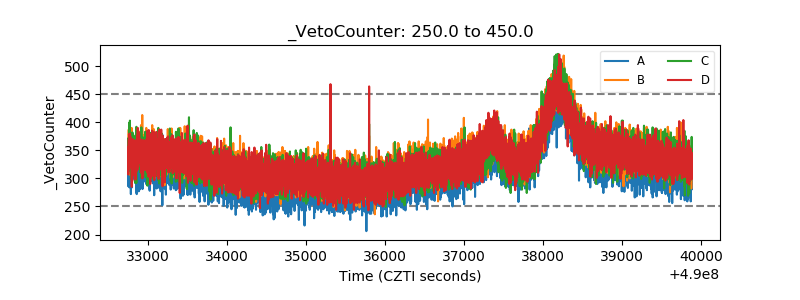 |