| Param | Original file | Final file |
|---|---|---|
| Filename | modeM0/AS1A13_003T01_9000006486_52957cztM0_level2.fits | modeM0/AS1A13_003T01_9000006486_52957cztM0_level2_quad_clean.evt |
| Size (bytes) | 1,086,174,720 | 66,084,480 |
| Size | 1.0 GB | 63.0 MB |
| Events in quadrant A | 17,140,860 | 25,912 |
| Events in quadrant B | 3,305,816 | 695,510 |
| Events in quadrant C | 7,054,742 | 530,726 |
| Events in quadrant D | 12,171,427 | 268,135 |
| Mode M9 | |||
|---|---|---|---|
| Quadrant | BADHDUFLAG | Total packets | Discarded packets |
| A | 0 | 9 | 0 |
| B | 0 | 9 | 0 |
| C | 0 | 9 | 0 |
| D | 0 | 9 | 0 |
| Mode M0 | |||
|---|---|---|---|
| Quadrant | BADHDUFLAG | Total packets | Discarded packets |
| A | 0 | 55429 | 1 |
| B | 0 | 15010 | 1 |
| C | 0 | 25825 | 2 |
| D | 0 | 40899 | 1 |
| Mode SS | |||
|---|---|---|---|
| Quadrant | BADHDUFLAG | Total packets | Discarded packets |
| A | 0 | 138 | 0 |
| B | 0 | 138 | 0 |
| C | 0 | 138 | 0 |
| D | 0 | 138 | 0 |
| Quadrant | Total seconds | Saturated seconds | Saturation percentage |
|---|---|---|---|
| A | 6900 | 6692 | 96.985507% |
| B | 6901 | 96 | 1.391103% |
| C | 6900 | 1056 | 15.304348% |
| D | 6900 | 4016 | 58.202899% |
Noise dominated data is calculated using 1-second bins in cleaned event files. If a bin has >2000 counts, and if more than 50% of those come from <1% of pixels, then it is considered to be noise-dominated and hence unusable.
| Quadrant | # 1 sec bins | Bins with >0 counts | Bins with >2000 counts | High rate bins dominated by noise | Noise dominated (total time) | Noise dominated (detector-on time) | Marked lightcurve |
|---|---|---|---|---|---|---|---|
| A | 7754 | 6899 | 6613 | 6613 | 85.29% | 95.85% | 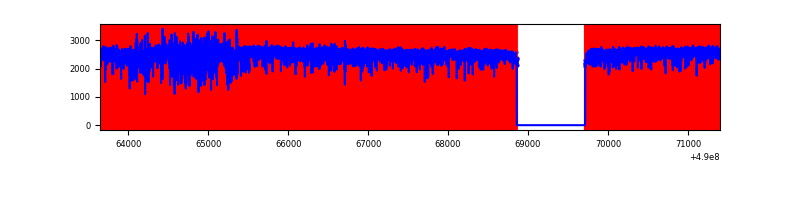 |
| B | 7756 | 6902 | 35 | 35 | 0.45% | 0.51% | 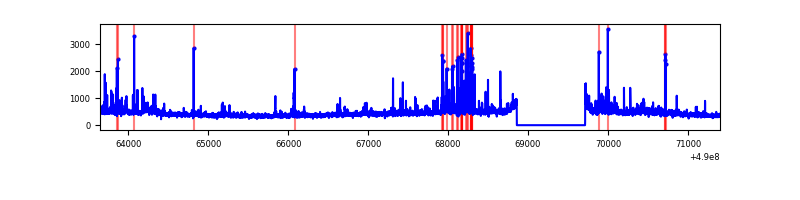 |
| C | 7755 | 6900 | 994 | 994 | 12.82% | 14.41% | 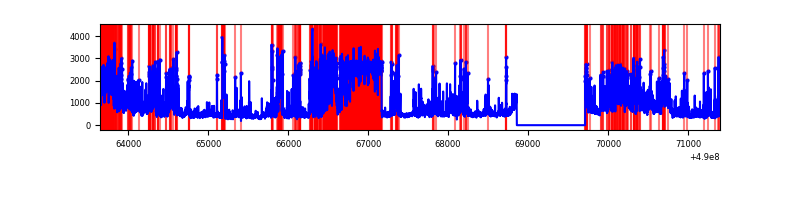 |
| D | 7755 | 6901 | 3468 | 3468 | 44.72% | 50.25% | 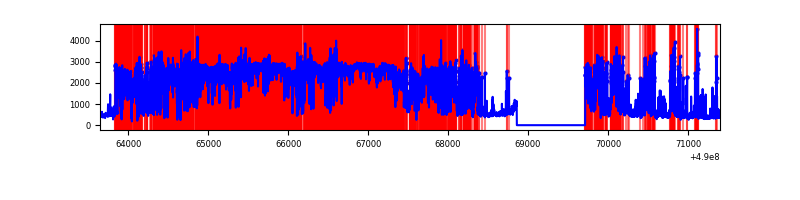 |
Top three noisy pixels from each quadrant. If the there are fewer than three noisy pixels in the level2.evt file, extra rows are filled as -1
| Pixel properties | Quadrant properties | ||||||
|---|---|---|---|---|---|---|---|
| Quadrant | DetID | PixID | Counts | Sigma | Mean | Median | Sigma |
| A | 9 | 191 | 14445940 | 192770.41 | 293 | 287 | 74.9 |
| A | 4 | 249 | 1325215 | 17680.54 | 293 | 287 | 74.9 |
| A | 3 | 62 | 76762 | 1020.52 | 293 | 287 | 74.9 |
| B | 10 | 63 | 129463 | 839.6 | 710 | 684 | 153.4 |
| B | 4 | 81 | 56032 | 360.85 | 710 | 684 | 153.4 |
| B | 10 | 128 | 55397 | 356.71 | 710 | 684 | 153.4 |
| C | 2 | 12 | 1404174 | 7778.83 | 653 | 649 | 180.4 |
| C | 10 | 171 | 631808 | 3498.11 | 653 | 649 | 180.4 |
| C | 2 | 239 | 476189 | 2635.61 | 653 | 649 | 180.4 |
| D | 8 | 176 | 9885436 | 83244.66 | 413 | 395 | 118.7 |
| D | 15 | 78 | 199848 | 1679.65 | 413 | 395 | 118.7 |
| D | 11 | 247 | 92062 | 771.95 | 413 | 395 | 118.7 |
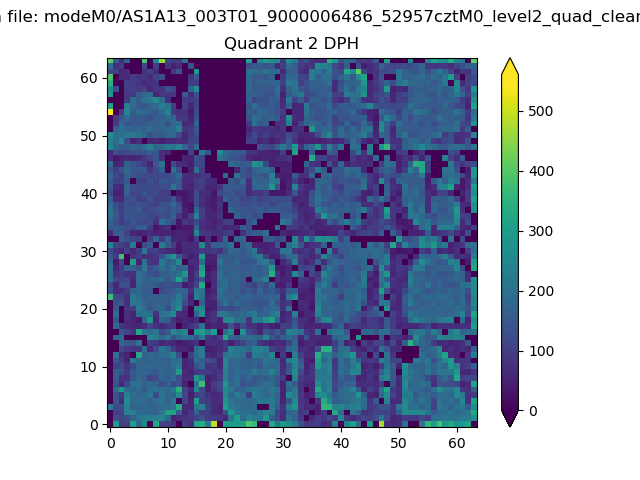
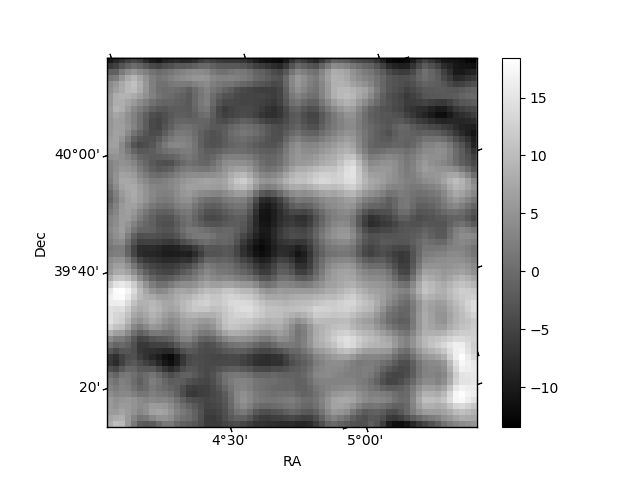
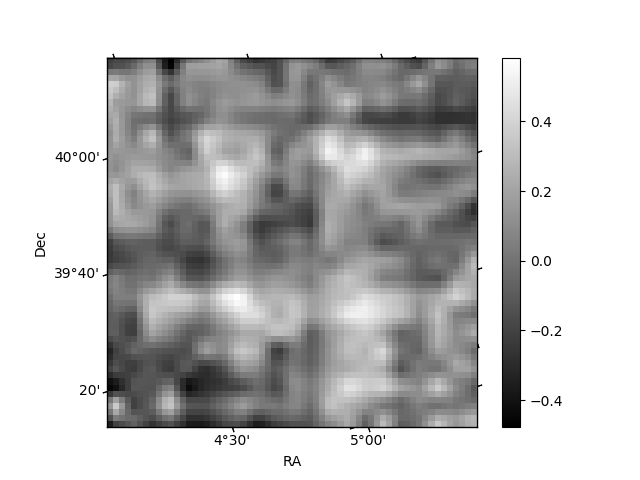
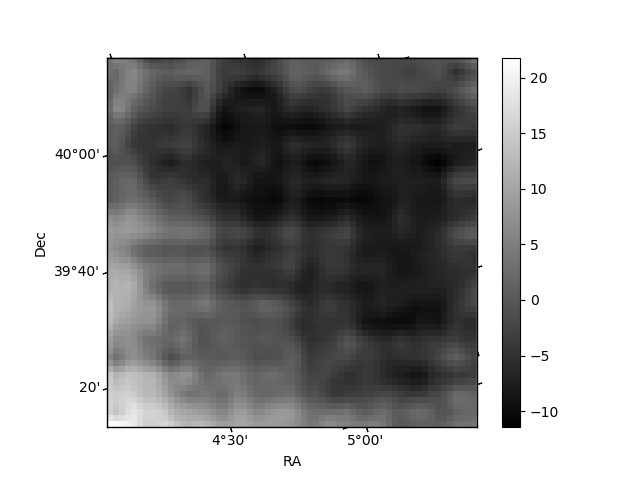
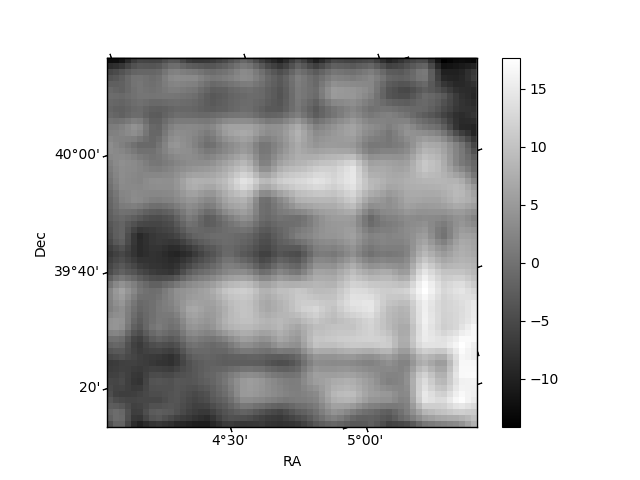
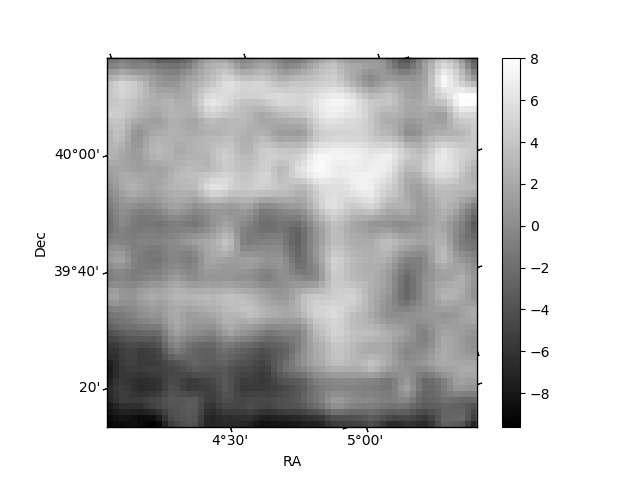
Histogram calculated using DETX and DETY for each event in the final _common_clean file
| Quadrant A | 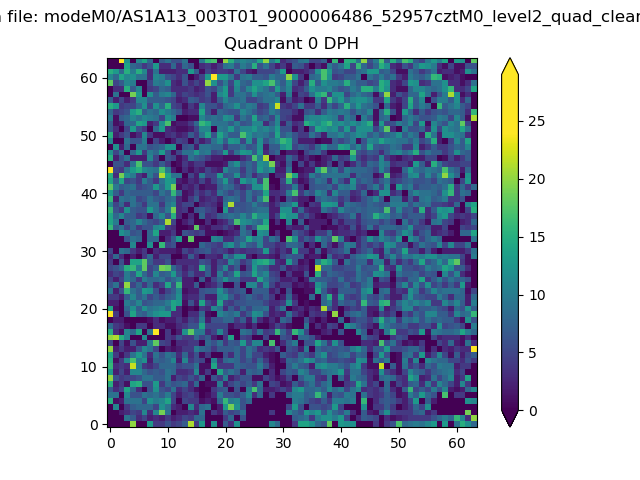 |
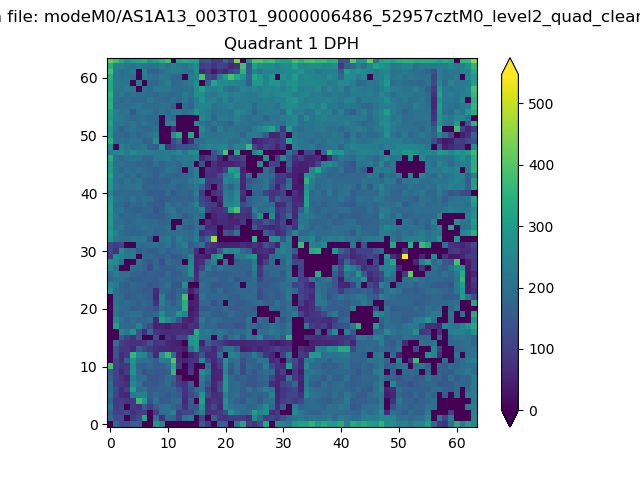 |
Quadrant B |
|---|---|---|---|
| Quadrant D | 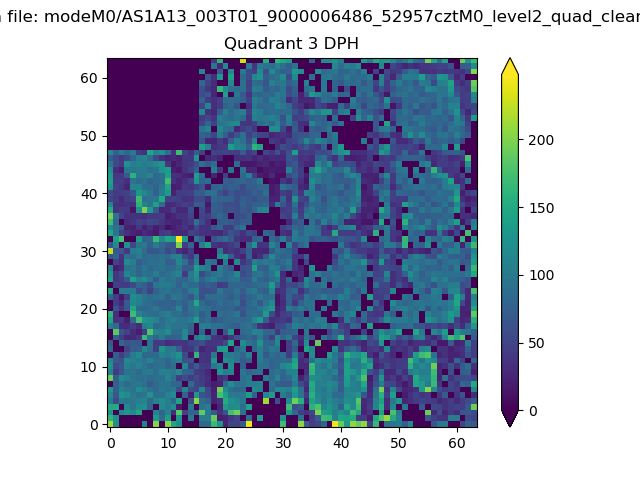 |
 |
Quadrant C |
| Plot type | Count rate plots | Images |
|---|---|---|
| Comparison with Poisson distribution Blue bars denote a histogram of data divided into 1 sec bins. Red curve is a Poisson curve with rate = median count rate of data. |
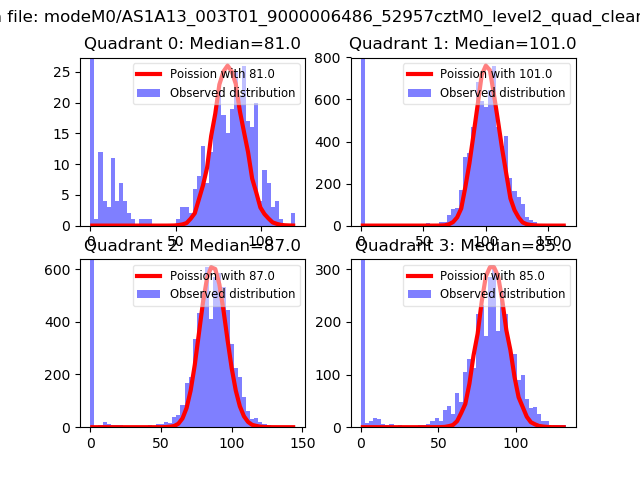 |
 |
| Quadrant-wise count rates Data is divided into 100 sec bins |
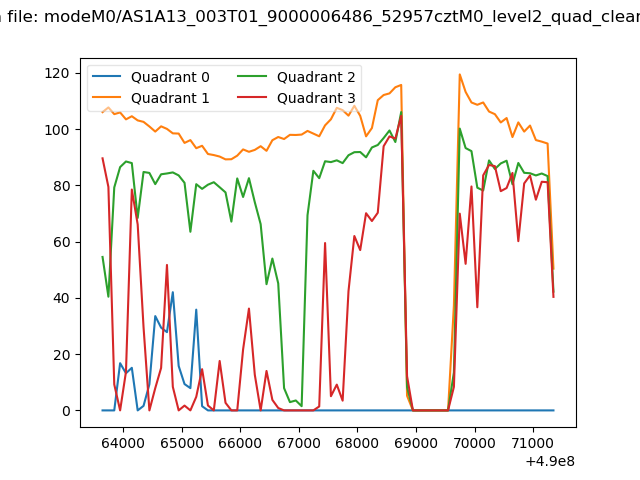 |
|
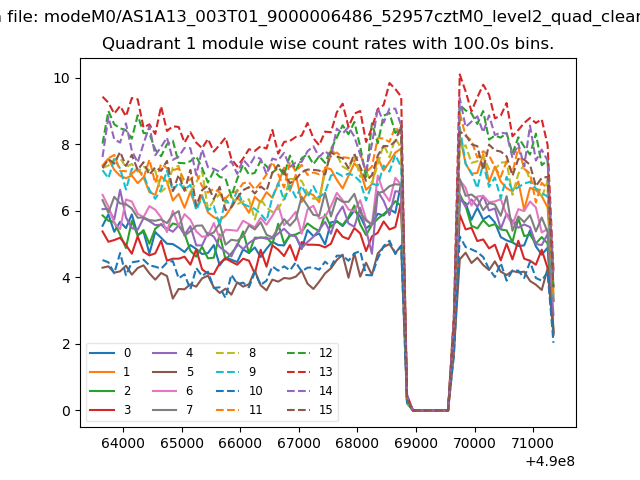
| Module-wise count rates for Quadrant A Data is divided into 100 sec bins |
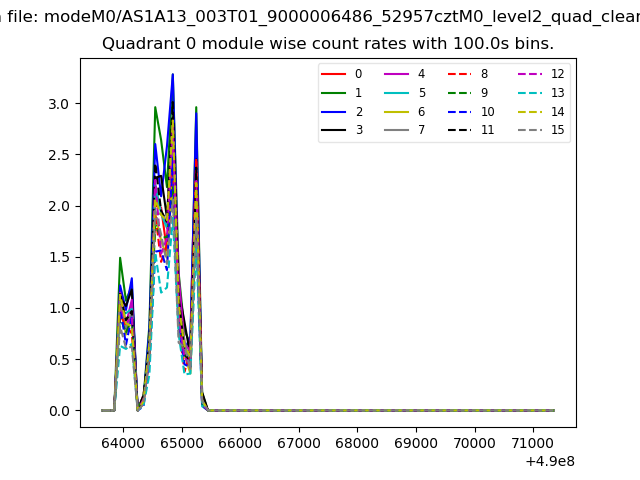 |
 |
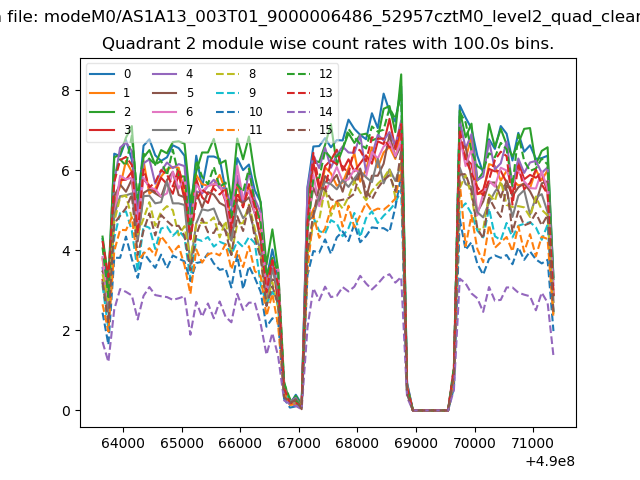
| Module-wise count rates for Quadrant B Data is divided into 100 sec bins |
 |
 |
| Module-wise count rates for Quadrant C Data is divided into 100 sec bins |
 |
 |
| Module-wise count rates for Quadrant D Data is divided into 100 sec bins |
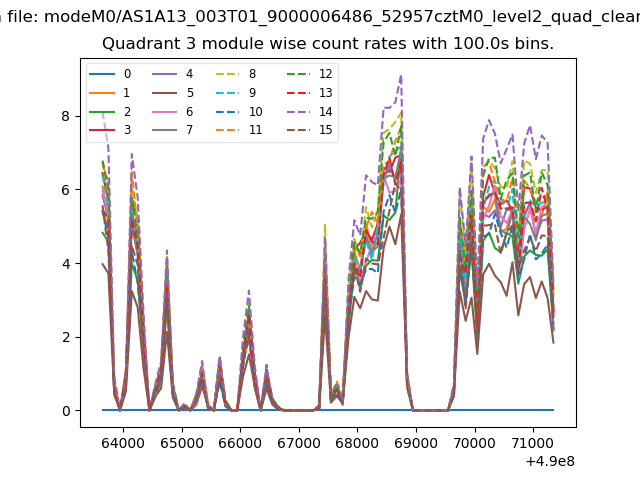 |
 |
| Parameter | Plot |
|---|---|
| CZT HV Monitor |  |
| D_VDD | 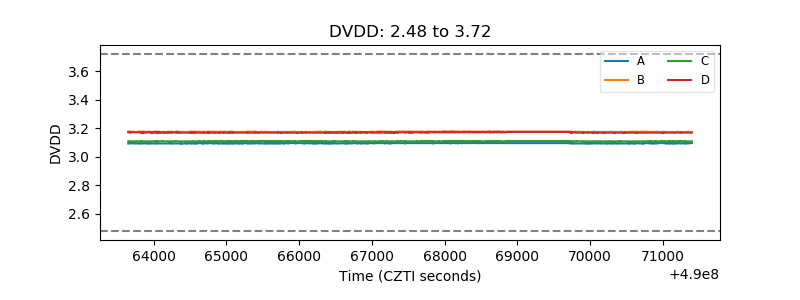 |
| Temperature 1 | 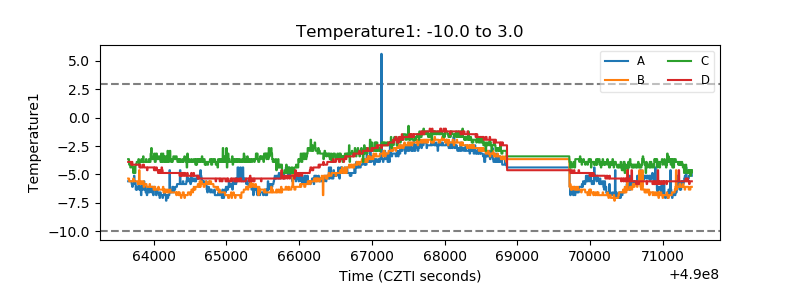 |
| Veto HV Monitor | 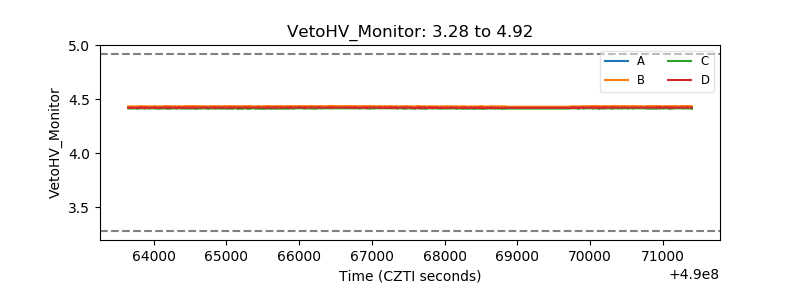 |
| Veto LLD | 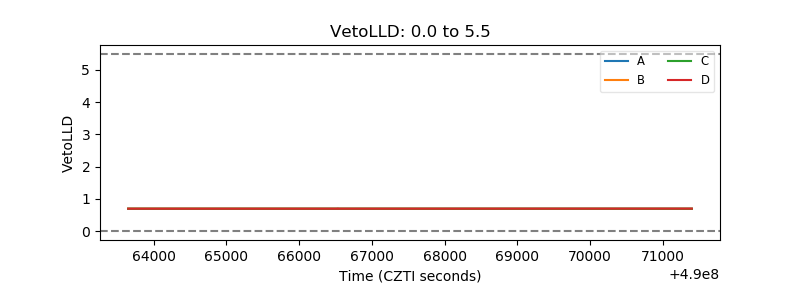 |
| Alpha Counter | 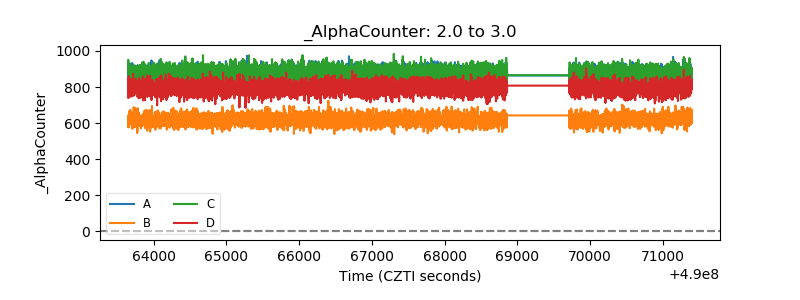 |
| _CPM_Rate | 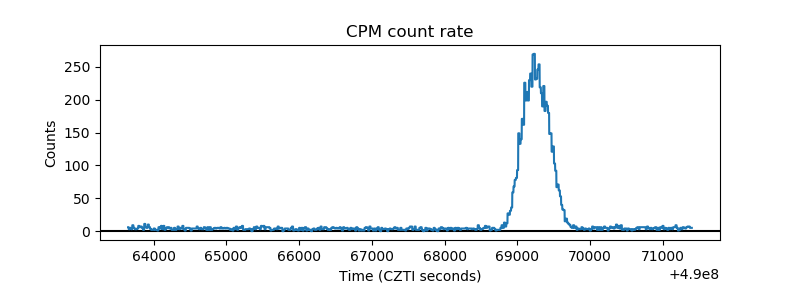 |
| CZT Counter | 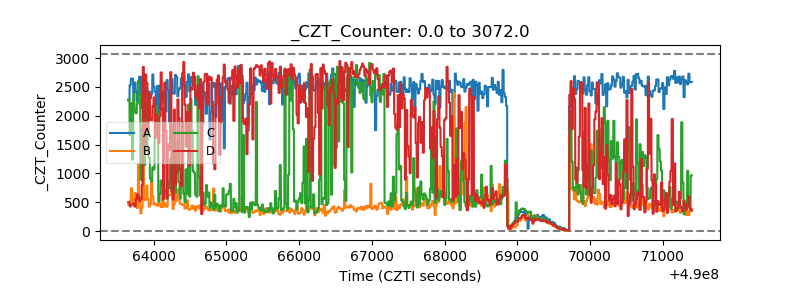 |
| +2.5 Volts monitor |  |
| +5 Volts monitor | 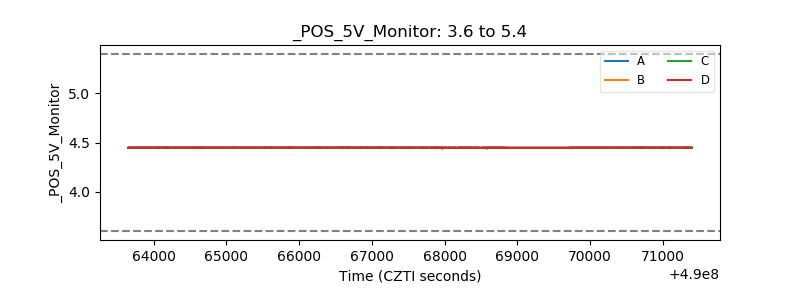 |
| _ROLL_ROT | 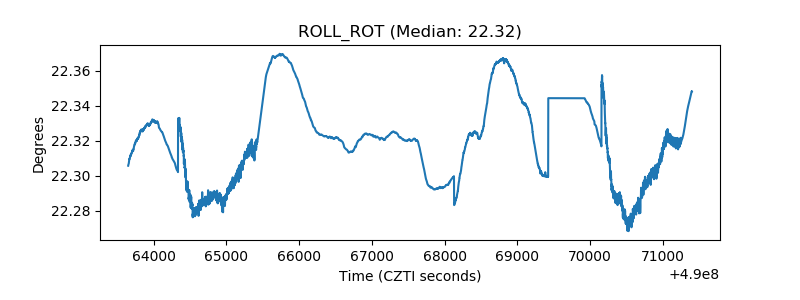 |
| _Roll_DEC | 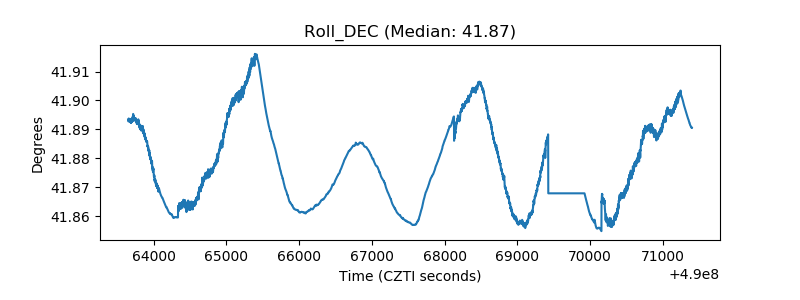 |
| _Roll_RA | 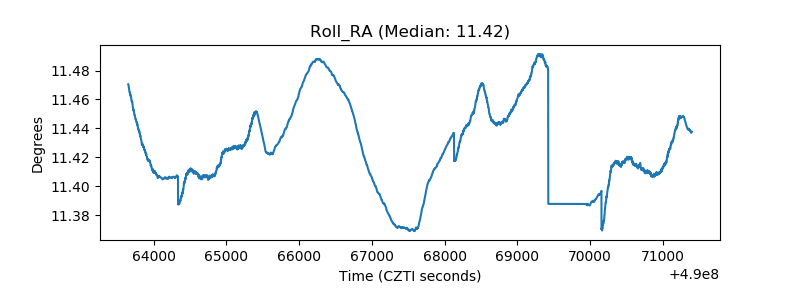 |
| Veto Counter | 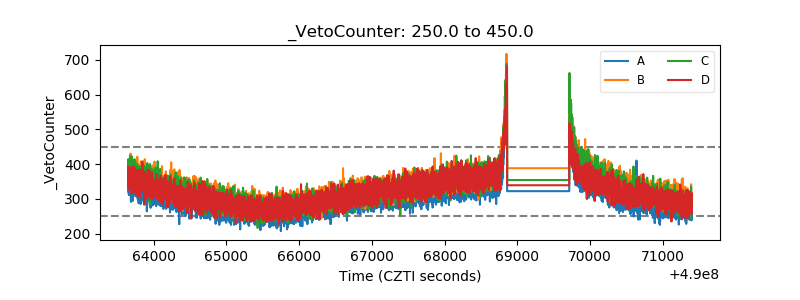 |