| Param | Original file | Final file |
|---|---|---|
| Filename | modeM0/AS1A13_003T01_9000006486_52959cztM0_level2.fits | modeM0/AS1A13_003T01_9000006486_52959cztM0_level2_quad_clean.evt |
| Size (bytes) | 889,064,640 | 79,306,560 |
| Size | 847.9 MB | 75.6 MB |
| Events in quadrant A | 16,739,934 | 151,130 |
| Events in quadrant B | 3,332,105 | 680,117 |
| Events in quadrant C | 6,472,444 | 566,255 |
| Events in quadrant D | 5,849,799 | 536,218 |
| Mode M9 | |||
|---|---|---|---|
| Quadrant | BADHDUFLAG | Total packets | Discarded packets |
| A | 0 | 10 | 0 |
| B | 0 | 10 | 0 |
| C | 0 | 10 | 0 |
| D | 0 | 10 | 0 |
| Mode M0 | |||
|---|---|---|---|
| Quadrant | BADHDUFLAG | Total packets | Discarded packets |
| A | 0 | 53990 | 0 |
| B | 0 | 14794 | 0 |
| C | 0 | 23854 | 0 |
| D | 0 | 22039 | 0 |
| Mode SS | |||
|---|---|---|---|
| Quadrant | BADHDUFLAG | Total packets | Discarded packets |
| A | 0 | 134 | 0 |
| B | 0 | 134 | 0 |
| C | 0 | 134 | 0 |
| D | 0 | 134 | 0 |
| Quadrant | Total seconds | Saturated seconds | Saturation percentage |
|---|---|---|---|
| A | 6652 | 6652 | 100.000000% |
| B | 6652 | 142 | 2.134696% |
| C | 6652 | 903 | 13.574865% |
| D | 6652 | 815 | 12.251954% |
Noise dominated data is calculated using 1-second bins in cleaned event files. If a bin has >2000 counts, and if more than 50% of those come from <1% of pixels, then it is considered to be noise-dominated and hence unusable.
| Quadrant | # 1 sec bins | Bins with >0 counts | Bins with >2000 counts | High rate bins dominated by noise | Noise dominated (total time) | Noise dominated (detector-on time) | Marked lightcurve |
|---|---|---|---|---|---|---|---|
| A | 7611 | 6651 | 6591 | 6591 | 86.60% | 99.10% | 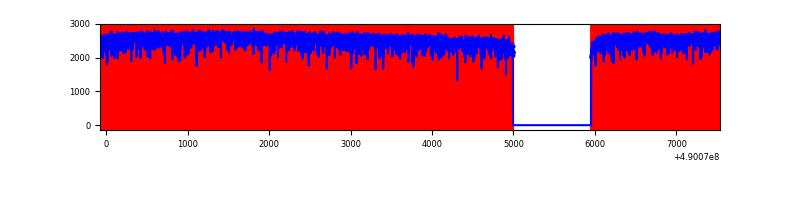 |
| B | 7612 | 6652 | 73 | 73 | 0.96% | 1.10% | 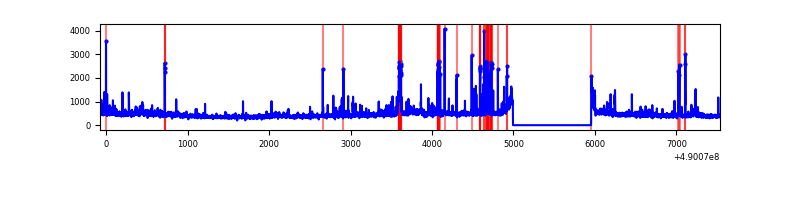 |
| C | 7612 | 6653 | 888 | 888 | 11.67% | 13.35% | 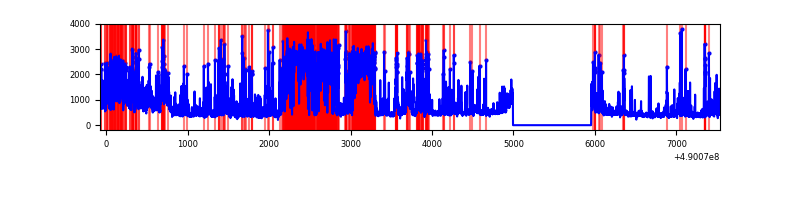 |
| D | 7612 | 6653 | 734 | 734 | 9.64% | 11.03% | 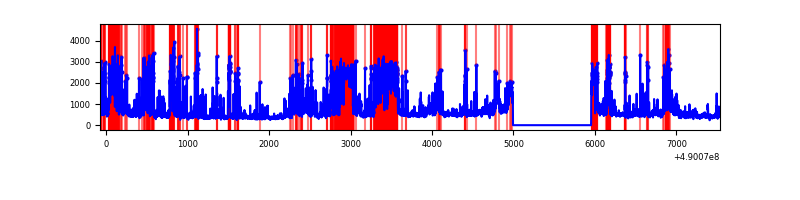 |
Top three noisy pixels from each quadrant. If the there are fewer than three noisy pixels in the level2.evt file, extra rows are filled as -1
| Pixel properties | Quadrant properties | ||||||
|---|---|---|---|---|---|---|---|
| Quadrant | DetID | PixID | Counts | Sigma | Mean | Median | Sigma |
| A | 9 | 191 | 15677158 | 342304.13 | 177 | 173 | 45.8 |
| A | 4 | 249 | 103902 | 2264.9 | 177 | 173 | 45.8 |
| A | 8 | 25 | 101183 | 2205.54 | 177 | 173 | 45.8 |
| B | 10 | 63 | 157123 | 1072.8 | 684 | 661 | 145.8 |
| B | 10 | 254 | 74324 | 505.08 | 684 | 661 | 145.8 |
| B | 5 | 172 | 58848 | 398.97 | 684 | 661 | 145.8 |
| C | 2 | 239 | 1659600 | 9382.2 | 637 | 632 | 176.8 |
| C | 1 | 241 | 627674 | 3546.2 | 637 | 632 | 176.8 |
| C | 2 | 12 | 403074 | 2275.99 | 637 | 632 | 176.8 |
| D | 2 | 62 | 1528122 | 8506.0 | 630 | 601 | 179.6 |
| D | 8 | 176 | 1148747 | 6393.45 | 630 | 601 | 179.6 |
| D | 15 | 78 | 172489 | 957.16 | 630 | 601 | 179.6 |
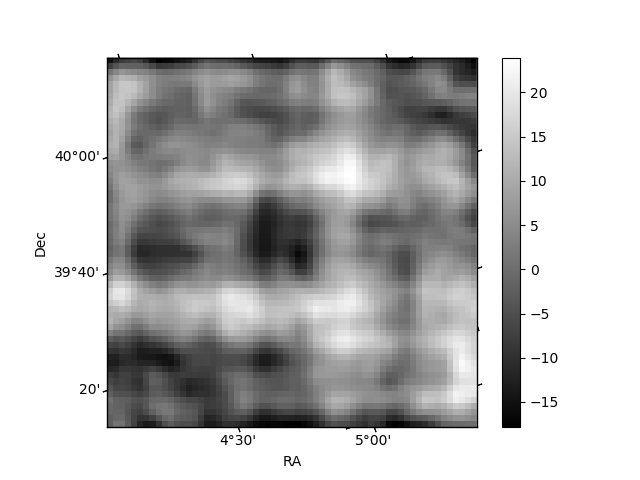
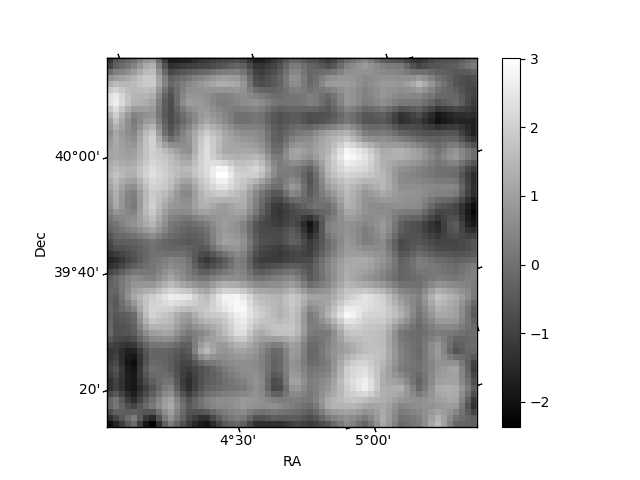
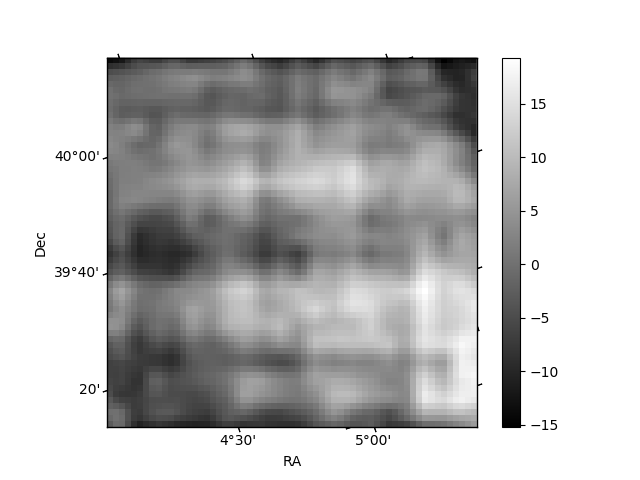
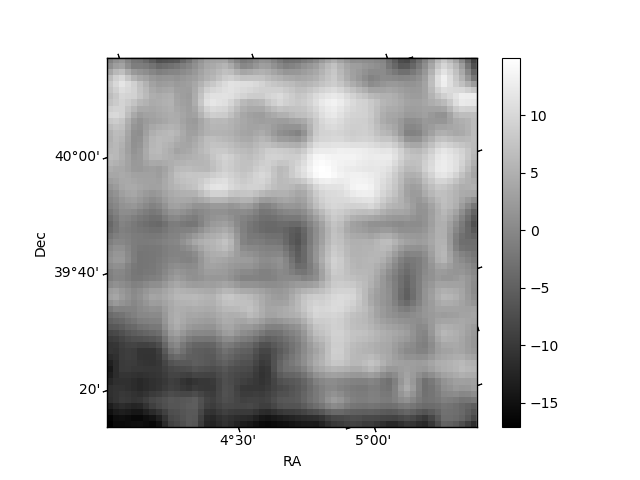
Histogram calculated using DETX and DETY for each event in the final _common_clean file
| Quadrant A | 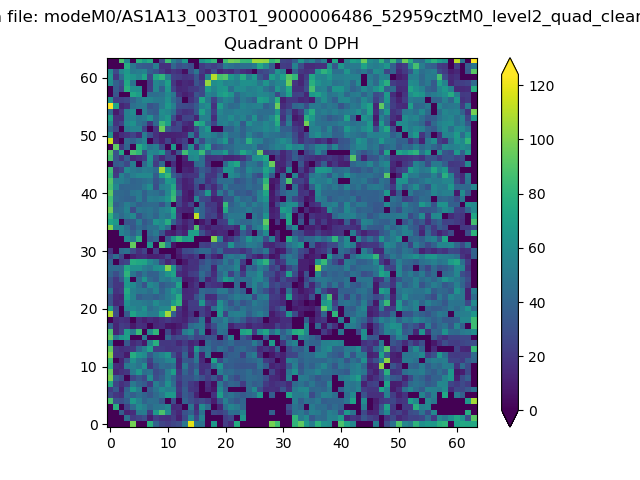 |
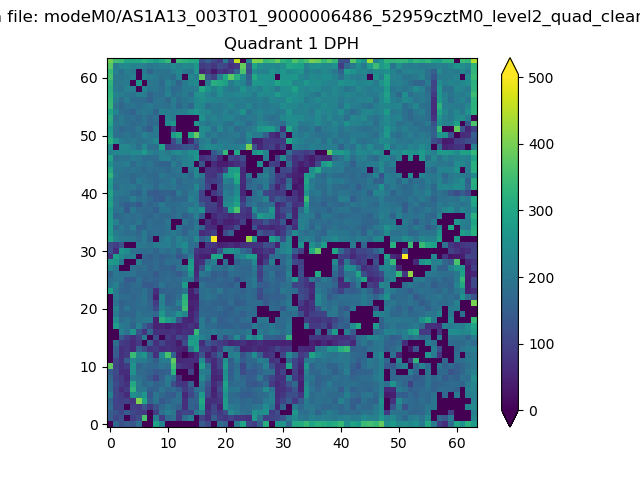 |
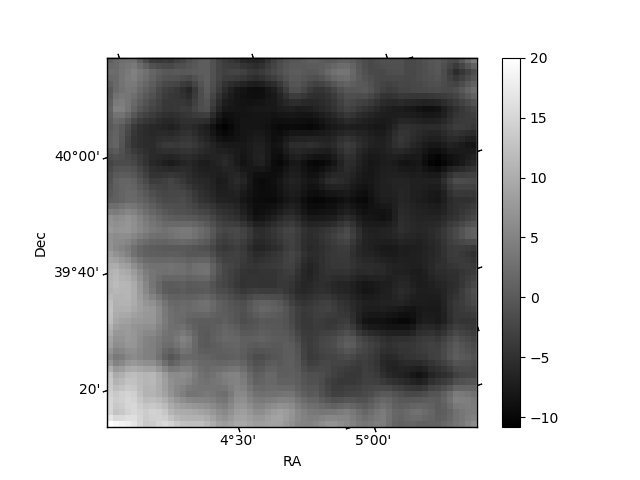
Quadrant B |
|---|---|---|---|
| Quadrant D | 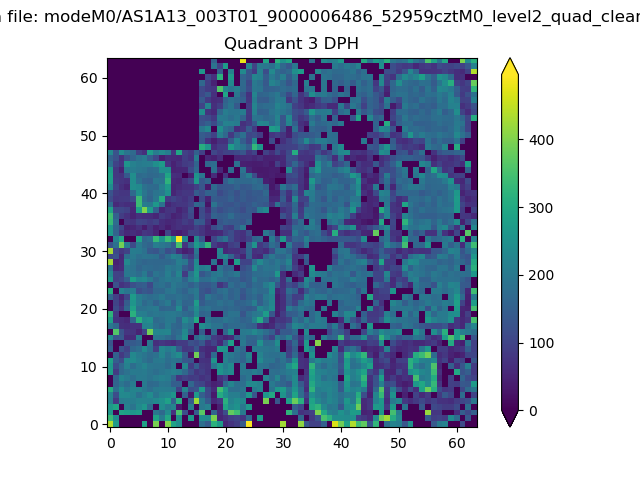 |
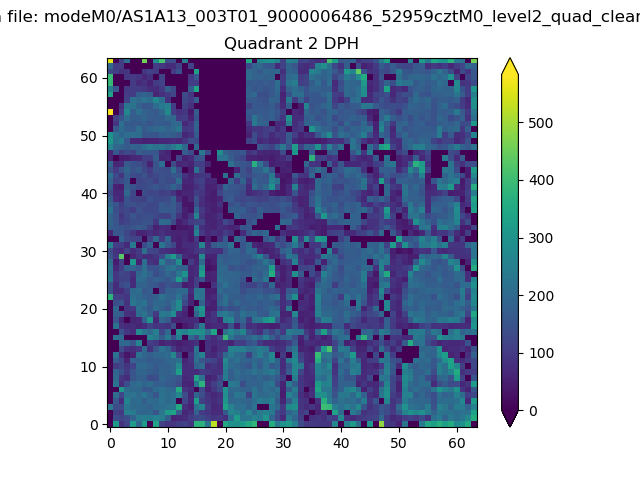 |
Quadrant C |
| Plot type | Count rate plots | Images |
|---|---|---|
| Comparison with Poisson distribution Blue bars denote a histogram of data divided into 1 sec bins. Red curve is a Poisson curve with rate = median count rate of data. |
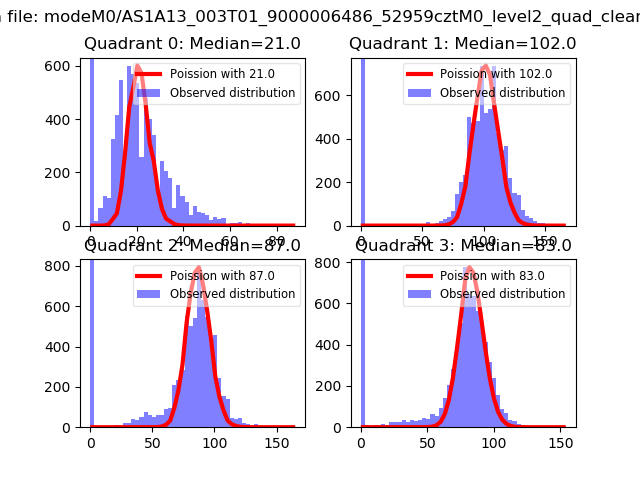 |
 |
| Quadrant-wise count rates Data is divided into 100 sec bins |
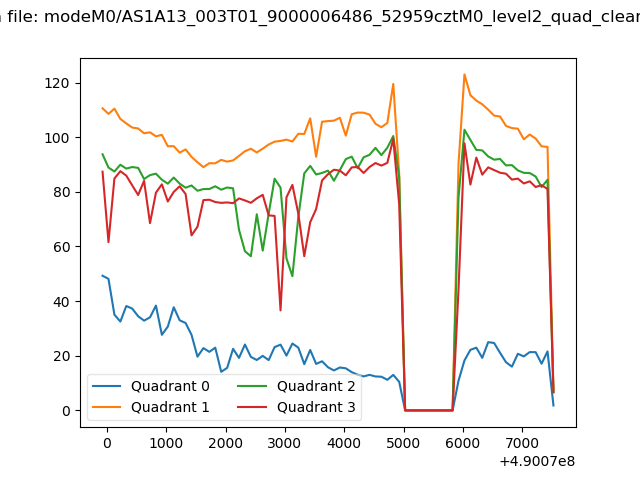 |
|
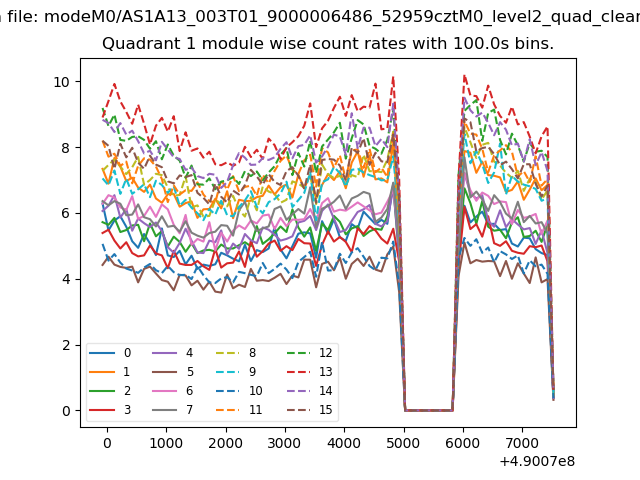
| Module-wise count rates for Quadrant A Data is divided into 100 sec bins |
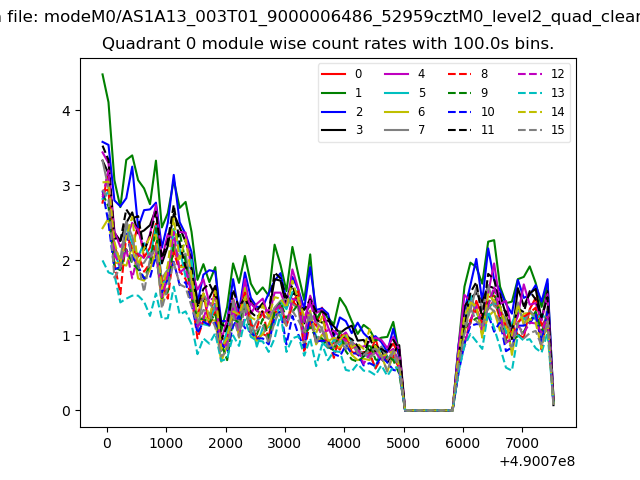 |
 |
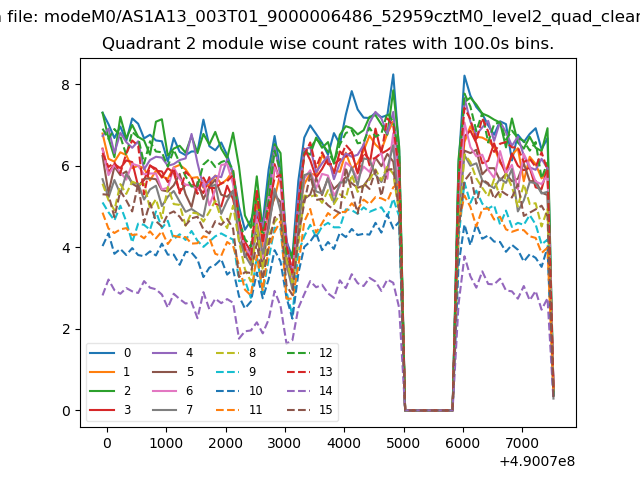
| Module-wise count rates for Quadrant B Data is divided into 100 sec bins |
 |
 |
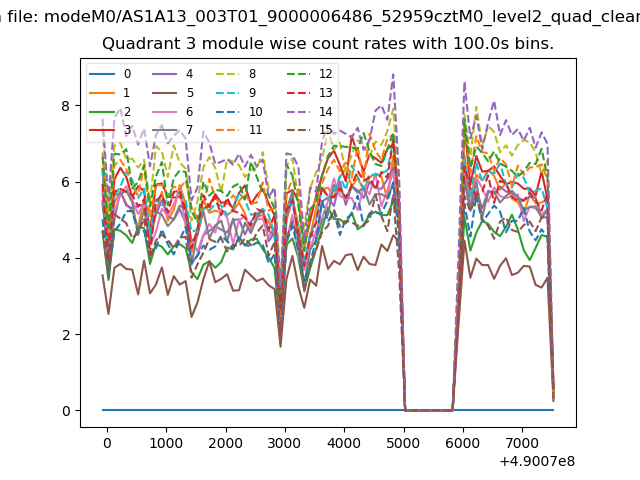
| Module-wise count rates for Quadrant C Data is divided into 100 sec bins |
 |
 |
| Module-wise count rates for Quadrant D Data is divided into 100 sec bins |
 |
 |
| Parameter | Plot |
|---|---|
| CZT HV Monitor | 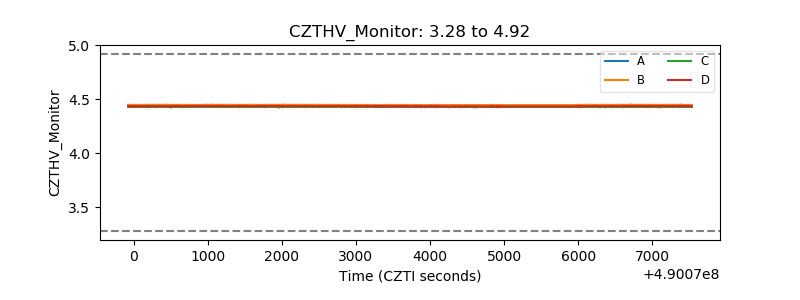 |
| D_VDD | 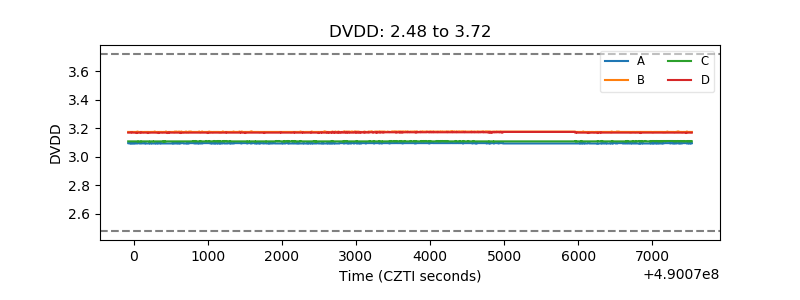 |
| Temperature 1 | 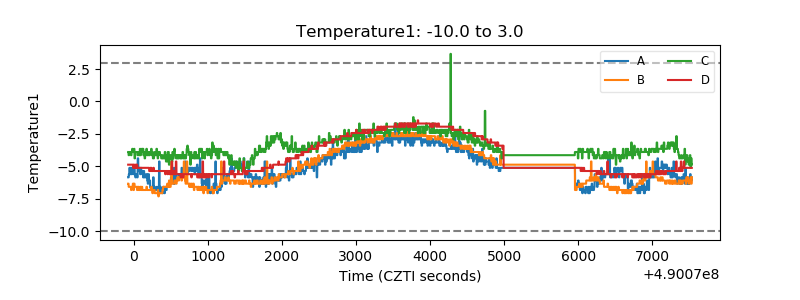 |
| Veto HV Monitor | 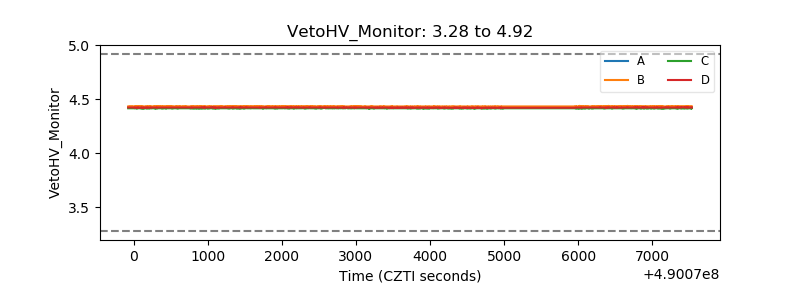 |
| Veto LLD | 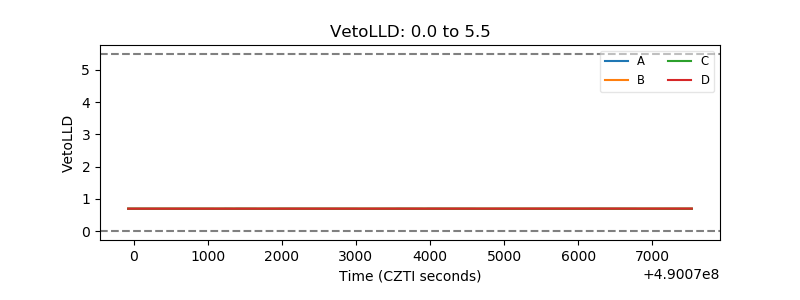 |
| Alpha Counter | 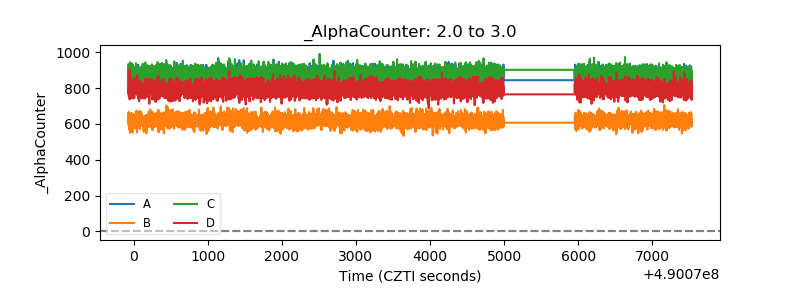 |
| _CPM_Rate | 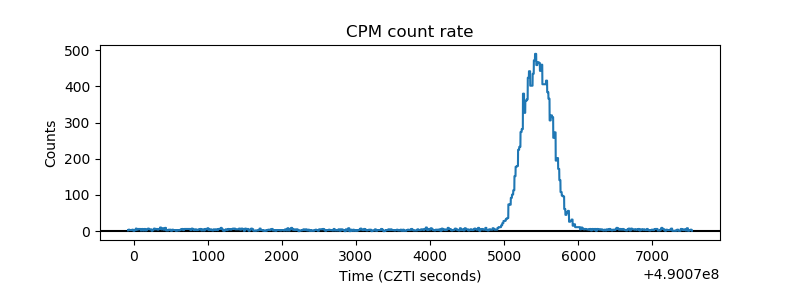 |
| CZT Counter | 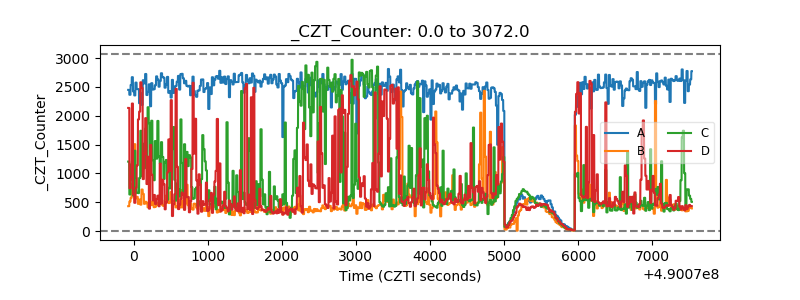 |
| +2.5 Volts monitor | 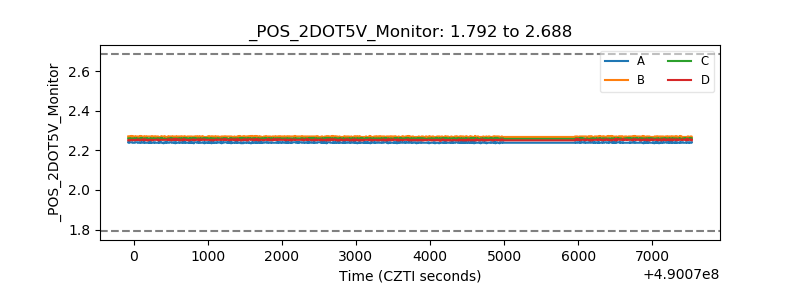 |
| +5 Volts monitor | 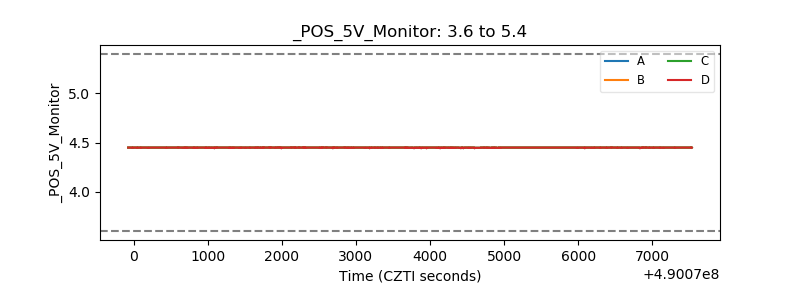 |
| _ROLL_ROT | 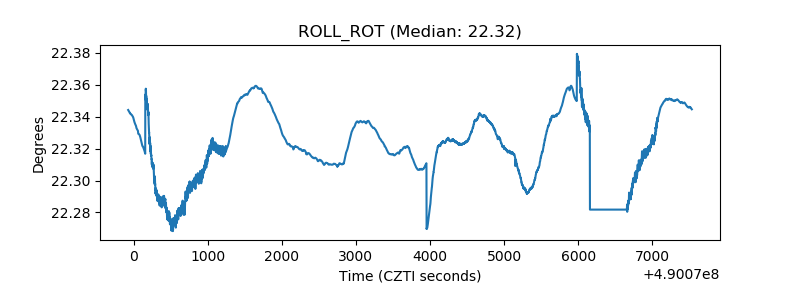 |
| _Roll_DEC | 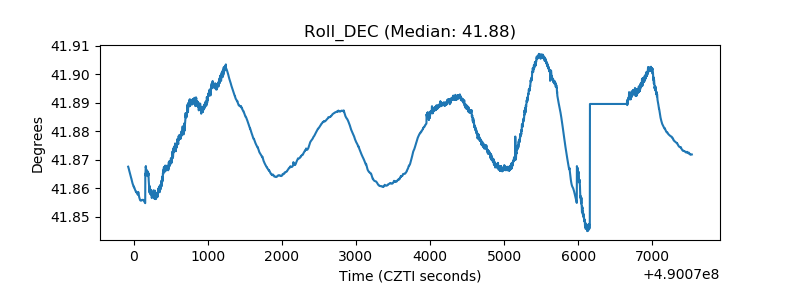 |
| _Roll_RA | 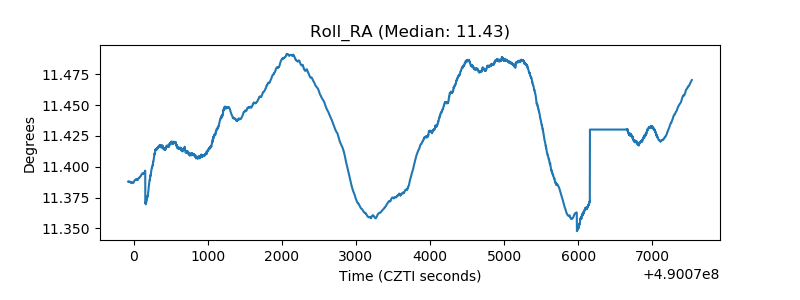 |
| Veto Counter | 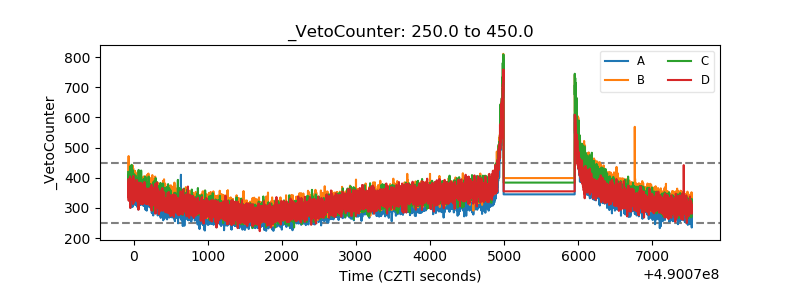 |